Research Article Open Access
Mice Gamble for Food: Individual Differences in Risky Choices and Prefrontal Cortex Serotonin
Elsa Pittaras1,2, Arnaud Cressant1, Pierre Serreau1, Jessica Bruijel1, Françoise Dellu-Hagedorn3, Jacques Callebert4, Arnaud Rabat2 and Sylvie Granon1*1Centre de Neuroscience Paris Sud, CNRS 8195, Université Paris Sud, Orsay, France
2Institut de Recherche Biomédicale des Armées, Brétigny-sur-Orge, France
3INCIA, CNRS, Université Bordeaux 2, Bordeaux, France
4Hôpital Lariboisière, Paris, France
- *Corresponding Author:
- Sylvie Granon
Centre de Neuroscience Paris Sud, CNRS 8195
Université Paris Sud, Orsay, France
E-mail: sylvie.granon@u-psud.fr
Received May 23, 2013; Accepted June 19, 2013; Published June 26, 2013
Citation: Pittaras E, Cressant A, Serreau P, Bruijel J, Dellu-Hagedorn F, et al. (2013) Mice Gamble for Food: Individual Differences in Risky Choices and Prefrontal Cortex Serotonin. J Addict Res Ther S4: 011. doi:10.4172/2155-6105.S4-011
Copyright: © 2013 Pittaras E, et al. This is an open-access article distributed under the terms of the Creative Commons Attribution License, which permits unrestricted use, distribution, and reproduction in any medium, provided the original author and source are credited.
Visit for more related articles at Journal of Addiction Research & Therapy
Abstract
Background: One of the fundamental questions in Neuroscience is to understand how we choose one option instead of another one when we are in uncertain or ambiguous situation. Some decisions have short- and long-term consequences. The Iowa Gambling Task (IGT) is classically used to study decision-making in humans because it mimics real life situations. By developing a new mice model, we aimed at studying behavioral traits and brain circuits that impact on inter-individual differences in decision making processes.
Methods: 72 male C57Bl/6J mice were used to adapt the IGT. We first attempted to adapt the task in operant chambers from rats’ works using long delays as penalties. Our results were not conclusive so we adapted the task to a maze version. Quinine pellets were used as penalties and food pellets as rewards. We also performed behavioral measures of anxiety, novelty exploration, locomotion and social interaction. Finally, we measured levels of monoamines in different brain tissues sampled from the mice subjected to the behavioral task.
Results: We show that transferring directly the protocol of the rat’s gambling task to mice using operant conditioning was not successful presumably because of species particularities, such as lower sensitivity to delay penalties. In the maze version, we found that mice exhibited a clear preference for small but safer rewards that allow the maximization of benefits in the long-term. We observed the progressive emergence of inter-individuals differences and specific behavioral and biochemical traits for each subgroup. Namely, risk-prone mice exhibited lower 5-HT level in the prefrontal cortex compared to the others.
Conclusion: We were thus able to validate a mouse gambling task and to determine individual profile close to the human and rat results. This study allows us to characterize within a healthy population, subgroups with different behavioral and biochemical profiles.
Keywords
Iowa gambling task; Mice, Gambling; Risky behavior; Uncertainty; Behavioral profile; Inter–individual differences; Prefrontal cortex; Serotonin; Dopamine
Introduction
One of the key questions in Neuroscience is to understand how we choose one option instead of another one when we are in uncertain or ambiguous situation. Making decisions encompasses the integration of potential rewards, punishments and uncertainty of outcomes that may occur both in the short or the long–term [1-3]. Therefore, making efficient decisions requires estimating costs and benefits of different actions.
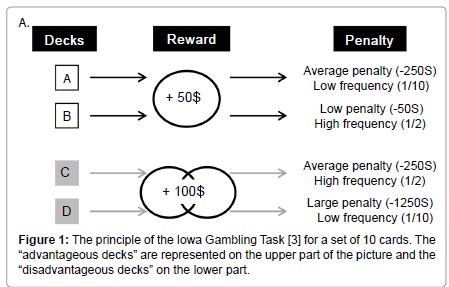
These processes have been associated to the activity of amygdala, prefrontal cortex, and the reward system both in humans and animals [4]. One test that has been widely adopted to study decision–making in humans is the Iowa Gambling Task (IGT), because it puts back a person in a complex and uncertain situation, close to real life [3]. In this task, the subject has to choose between four decks of cards that look identical but are associated with various money loss and gain. Two of these four decks are associated with a big immediate gain (100$) but also with large unpredictable money penalties (from 250$ to 1250$ withdrawal). These decks, named “disadvantageous decks”, are disadvantageous in the longterm because of these large unpredictable penalties. Conversely, the two other decks lead to a small immediate money reward (50$) but also to unpredictable small money penalties (from 50$ to 250$). In the longterm, these decks, named “advantageous decks”, are more advantageous than the first two decks. Subjects start to gamble with 2000$ and only know that they have to find the best way to maximize their gain on the long–term (Figure 1).
Using the IGT, decision–making deficits have been observed in different pathological populations like in addicted patients [5,6], schizophrenic patients [7,8], patients with feeding disturbances [9], or patients with intention deficit with hyperactivity disorder [10]. In a healthy population, a majority of subjects solves the task successfully. However a small proportion of subject doesn’t, thus leading to different subgroups of performers [11]. It may be hypothesize that healthy humans who can’t solve the IGT might show a risk factor more important to develop these disorders, as environmental factors are known to significantly favour the emergence of these disorders [12,13]. Understanding the mechanisms underlying decision–making could thus be a key to find successful treatments of neurological or psychiatric disorders, but also to study healthy subjects at risk. Moreover, the recent, and worldwide, legal opportunity for people to gamble on the web increases dramatically the risk for pathological gambling in the human population [14].
Inter–individual differences are particularly emphasized when decision depends on several factors, e.g., when it relies on several stimuli, on past outcomes, when the probability to experiment losses or gains varied. This kind of situation, frequently encountered in the real life, is emulated during the IGT [11]. The IGT is quite unique in its way to allow the study of decision making in a conflicting situation and in showing inter–individual variability in performance.
The interest to develop a rodent version of this task is therefore crucial because of the opportunity to investigate specific brain regions and circuits involved in the task, the impact of environmental factors, and their molecular and genetic correlates. Moreover, a mouse version of this task is expected to allow the study of decision making defects and their biochemical, molecular, or genetic bases in pathological and healthy animals thanks to the large spectrum of genetically modified mice. Several authors adapted in different ways the IGT in rats [12,15-20] and mice [16,21,22]. Interindividual variability was also observed in rats [20]. In addition, lesion of the ventro–medial part of the prefrontal cortex (vmPFC) led to poor performance both in humans [3] and in rats [20].
Here we aim at adapting the IGT in mice, based on different rodent protocols, in order to favour the emergence of inter–individuals differences. First we adapted the task in operant chambers [15,20]. Second, we focused on the adaptation of the task in a maze [16].
Our results first revealed that adapting to mice an operant task originally developed for rats might be unsuccessful because of species differences. Nevertheless, by adapting a gambling protocol we found appropriate conditions to show that mice can develop preferences for small immediate rewards in order to maximize their benefits in the long–term, like in rats and humans, providing that we use appropriate penalties. Finally, we observed inter–individuals differences during the MGT and determined specific behavioural and biochemical traits for each subgroup.
Materials and Methods
Animals
72 male C57Bl/6J mice, bred in Charles’ River facilities (Orleans, France) between 10 to 12 weeks old at the beginning of the experiments, were used. Mice were housed by two or three in a temperature controlled room (21°C ± 2°C) with a 12 h light/dark cycle (light on at 8:00 a.m.). All experiments were performed during the light cycle between 9:00 a.m. and 6:00 p.m. Mice were isolated during three weeks after the completion of the Mouse Gambling Task in order to perform the Social Interaction Task (SIT).
According to the experiment mice could be either food deprived (if the reward was food) or water deprived (if the reward was liquid). Food and water were given to adjust and maintain mice at 85% of their free feeding weight. For experiment that didn’t request deprivation mice received standard food and water ad libitum.
Animals were treated according to the ethical standards defined by the Centre National de la Recherche Scientifique for animal health and care with strict compliance with the EEC recommendations (n°86/609).
Behavioral Apparatus and Procedures
Mouse gambling task in operant chambers
Apparatus: This part of the work was based on previous rat’s works [15,20]. Eight identical operant chambers (20 cm × 24 cm × 16 cm) were used (Imetronic®, Pessac, France). Operant chambers contained four holes equipped with infrared beams detecting nose pokes and which could be illuminated. Each box included a house light system delivering approximately 20 lux of white diffuse light, a tone speaker and a magazine located on the wall opposite to the holes and was connected to a syringe of 5 ml that delivered liquid rewards. The magazine was equipped with an infrared beam detecting head entries. Rewards consisted of sweet condensed milk (Nestlé®) diluted at 10% in water.
Mice were given one daily experimental session. Between each mouse the operant chamber was cleaned with a solution of 10% of alcohol.
Procedures: Before being trained in the MGT procedure per se, mice had to associate a nose poke with the delivery of a reward in the magazine, and to be aware that small (14.5 μl) and high (29 μl) rewards existed.
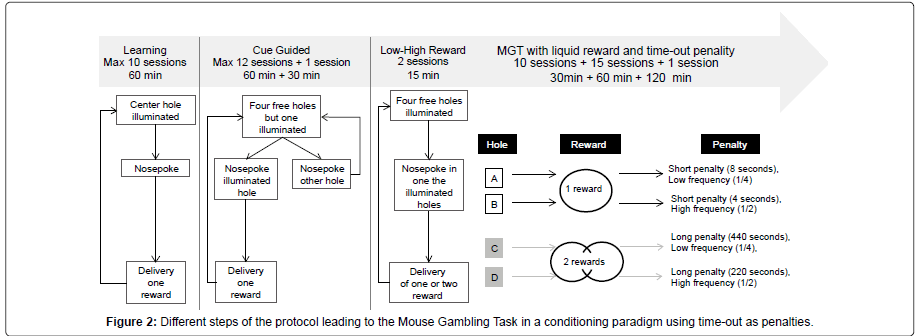
During learning sessions, animals had to make a nose poke only when the center hole was illuminated (all other holes were blocked). One nose poke led to the delivery of a small reward in the magazine, and lighting off the operant chamber. A mouse went to the next step only if it obtained 80 rewards during two consecutive days. To reach the criterion a maximum of ten sessions was necessary for three mice out of twelve; the remaining mice needed fewer sessions.
During the cue guided sessions, the task was quite similar except that 4 holes were available for nose pokes but only one of them was randomly illuminated and led to reward delivery if a nose poke was detected. For example, if at the beginning of a trial hole A was illuminated, a nose poke in this hole led to the reward while a nose poke in any other hole led to the beginning of a new trial without delivery of any reward. This procedure, aimed to push animals to explore each hole, continued daily until mice got 70 rewards for two consecutive days. A maximum of twelve sessions was necessary for four mice to reach the criterion. The other mice went to the next step before doing the twelve sessions. After reaching the criteria, mice made one more session, which lasted 30 min. No criterion of performance was fixed for this session.
During the Low versus High Reward sessions, animals had to make a nose poke in one of the four holes when it was illuminated. There were only two 15–min sessions: during the first one, a nose poke led to the delivery of one reward while during the second one, a nose poke led to the delivery of two rewards. No criterion was fixed for this step.
Finally, mice were submitted to the Mouse Gambling Task (maximal duration: 30 min). Four holes were illuminated and mice were free to choose one of the four holes leading to the delivery of one reward and, according to different probability, to a time–out (which varied from 4 sec to 440 sec). Each hole was associated with a different outcome: holes A and B led to a low reward and a short penalty (8 or 4 sec) with low (1/4) and high (1/2) probability respectively. Holes C and D led to a high reward and a long penalty (220 or 440 sec) with low (1/2) or high (1/4) probability respectively. To maximize their gains mice would have to choose mostly short immediate rewards associated with short timeouts, and to avoid higher immediate rewards associated with longer penalties (Figure 2).
We assessed the effect of the duration of the session: first we made 10 sessions which lasted 30 min; second, we made 15 sessions which lasted 60 min, and third we made 1 session which lasted 120 min. So each mouse made 26 MGT sessions in total.
Mouse gambling task in a four arm maze
This version of the MGT took place in a maze made of four transparent arms (20 cm long × 10 cm wide), a start box (20 cm × 20 cm) and a choice area. Between each mouse the maze was cleaned with a 10% of alcohol solution.
Mice were first food deprived and habituated to eat food pellets in operant chambers during 10 daily sessions. They had to make one nose poke into the central hole to obtain one food pellet. Animals ate a maximum of 65 pellets during the 30 min daily session. After habituation to the pellets in the operant chamber, the MGT started in the four arm maze.
This version was conducted as described previously [16]. Briefly, reward was standard food pellets while penalty consisted of food pellets previously steep in a 180 mM solution of quinine [16]. These pellets were unpalatable but not uneatable. If mice consumed quinine pellets voluntarily they were excluded from the study.
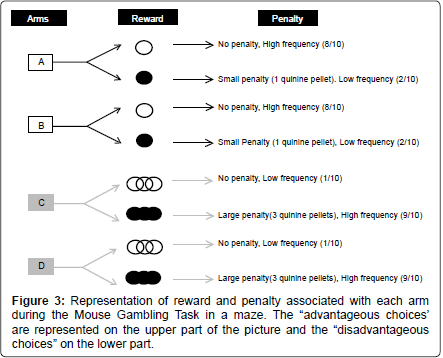
At the end of each arm mice found different outcomes: “risky” arms had a low probability (1/10) to lead to 3 food pellets, and a high probability (9/10) to lead to 3 quinine pellets. “Safe” arms had a high probability (8/10) to lead to 1 food pellet and a low probability (2/10) to lead to 1 quinine pellet. The position of food or quinine outcomes was randomly assigned to each arm before the experiment started, and this repartition was randomly assigned among animals (Figure 3).
Behavioral procedure: Each mouse was habituated to the maze for 5 min the first day (i.e. before the beginning of the trials), and during 2 min for subsequent days. During the first habituation day, food pellets were put directly on the floor of the maze to train animals to eat in the maze. If mice didn’t eat any food pellets during the first habituation a second similar 5–min habituation period was conducted the second day.
Each trial began with the mouse placed in the starting box for 15 sec. Then it was free to choose one of the four arms and allowed to eat pellets at the end of the arm. The mouse was then put back in its home cage for 30 sec while the floor of the maze was cleaned with a solution of 10% alcohol. Once the mouse reached the middle of one arm, its choice was considered made and it was not allowed to correct it. Each mouse was given 10 daily trials for 10 days (for a total of 100 trials as in the human task). If a mouse didn’t make a choice within 2 min, it was returned in the start box during 15 sec. If the mouse still didn’t make any choice during the next 2 min, an omission was scored. Mice that didn’t make any choice after 5 days were excluded from the study.
If a mouse chose the same arm 90% of the time or more for the last three sessions, it was discarded because of presumed spatial bias.
Subgroup formation: To separate animals into three subgroups based on their choices in the MGT, we used the k–mean clustering separation [23] using IBM SPSS software. Each animal belongs to a set that had the closest mean to its own performance value. Values of individual performance that were used for the k–mean clustering were means shown by each mouse for the three last MGT sessions.
Following the MGT, mice were all tested in the other behavioral task in the same order: novelty exploration, light/dark anxiety test, emergence test and social interaction task.
Novelty exploration
Novelty exploration was measured in a transparent empty Plexiglas cage (50 cm × 30 cm × 30 cm). We virtually divided the surface of the floor in eight equal areas and determined locomotor activity of the animal by scoring the number of visited areas. We also scored the number of rearing (against the wall or not) and of grooming. We gently put the animal in the center of the cage and scored the different criteria for 10 min. We distinguished the first and last 5 min of the experiment as an index of habituation. The light was set at 100 lux in the middle of the cage. Between each mouse, the cage was cleaned with 10% of alcohol. Scoring was made on line.
Emergence task
Risk taking was measured in a large white openfield (diameter of 110 cm and light set at 100 lux in the middle) connected to a small black start box (20 cm × 20 cm) protected from light by a cover.
The experiment lasted 15 min and began with the animal in the black box. The time took by the mouse to exit the small black box and emerge in the openfield was recorded. The animal was considered in the openfield if it had the head and the 2 forepaws in. We also recorded the total time spent in the openfield, the number of visit in its center (surface equal to 20% of the total area), and the number of transitions between the openfield and the small black box.
The apparatus was cleaned between each mouse with 10% of alcohol. Scoring was made on line.
Light–dark anxiety task
The apparatus (Imetronic, Pessac, France) was fully automated and made of two small boxes (20 cm × 20 cm): one black and protected from light by a cover and the other one white and brightly illuminated (1200 Lux).
The experiment lasted 10 min. The mouse was gently placed in the corner of the light box and could move freely from one compartment to the other through a dark corridor. The data was computerized automatically (Imetronic, Pessac, France). The behavioral measures were: initial latency to escape the light box, number of entries in the dark box, and total time spent in the light compartment. Between each mouse, the apparatus was cleaned with a solution of 10% alcohol.
Social Interaction Task (SIT)
The Social Interaction Task was conducted as describe previously [24]. This task took place in transparent Plexiglas cage (50 cm × 30 cm × 30 cm) containing clean bedding for each dyad of mice. The light in the room was provided by indirect white bulbs and was set at 100 lux in the middle of the cage. The day of the experiment, each tested animal (named “host”) was allowed to visit alone the novel environment during 30 min. After this habituation period, a visitor mouse was introduced in the cage for 8 min. Host mice were isolated for three weeks prior to the SIT in order to increase its motivation for social contact while visitors were reared in social cages (4 mice per cage). The experimental cage was located on a table, under a numeric video camera (Hercules®) connected to a computer located outside of the experimental room for video recording and off line analyses.
We scored off–line manually the duration of social contacts, the number of follow behaviors as well as dominance and aggressive behaviors. Dominance behavior was reflected by the number of time the host mouse put its forepaws on the back or on the head of the visitor. Aggressiveness was reflected by the number of attacks and tail rattling that the host mouse performed [24].
In addition, we analyzed in more detail the social behavior of the two extreme “safe” and “risky” subgroups with the Miceprofiler software [24]. It allowed us to discriminate different subtypes of social contact (e.g., oro–oral, oro–genital and side) and the duration of postures previously shown to be important for flexible decisionmaking in various behavioral tasks [24,25]. Notably, we quantified the time spent in short “stop” behaviors. Such posture doesn’t reflect fearful behavior or anxiety of any kind as it was not scored when animals were completely immobile for long periods, as freezing would be. Rather, it matched with very slow movements (<1.75 cm/sec), when animals didn’t necessarily go forward. During these short stop behaviors, mice could thus rear, sniff, and make scanning head movements [25]. These stop behaviors were shown to be of particular importance because they constitute choice points, either during social interaction [24] or novelty exploration [25].
Analysis of brain monoamines
Analysis of brain monoamines was made approximately 4 months after completion of the last behavioral task. In order to determine constitutive brain levels of monoamines in mice, we dissected out two brains areas of the mice: the medial prefrontal cortex and the dorsal striatum. All animals were killed by short exposure to volatile anesthetic (isoflurane®) immediately followed by cervical dislocation. Prefrontal cortex and striatum were rapidly dissected under a binocular microscope and frozen in dry ice. Prior to analysis, brain tissues were crushed in 200 μl of 0.2 M perchloric acid and centrifuged at 22000 g for 20 min at 4°C. The supernatants were collected and filtered through a 10 kDa membrane (Nanosep, Pall) by centrifugation at 7000 g. Then, a 20 μl aliquot of each sample was analyzed for serotonin by fluorometric detection (Kema). The amounts of catecholamines (dopamine and noradrenaline), 5–HT, and their metabolites (DOPAC, HVA, and 5HIAA) were measured by electrochemical detection on a serial array of coulometric flow–through graphite electrodes (CoulArray, ESA) (Gamache).
The analysis, data reduction, and peak identification were fully automated. Results were expressed as fentomoles/mg fresh tissue [26,27].
Statistical analysis
MGT: To see if the preference during the MGT differed from chance level, we used a Student t test. We used repeated measures ANOVA to see if there was a subgroup effect, a session effect, or an interaction session X subgroup. Post–hoc t tests were used when appropriate. The non–parametric Kruskall Wallis test was subsequently used to assess differences between the subgroups at each session, as the number of animals in each subgroup was small.
Other behavioral tasks: The non–parametric Kruskall Wallis test was used to evidence the differences between the 3 subgroups for all parameters of the various behavioral tasks. To compare only two subgroups together we used the non–parametric Mann Whitney test.
To see if animals showed normal habituation in the various behavioral tests we used repeated measures ANOVAs followed by nonparametric Wilcoxon Signed Rank when appropriated.
Results
Among the 72 mice one died and 9 were excluded from the study because they didn’t reach behavioral criterions detailed in the Materials and Methods section.
Mouse gambling task in operant chamber
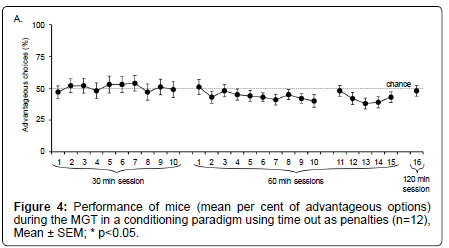
As illustrated on Figure 4, we first observed that mice did not show any preference for the different options. Indeed, even after 10 daily 30– min sessions, the percentage of advantageous choices was at chance level (t test; p>0.05).
When sessions lasted for 60 or 120 min, mice did not show any preferences either (t test; NS). Some sessions were statistically different from each other (t test : session 2 ≠ session 12, p=0.0349; session 2 ≠ session 24, p=0.0474; session 5 ≠ session 23, p=0.0406; session 5 ≠ session 24, p=0.0449; session 6 ≠ session 23, p=0.0363; session 6 ≠ session 24, p=0.0411; session 7 ≠ session 23, p=0.0499; session 11 ≠ session 24, p=0.0414; session 13 ≠ session 24, p=0.0485). However, these differences were not stable.
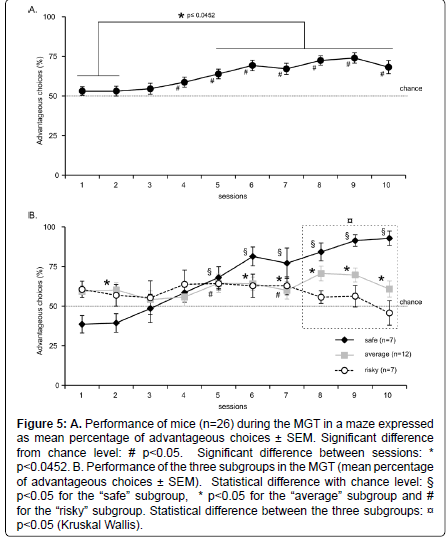
Figure 5::A. Performance of mice (n=26) during the MGT in a maze expressed as mean percentage of advantageous choices ± SEM. Significant difference from chance level: # p<0.05. Significant difference between sessions: * p<0.0452. B. Performance of the three subgroups in the MGT (mean percentage of advantageous choices ± SEM). Statistical difference with chance level: § p<0.05 for the “safe” subgroup, * p<0.05 for the “average” subgroup and # for the “risky” subgroup. Statistical difference between the three subgroups: p<0.05 (Kruskal Wallis).
Whatever the duration of the experiment, mice did not show any stable preference between advantageous and disadvantageous options, when the penalty was represented by a time–out.
Mouse gambling task in a four arms maze
We reasoned that time–out as penalty may not be as negative for mice as it is for rats. We therefore decided to change the nature of the penalty and conducted the experiment in a maze, which allows the possibility to use food pellets as positive outcomes, and quinine pellets as negative ones.
Four mice were discarded because they developed a spatial bias.
Results showed that at the beginning of the experiment, mice chose equally between the different options (Figure 5A). However, from session 4, the majority of mice chose more often the advantageous options compared to chance level (t test: p<0.01). Unlike in operant chambers, there was an increase in the percentage of advantageous choices. Moreover, this increase remained stable (t test: session 5 didn’t differ from sessions 6 to 10, p>0.05). There was a significant session effect (Repeated measurement ANOVA, F2,9=7.212, p<0.0001) and post–hoc tests revealed that sessions 1 and 2 differed significantly from sessions 5 to 10 (t test, p<0.0452).
Our results showed that from session 4, most mice chose advantageous options, and their preference for advantageous outcomes was steady.
Subgroup formation and inter–individual preferences
When considering the whole group, mice initially investigated equally the different options. However, they didn’t exhibit similar level of preference at the end of the experiment (Figure 5B). We thus used the k–means clustering method to separate the 3 subgroups statistically. The calculation was based on the mean of the animal’s preferences for the 3 last sessions to ensure of the stability of preference. Indeed, some mice developed a tendency to choose more often the “risky” options while others strongly preferred the “safe” options. Finally, another subgroup of mice has an intermediate preference pattern. The three subgroups are thereafter called “safe”, “average”, and “risky”.
Three mice that had the same mean of performance for the three last sessions could belong either to the “average” or to the “risky” groups. As their performance was closer to that of animals with average performance than to the risky one, we put them in the “average” subgroup.
Preferences of each group of mice during the 10 daily sessions are represented in (Figure 5B). Seven out of twenty–six animals chose significantly more often safe options at the end of the experiment (t test for session 8: Z=6.492, p=0.0006; session 9: Z=3.042, p=0.0227; session 10: Z=10.190, p<0.0001). In contrast, seven animals chose as frequently “risky” and “safe” options for the 3 last MGT sessions (t test for session 5: t=3.873, p=0.0082; session 7: t=2.465, p=0.0488; session 8: Z=1.549, p=0.1723; session 9: Z=1.013, p=0.3500; session 10: Z=–0.596, p=0.5729). Twelve mice out of twenty–six mice showed significantly lower preference for safe options than animals of the “safe” subgroup (60% of advantageous choices versus 85%, Figure 5B) (t test for session 8: Z=6.564, p<0.0001; session 9: Z=6.127, p<0.0001; session 10: Z=3.027, p<0.0001).
There was a significant interaction session X subgroup (repeated measures ANOVA: F2,18=4.578; p<0.0001). Moreover, there was a significant difference between the 3 subgroups for session 1 (Kruskall Wallis, H=8.371; p=0.0152), 8, 9 and 10 (Kruskall Wallis, p<0.0035).
Behavioral and biochemical characterization of the 3 subgroups
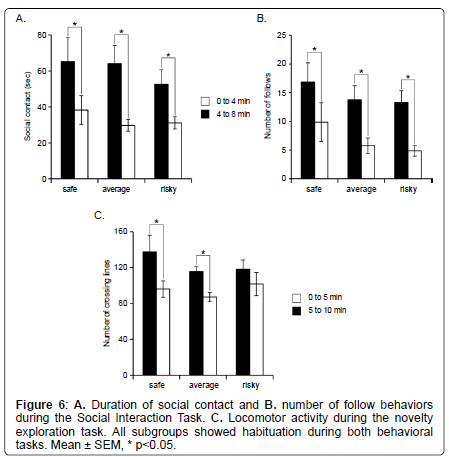
Novelty exploration: The 3 subgroups didn’t show any difference for locomotor activity (Kruskall Wallis: H=2.174, p=0.3373). However, despite a similar activity, only mice of the “safe” and “average” subgroups showed habituation during novelty exploration (repeated measures ANOVA, time effect: F2,1=24.817, p<0.0001; Wilcoxon: “safe” Z=–2.366; p=0.0180; “average” Z=–2.824, p=0.0047; “risky”: Z=–1.352; p=0.1763) (Figure 6C).
The 3 subgroups did not show any significant difference for the number of rearing during this task (H=1.992, p=0.3693; data not shown). In addition, we observed a similar transfer in all subgroups from the rearings against the wall to the free ones (when the animal reared without touching the walls) with time (Wilcoxon Signed Rank; safe: wall, Z=–2.366; p=0.0180; free: Z=–2.207; p=0.0277; average: wall, Z=–2.049; p=0.0409; free: Z=–2.934; p=0.0033; risky: wall, Z=–2.366; p=0.0180; free: Z=–2.201; p=0.0277).
Social behavior: Social behaviors did not differ between the 3 subgroups. Indeed, there was no statistical difference between subgroups for the social contact duration (Kruskall Wallis: H=0.375, p=0.8292) and the number of follows (Kruskall Wallis: H=1.271, p=0.5297) (Figure 6A and 6B). In addition, we measured a significant decrease with time of the duration of social contact for all 3 subgroups (Wicoxon Signed Rank; safe: Z=–2.028; p=0.0425; average: Z=–3.059; p=0.0022; risky: Z=–2.366; p=0.018) and of the number of follow behavior (Wicoxon Signed Rank; safe: Z=–2.196; p=0.0280; average: Z=–2.934; p=0.0033; risky: Z=–2.366; p=0.0180) (Figure 6A and 6B), suggesting that all animals showed normal habituation to the task.
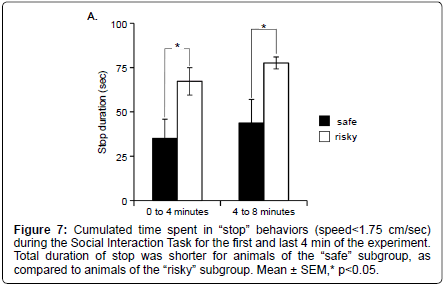
Using more detailed analyses with the MiceProfiler software, we observe that animals of the “safe” subgroup spent less time in “stop” behaviors than animals of the “risky” subgroups during SIT (Mann Whitney: 0 to 4 minutes Z=–2.108, p=0.035; 4 to 8 minutes Z=– 2.364, p=0.0181) (Figure 7). None of the other parameters differed significantly between the 3 subgroups (data not shown).
Anxiety: Emergence and light/dark tasks were used to estimate mice anxiety. It is important to notice that animals started the emergence task in the dark box while they started the light/dark task in the illuminated box. Therefore, initial latency to emerge in the large illuminated open field and to escape the light area (in the light–dark test) had opposite values. Subgroups didn’t differ from each other during the emergence task for the latency to emerge (Kruskall Wallis: H=0.003, p=0.9983), the time spent in the light box (Kruskall Wallis: H= 1.421, p=0.4915), and the mean time per exit (Kruskall Wallis: H=2.103, p=0.3495). Subgroups didn’t differ either during the light/dark task for the latency to escape the light box (Kruskall Wallis: H=1.672, p=0.4335) and the total time spent in the light area (Kruskall Wallis: H=0.392, p=0.7677).
Independently of the subgroups, we looked at the repartition of the animal scores around the median (all mice together) for different anxiety parameters and calculated the percentage of animals in each subgroup (“risky”, “safe” and “average”) with scores above the median. The median of the time spent in the openfield during the emergence task was 51.83. Our results show that 71% of animals with “risky” preference in the MGT were over the median, showing that in the emergence task, the majority of animals with “risky” MGT preference spent more time in the large illuminated openfield than animals of the two other subgroups (Figure 8A). They also crossed more the center of the openfield (57%), which was the more stressful part of the environment, and had an average duration of exit more important (57.1%) than animals of the two other subgroups (Figure 8B).
During the light/dark task, a majority of animals with “risky” MGT preference had shorter latency than mice of other subgroups to exit the light box (42.8%), and spent more time in it than other animals (57%) (Figure 8B).
In conclusion, animals with “risky” MGT preference exhibited a particular pattern during anxiety tasks. They seemed to favor safer behavior at the beginning of the experiment, but then to show more risky or exploratory behaviors, as compared to animals of the two other subgroups (Figure 8).
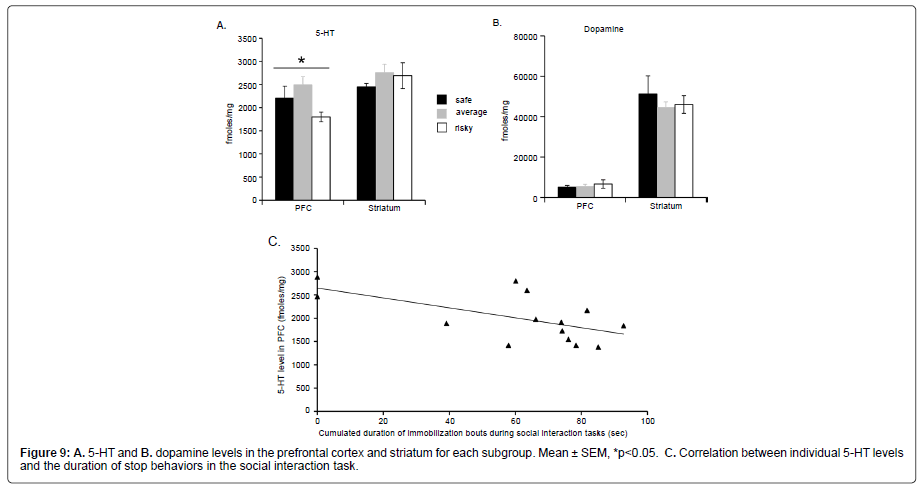
Brain monoamines: Our data showed that animals with “risky” MGT preference had significantly lower 5–HT level in the PFC than animals of the two other subgroups (Kruskall Wallis: H=6.295; p=0.0430) whereas all subgroups had similar 5–HT levels in the striatum (Kruskall Wallis: H=1.216, p=0.54445, Figure 9A). Dopamine levels (Figure 9B) were also similar in all subgroups in the PFC (Kruskall Wallis: H=0.155, p=0.9254) and in the striatum (Kruskall Wallis: H=0.229, p=0.6203).
Figure 8::A. Repartition of all animals around the median (n=26) for the percentage of time spent in the light box during the light/dark task. The circle shows the repartition of animals belonging to the ��?risky� subgroup. B. For each sub-group the percentage of animals above the median was represented for all anxiety parameters during the light/dark and emergence tasks.
In addition, we observed a significant and negative correlation between the level of 5–HT level in the PFC and the duration of stop behaviors during the last 4 min of the social interaction task (Figure 9C; Z=–2.299, p=0.0215).
In conclusion, mice with “risky” MGT preference exhibited lower 5–HT levels in the PFC than mice of the two other subgroups. Moreover, individual prefrontal 5–HT levels were negatively correlated with the time spent in stop behaviors during the social interaction task (R=–0.60, Z=–2.3, p=0.02).
Discussion
The data reported in the current paper shows that in a gambling task with conflicting options mice progressively favour advantageous choices to disadvantageous ones. Advantageous choices coupled high probabilities of getting small appetitive rewards with low probabilities to get aversive rewards (safe options). By contrast, disadvantageous choice coupled small probabilities to get large rewards with high probabilities to get aversive rewards (risky options). As a group, mice can thus develop a clear preference for choices that maximize their benefits in the long term, even though making such choices discard putatively large immediate outcomes.
We also revealed inter–individual differences within a group of healthy C57BL/6J mice in the Mouse Gambling Task (MGT). Indeed, approximately 27% of the mice gambled for food and persisted in trying risky options, while others progressively discarded risky options and chose safer ones (27%). We also show here that using delays as penalties was not successful in mice in our conditioning paradigms.
These latter results were surprising for two reasons: first, it was shown that for rats, long delays constituted efficient penalties. Indeed, Rivalan et al. [15,20] showed that rats generally avoid important immediate gratification associated with a long time–out in order to maximize their gain in the long term. Second, other authors successfully used delays as penalties in a mouse gambling task [18,21,22]. However, the procedure
used in these latter works required mice to learn response–outcome contingencies beforehand. Furthermore, no reward was delivered at the same time as a penalty. These two important differences in the paradigm may explain the difference with our current results. It is noticeable that in the human IGT there was no prior learning of response–outcome contingencies. We previously showed that mice avoid choices leading to long delays in a delay–reward procedure [28], suggesting that mice, like rats, can be sensitive to delay and generally prefer avoiding it. The difference between the MGT and the delay reward task is that in the latter, long delays and large rewards are always associated (the probability of having to wait before a gratification is 100% and is known beforehand by the animals). So in the delay reward task mice learn a fixe contingency between the response and the outcome. In the MGT, by contrast, this contingency has a certain probability to occur, making the choices at the same time potentially risky but attractive. It seems that for mice delays which were previously associated with a large reward are not aversive enough to overcome a putative high reward. Moreover, in these previous works [18,21,22], also, delay penalties were much shorter than the ones we used. Therefore an alternative, but not exclusive hypothesis is that mice in our tests used long delays to explore their environment and therefore may not consider a delay as aversive as rats do. This would be consistent with previous results comparing rats and mice strategies showing that mice get more distracted than rats, even in a familiar environment [29]. In order to test other modality of penalties, we tried an aversive sound (unpublished results), and found that as mice get used to it quite rapidly, it couldn’t be used successfully. Different reward medium, such as food pellets (unpublished results) also showed no effect.
These multiple attempts led us to use the MGT protocol conducted in a maze developed by Van Den Bos et al. [16]. In this task, the probability of getting quinine pellets instead of appetitive ones was used as penalty. Our experiment replicated and extended the results reported by these authors. Indeed, we show here that mice were able to progressively choose more often safer options, like it has been reported previously [16,21,22].
We extent their findings by showing here that, after forty trials, interindividuals differences emerged, statistically evidenced by the k–mean clustering method [23]. To that regard, we show strong similarity between humans, rats and mice. Indeed, if healthy mice globally favour safer options (this is the case for both “safe” and “average” subgroups), a quarter of them showed steady preference for more risky options that, in the long term, led to lower gain (“risky” subgroup). This proportion of mice with risky choices was in the same range to that observed in healthy humans [5,6,11] and rats [15,20]. Our results open an interesting development with the finding that among a healthy group there is interindividual differences that allow its subdivision in different subgroups, like what is classically observed in humans [5,6,11], macaques [30] and rats [15,20,31,32].
We excluded that the behavioural differences observed in the MGT were due to gross differences in locomotor activity, exploratory tendencies, habituation or neophobia. However, we confirmed that the behaviour of the “risky” subgroup in the MGT is well related to other risky behaviours, both shown in the light/dark anxiety task and in the emergence test when they were compared to the two other subgroups (“average” and “safe”). These results are in accordance with those reported in IGT performed in humans [3,5,6] and in RGT performed in rats [15,20]. Therefore, mice with risky performance during the MGT share similar behavioural traits with those of other species. It must be noticed, however, that there are still some features of the MGT that may be improved in order to match more closely the human version, notably the systematic wins following any choice, and the number of different options (4 distinct ones in the IGT vs. 2 in the MGT).
In addition to the behavioral traits, we observed that the 3 MGT subgroups differed for their level of 5–HT in the PFC, whereas the level of dopamine was similar in the three subgroups, both in the PFC and the striatum. The lower 5–HT level in the PFC of the “risky” subgroup compared to the two other subgroups (“safe” and “average”) is reminiscent of previous data showing that rats with a high level of impulsive choices had a lower 5–HT level and metabolism in the medial prefrontal cortex compared to non impulsive rats [33,34]. They are also consistent with others studies conducted either in rats, macaques, or humans, which have linked choices in the gambling task with the level of 5–HT. For example, it has been shown that knockout rats for SERT (Serotonin Transporter) homozygous or heterozygous, having a higher level of extracellular 5–HT, were more likely to choose advantageous options on the long term in the RGT [35] while rats with previous administration of the 8–OH–DPAT, agonist of the 5–HT receptors, had lower performance in the RGT [18]. Humans carrying the short allele of the serotonin transporter linked polymorphic region, that is healthy humans with constitutive lower level of 5–HT, choose more disadvantageous options in the IGT [35]. These results are therefore in agreement with what we observed here, showing that mice with “risky” choices in the MGT had lower prefrontal 5–HT levels than mice that favor more advantageous options [36]. However, these results do not preclude changes in other neurotransmitters and this should be the focus of further studies.
We additionally observed that there was a significant and negative correlation between the prefrontal level of 5–HT and the duration of “stop” during the social interaction task. Longer periods of stop behaviors have been previously shown to favor exploratory behavior by allowing head scanning movements, rearings and information processing [25] and to favor decision–making [24]. It is therefore interesting to observe that mice with a “risky” MGT profile make longer stops in a social decision–making task and have lower prefrontal 5–HT levels, suggesting that these mice favor exploration of possible outcomes, both in social and MGT contexts. By contrast, mice with a “safe” MGT profile make shorter stops in the social task and show higher prefrontal 5–HT levels, suggesting that they tend to favor lower exploration of possible outcomes but concentrate on safer ones.
In conclusion, we show that there is a good validity of the MGT as it provides an interesting way to study decision–making processes in mice, with the possibility of distinguishing individual differences. As we have access to multiple mice models for endophenotypes of different neurodegenerative or psychiatric disorders, this work opens the ways to the identification of the molecular and cellular bases of phenotypic traits related with poor decision–making, either in the healthy or unhealthy population.
References
- Doya K (2008) Modulators of decision making. Nat Neurosci 11: 410-416.
- de Visser L, Homberg JR, Mitsogiannis M, Zeeb FD, Rivalan M, et al. (2011) Rodent versions of the iowa gambling task: opportunities and challenges for the understanding of decision-making. Front Neurosci 5: 109.
- Bechara A, Damasio AR, Damasio H, Anderson SW (1994) Insensitivity to future consequences following damage to human prefrontal cortex. Cognition 50: 7-15.
- Granon S and Floresco S (2009) Functional neuroanatomy of flexible behaviors in mice and rats. Endophenotypes of psychiatric and neurodegenerative disorders in rodents models 83-103.
- Bechara A, Dolan S, Denburg N, Hindes A, Anderson SW, et al. (2001) Decision-making deficits, linked to a dysfunctional ventromedial prefrontal cortex, revealed in alcohol and stimulant abusers. Neuropsychologia 39: 376-389.
- Bechara A, Dolan S, Hindes A (2002) Decision-making and addiction (part II): myopia for the future or hypersensitivity to reward? Neuropsychologia 40: 1690-1705.
- Kim YT, Sohn H, Kim S, Oh J, Peterson BS, et al. (2012) Disturbances of motivational balance in chronic schizophrenia during decision-making tasks. Psychiatry Clin Neurosci 66: 573-581.
- Shurman B, Horan WP, Nuechterlein KH (2005) Schizophrenia patients demonstrate a distinctive pattern of decision-making impairment on the Iowa Gambling Task. Schizophr Res 72: 215-224.
- Cavedini P, Bassi T, Ubbiali A, Casolari A, Giordani S, et al. (2004) Neuropsychological investigation of decision-making in anorexia nervosa. Psychiatry Res 127: 259-266.
- Toplak ME, Jain U, Tannock R (2005) Executive and motivational processes in adolescents with Attention-Deficit-Hyperactivity Disorder (ADHD). Behav Brain Funct 1: 8.
- van den Bos R, Homberg J, de Visser L (2013) A critical review of sex differences in decision-making tasks: focus on the Iowa Gambling Task. Behav Brain Res 238: 95-108.
- de Visser L, van der Knaap LJ, van de Loo AJ, van der Weerd CM, Ohl F, et al. (2010) Trait anxiety affects decision-making differently in healthy men and women: towards gender-specific endophenotypes of anxiety. Neuropsychologia 48: 1598-1606.
- Rivalan M, Blondeau C, Dellu-Hagedorn F (2009) Modeling symptoms of mental disorders using a dimensional approach in the rat. In: Endophenotypes of psychiatric and neurodegenerative disorders in animal models, pp. 15-40. Research Signpost Editions, Kerala, India.
- Kessler RC, Hwang I, LaBrie R, Petukhova M, Sampson NA, et al. (2008) DSM-IV pathological gambling in the National Comorbidity Survey Replication. Psychol Med 38: 1351-1360.
- Rivalan M, Ahmed SH, Dellu-Hagedorn F (2009) Risk-prone individuals prefer the wrong options on a rat version of the Iowa Gambling Task. Biol Psychiatry 66: 743-749.
- van den Bos R, Lasthuis W, den Heijer E, van der Harst J, Spruijt B (2006) Toward a rodent model of the Iowa gambling task. Behav Res Methods 38: 470-478.
- Pais-Vieira M, Lima D, Galhardo V (2007) Orbitofrontal cortex lesions disrupt risk assessment in a novel serial decision-making task for rats. Neuroscience 145: 225-231.
- Zeeb FD, Robbins TW, Winstanley CA (2009) Serotonergic and dopaminergic modulation of gambling behavior as assessed using a novel rat gambling task. Neuropsychopharmacology 34: 2329-2343.
- de Visser L, Baars AM, van 't Klooster J, van den Bos R (2011) Transient inactivation of the medial prefrontal cortex affects both anxiety and decision-making in male wistar rats. Front Neurosci 5: 102.
- Rivalan M, Coutureau E, Fitoussi A, Dellu-Hagedorn F (2011) Inter-individual decision-making differences in the effects of cingulate, orbitofrontal, and prelimbic cortex lesions in a rat gambling task. Front Behav Neurosci 5: 22.
- Young JW, van Enkhuizen J, Winstanley CA, Geyer MA (2011) Increased risk-taking behavior in dopamine transporter knockdown mice: further support for a mouse model of mania. J Psychopharmacol 25: 934-943.
- van Enkhuizen J, Geyer MA, Young JW (2013) Differential effects of dopamine transporter inhibitors in the rodent Iowa gambling task: relevance to mania. Psychopharmacology (Berl) 225: 661-674.
- Timmerman ME, Ceulemans E, De Roover K, Van Leeuwen K (2013) Subspace K-means clustering. Behav Res Methods .
- de Chaumont F, Coura RD, Serreau P, Cressant A, Chabout J, et al. (2012) Computerized video analysis of social interactions in mice. Nat Methods 9: 410-417.
- Maubourguet N, Lesne A, Changeux JP, Maskos U, Faure P (2008) Behavioral sequence analysis reveals a novel role for beta2* nicotinic receptors in exploration. PLoS Comput Biol 4: e1000229.
- Kema IP, Schellings AM, Hoppenbrouwers CJ, Rutgers HM, de Vries EG, et al. (1993) High performance liquid chromatographic profiling of tryptophan and related indoles in body fluids and tissues of carcinoid patients. Clin Chim Acta 221: 143-158.
- Gamache P, Ryan E, Svendsen C, Murayama K, Acworth IN (1993) Simultaneous measurement of monoamines, metabolites and amino acids in brain tissue and microdialysis perfusates. J Chromatogr 614: 213-220.
- Serreau P, Chabout J, Suarez SV, Naudé J, Granon S (2011) Beta2-containing neuronal nicotinic receptors as major actors in the flexible choice between conflicting motivations. Behav Brain Res 225: 151-159.
- Cressant A, Besson M, Suarez S, Cormier A, Granon S (2007) Spatial learning in Long-Evans Hooded rats and C57BL/6J mice: different strategies for different performance. Behav Brain Res 177: 22-29.
- Long AB, Kuhn CM, Platt ML (2009) Serotonin shapes risky decision making in monkeys. Soc Cogn Affect Neurosci 4: 346-356.
- Blondeau C, Dellu-Hagedorn F (2007) Dimensional analysis of ADHD subtypes in rats. Biol Psychiatry 61: 1340-1350.
- Grégoire S, Rivalan M, Le Moine C, Dellu-Hagedorn F (2012) The synergy of working memory and inhibitory control: behavioral, pharmacological and neural functional evidences. Neurobiol Learn Mem 97: 202-212.
- Dalley JW, Theobald DE, Eagle DM, Passetti F, Robbins TW (2002) Deficits in impulse control associated with tonically-elevated serotonergic function in rat prefrontal cortex. Neuropsychopharmacology 26: 716-728.
- Barbelivien A, Billy E, Lazarus C, Kelche C, Majchrzak M (2008) Rats with different profiles of impulsive choice behavior exhibit differences in responses to caffeine and d-amphetamine and in medial prefrontal cortex 5-HT utilization. Behav Brain Res 187: 273-283.
- Homberg JR, van den Bos R, den Heijer E, Suer R, Cuppen E (2008) Serotonin transporter dosage modulates long-term decision-making in rat and human. Neuropharmacology 55: 80-84.
- Robbins TW, Arnsten AF (2009) The neuropsychopharmacology of fronto-executive function: monoaminergic modulation. Annu Rev Neurosci 32: 267-287.
Relevant Topics
- Addiction Recovery
- Alcohol Addiction Treatment
- Alcohol Rehabilitation
- Amphetamine Addiction
- Amphetamine-Related Disorders
- Cocaine Addiction
- Cocaine-Related Disorders
- Computer Addiction Research
- Drug Addiction Treatment
- Drug Rehabilitation
- Facts About Alcoholism
- Food Addiction Research
- Heroin Addiction Treatment
- Holistic Addiction Treatment
- Hospital-Addiction Syndrome
- Morphine Addiction
- Munchausen Syndrome
- Neonatal Abstinence Syndrome
- Nutritional Suitability
- Opioid-Related Disorders
- Relapse prevention
- Substance-Related Disorders
Recommended Journals
Article Tools
Article Usage
- Total views: 16148
- [From(publication date):
specialissue-2013 - Nov 27, 2025] - Breakdown by view type
- HTML page views : 11393
- PDF downloads : 4755

