Research Article Open Access
Measuring Light Attenuation in Shallow Coastal Systems
Ana C. Brito1*, Alice Newton2,3, Teresa F. Fernandes4, and Paul Tett5
1CO-FCUL, Centro de Oceanografia, Faculdade de Ciências da Universidade de Lisboa, Campo Grande 1749-016 Lisboa, Portugal
2IMAR- FCT Gambelas, University of Algarve, 8005-139 Faro, Portugal
3NILU-CEE, Box 100, 2027 Kjeller, Norway
4School of Life Sciences, Heriot-Watt University, Edinburgh EH14 4AS, UK
5Scottish Association for Marine Science (SAMS), Oban, Argyll PA37 1QA, UK
- *Corresponding Author:
- Ana C. Brito
CO-FCUL, Oceanography Centre
Faculty of Science, University of Lisbon
Campo Grande 1749-016 Lisbon, Portugal
Tel: 00351217500148
Fax: 00351217500009
E-mail: ana_brito@hotmail.com
Received date: November 23, 2012; Accepted date: January 10, 2013; Published date: January 14, 2013
Citation: Brito AC, Newton A, Fernandes TF, Tett P (2013) Measuring Light Attenuation in Shallow Coastal Systems. J Ecosys Ecograph 3: 122. doi:10.4172/2157-7625.1000122
Copyright: © 2013 Brito AC, et al. This is an open-access article distributed under the terms of the Creative Commons Attribution License, which permits unrestricted use, distribution, and reproduction in any medium, provided the original author and and source are credited.
Visit for more related articles at Journal of Ecosystem & Ecography
Abstract
Photosynthetic Active Radiation (PAR) was measured using single planar and two-bulb spherical light sensors. The attenuation coefficient (Kd) was found to vary significantly during the year. The highest Kd values were obtained in the station with higher influence of currents and run-off. Our data suggested a reflection of 50% of light that reaches the bottom, which is associated with a decrease in the Kd value obtained with the spherical sensor of 0.15 m-1. This means that flat sensors may underestimate PAR and that spherical sensor may underestimate Kd. This is a critical issue given that knowledge on light attenuation is essential for modeling approaches and quality assessments.
Keywords
Light attenuation; Flat and spherical light sensors; Shallow coastal lagoons; Ria Formosa; Portugal
Introduction
Amongst other factors, light attenuation is limiting for primary production [1]. Generally, shallow systems have lighted bottoms and a rich benthic algal community, which may have a significant role in reducing the susceptibility to eutrophication [2]. Benthic algae take nutrients up from the water column and retain a very important part of the nutrient flux from the pore water to the water column [3,4]. This is key in the assessment of ecosystem function and health.
The Photosynthetic Active Radiation (PAR), which covers wavelengths from 400 to 700 nm, is the part of the solar irradiance used by the photosynthetic apparatus [5]. However, not all the photons in the water column will be enrolled in the photosynthesis process. Photons will either be absorbed, leading to a change in the energy state of atoms or molecules, or scattered in the environment, leading to a change of direction in their propagation [5]. The decrease of photons, vertically through the water column, i.e. light attenuation, can be expressed by the diffuse attenuation coefficient for downward irradiance (Kd) [6-8]. However, in shallow sites with clear bottoms, special attention has to be given to the upward and scalar irrandiance, as they are likely to be important. The vertical attenuation coefficients for the appropriate irradiance, Kd for downward irradiance, Ku for upward irrandiance and K0 for scalar irradiance, follow the Beer-Lambert Law, decreasing in an approximately exponential manner with depth [1].
Historically, the vertical attenuation coefficient for downward irradiance has been estimated through the measurement of Secchi depths. However, this method is not viable for shallow systems with clear waters, such as Ria Formosa lagoon. From the 1970’s onwards submersible sensors to measure photon flux density started to be used [9]. This allows the direct calculation of Kd following the Beer-Lambert Law.
Nevertheless, the type of sensor also needs to be considered carefully in shallow systems. Spherical sensors are able to receive photons not only downwards from the top, as the planar sensors, but also scattered photons from all sides (scalar irradiance) and reflected photons going upwards, from the seabed bottom (upward irradiance) [10]. Therefore, studies on light availability and attenuation carried out in shallow waters may result in a confusion of estimates because what is measured by the spherical sensor is not only the vertical attenuation coefficient for downward irradiance (Kd).
The objectives of this study were to investigate: 1) the effect of bottom reflection on the estimates of the vertical attenuation coefficient obtained in shallow clear waters; and 2) the temporal variation of Kd in the Ria Formosa lagoon.
Methodology
Study site and sampling
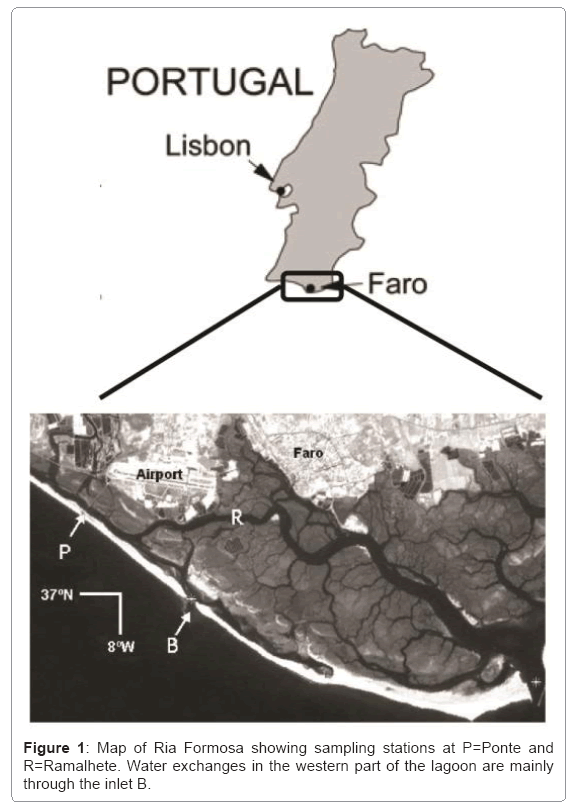
Ria Formosa is a shallow mesotidal lagoon which is cut-off from the normal coastal circulation (Figure 1). It is located in the south of Portugal, extending along the eastern part [10]. The mean depth of the lagoon is around 1.5 m and the mean residence time of waters is 2.4 days [11,12]. Measurements were taken at Ponte and Ramalhete (P and R in Figure 1) twice a month during 2007-08, using a single planar sensor (flat collector) and on the 13th and 14th of June 2007, using the two-bulb sensor (spherical collector), connected to a Seabird 19 conductivity, temperature, depth sensor (CTD).
Single planar light sensor
The single planar light sensor used was a Li-Cor (Li-192) Underwater Quantum sensor. The PAR diffuse attenuation coefficient for downward irradiance was calculated using the Beer-Lambert Law equation:
 (1)
(1)
Ed(z) is the PAR measurement at z depth, Ed(0) is the PAR measurement when the sensor is just under the water surface, kd is the PAR diffuse attenuation coefficient and z is the depth. In Ria Formosa, on every sampling date, PAR was measured just below the water surface and at 0.25 m depth at Ponte and Ramalhete.
Two-bulb light sensor
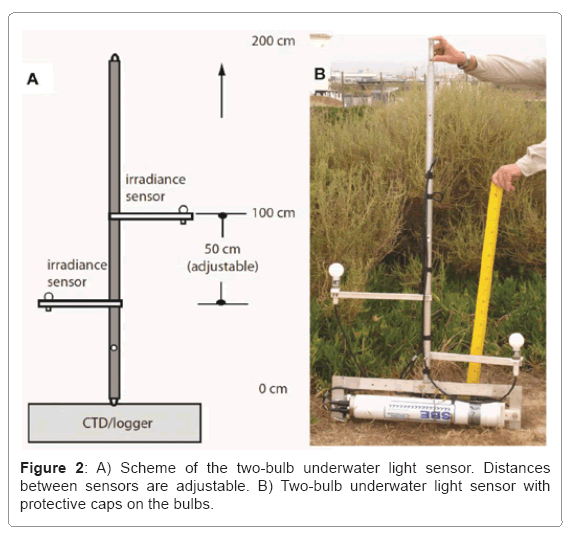
The two-bulb light sensor was constituted by two Li-Cor Underwater Spherical Quantum sensors and a coupled CTD positioned below (Figure 2). The sensor was developed in order to obtain concomitant measurements of the available PAR in the water column and to obtain vertical profiles of PAR measurements. This approach aimed at improving the previous method used to calculate Kd, by using profiles and instant PAR measurements at both depths, rather than isolated and non concomitant PAR values.
Numerical approach for the two-bulb sensor
Two numerical approaches were applied to the datasets from the two-bulb light sensors. One calculates the Kd for each optical depth using solely the instant PAR measurements recorded in each specific depth interval. The other goes further and performs a regression between the log (x) transformed measurements of PAR and depth within each optical depth. The coefficient of this relationship is the Kd value. This will be further explained below.
For the first approach, it is necessary to calculate, for a given profile, the instant coefficients for the down and the up casts, at a specific time. Thus
 (2)
(2)
PARbottom and PARtop are PAR measurements of the top (sensor 1) and bottom (sensor 2) sensors. P1P2ratio is a coefficient to correct for the different sensitivity of the sensors. Sensor 1 measures approximately 1.2 times more than sensor 2. Sp is the distance of separation between sensors. Measurements were taken by lowering the equipment, i.e. during the downcast, as well as during the upcast. A set of instant coefficients were obtained for each cast.
In the Ria Formosa, due to its shallowness, the profile was generally not divided into layers. If divided, the profile was separated in only two layers. The second approach consists of the calculation of the Kd for each depth interval as the slope of the regression line of the logtransformed PAR in that given depth interval.
At the end of the analysis of a given profile, two estimates of Kd are obtained using the second approach (regression), one for the down cast and another for the up cast. In addition, two estimates of Kd from instant measurements are also obtained from the down and up cast. The mean of the coefficients obtained from each approach was then calculated.
Statistical analysis
Statistical tests were carried out using Minitab 14 software. Data were tested for normality and homoscedasticity of variance and parametric tests conducted, when possible. Otherwise, the correspondent nonparametric tests were performed.
Results
A total of 36 point measurements (single planar light sensor; twice a month from March 2007 to February 2008) and 17 profiles (two-bulb light sensor; several profiles on two days) were obtained at the two stations of Ria Formosa, Ponte and Ramalhete.
Single planar light sensor
During the period from March 2007 to February 2008, the values of the Kd coefficient varied from 0.25 to 1.10 at Ramalhete and from 0.68 to 1.28 at Ponte (Table 1). Mean Kd values found were 0.69 at Ramalhete and 0.93 at Ponte. Positive Pearson’s correlations were found between values of Ponte and Ramalhete (p < 0.005). In addition, a linear regression analysis was performed between the Kd coefficient and chlorophyll concentrations (data not shown) and no significant relationship was found.
| Ria Formosa | Single planar light sensor–2007/2008 | mean | ||||||||||||
|---|---|---|---|---|---|---|---|---|---|---|---|---|---|---|
| Kd (m-1) | Ram | 0.25 | 0.79 | 0.59 | 0.57 | 0.53 | - | 0.90 | 0.59 | 1.10 | - | 0.66 | 0.90 | 0.69 |
| Ponte | 0.68 | 0.96 | 0.93 | 0.77 | 1.28 | - | 1.27 | 1.10 | 1.3 | 0.96 | 1.17 | 0.75 | 0.93 | |
| M | A | M | J | J | A | S | O | N | D | J | F | |||
Table 1: Mean values of the diffuse attenuation coefficient (m-1) measured at Ponte and Ramalhete (Ria Formosa) from March 2007 to February 2008 with the single planar light sensor.
Two-bulb light sensor
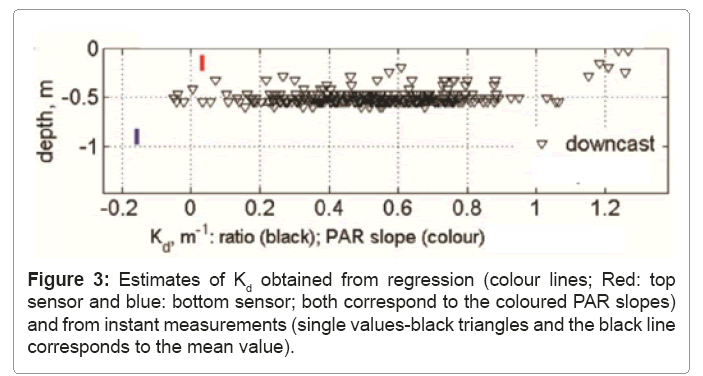
In Ria Formosa, it was not possible to determine the diffuse attenuation coefficient for downward irradiance using the regression method. Due to the shallowness of the lagoon, there were insufficient measurements made through the water column to conduct an accurate regression. In most cases, the maximum depth was approximately 1 meter and sensors were 0.75 m apart, which left an insufficient depth of less than 0.25 m to derive a profile. Estimates of Kd obtained from the regression method (coloured vertical lines) and from the calculation of the instant Kd values (black triangles), obtained from profile 1 at Ponte are represented in Figure 3. Negative values of Kd were obtained using the regression method. This is presented to show that the regression method is not viable at these sites. Table 2 comprises the Kd mean values obtained at Ponte and Ramalhete using solely the instant measurements. The mean Kd values obtained were 0.55 and 0.57 at Ponte and at Ramalhete, respectively. Profiles 1 to 6 at Ponte were done during the flood and high water periods, as represented by the maximum water depths. Profiles 7 to 9 at Ponte were recorded during the ebb period. Profile 10 at Ponte was recorded during the flood period again. Profiles 11 and 12 at Ponte were recorded during the high water period on the following day. Profiles 1 to 5 at Ramalhete were collected during low water and flood periods. No significant differences were found between Kd values obtained at Ponte and at Ramalhete (p > 0.05; Mann-Whitney).
| Profile | Maximum water depth | Mean Kd | Method | |
|---|---|---|---|---|
| Ria Formosa | Ponte 1 | 0.97 | 0.60 | Instant |
| Ponte 2 | 1.09 | 0.70 | ‘’ | |
| Ponte 3 | 1.80 | 0.72 | ‘’ | |
| Ponte 4 | 2.24 | 0.55 | ‘’ | |
| Ponte 5 | 2.34 | 0.48 | ‘’ | |
| Ponte 6 | 2.86 | 0.34 | ‘’ | |
| Ponte 7 | 2.66 | 0.37 | ‘’ | |
| Ponte 8 | 2.11 | 0.40 | ‘’ | |
| Ponte 9 | 1.58 | 0.63 | ‘’ | |
| Ponte 10 | 2.43 | 0.63 | ‘’ | |
| Ponte 11 | 3.00 | 0.55 | ‘’ | |
| Ponte 12 | 3.02 | 0.57 | ‘’ | |
| 0.55 | ||||
| Ram 1 | 0.21 | 0.75 | ‘’ | |
| Ram 2 | 0.14 | 0.96 | ‘’ | |
| Ram 3 | 0.19 | 0.42 | ‘’ | |
| Ram 4 | 0.17 | 0.36 | ‘’ | |
| Ram 5 | 0.13 | 0.38 | ‘’ | |
| 0.57 |
Table 2: Maximum water depths and mean Kd of each profile at Ponte and Ramalhete.
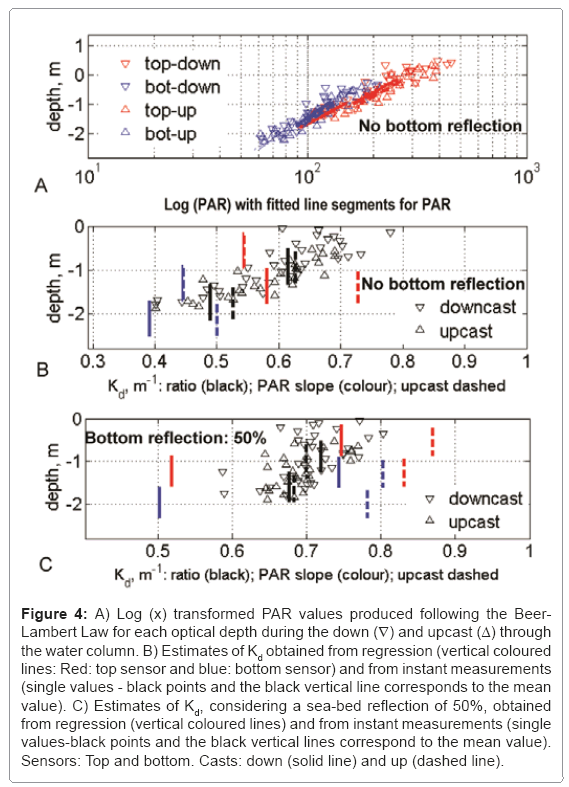
Due to its morphology, the spherical sensor is able to measure the irradiance that is reflected by the seabed. The spherical light sensor responds to upwards as well as downwards light. Therefore, it considers data that should be used for the estimation of K0, the coefficient of scalar irradiance. If the spherical sensor is used for the assessment of Kd, it may underestimate the coefficient, if the sensor is lowered towards a reflecting seabed. The importance of the sea-bed reflection in shallow systems should be evaluated. Artificial data for PAR measurements in the bottom and top sensor were therefore produced, according to the Beer-Lambert Law described previously (Equation 1). These data were produced using different values of Kd from 0.5 to 1, which is a range that consideres the majority of values found with the planar sensor during 2007-2008 (Figure 4A and 4B). The sea-bed reflection term was then introduced in the Beer-Lambert Law equation as being 0.5, which represents a reflection of 50% of light that reaches the bottom. This value was considered as reasonable by the observation of the clear sea bottom. The artificial dataset was produced once again (Figure 4C). The result was an increase of 0.15 in the Kd estimate, which was 0.7 m-1 instead of the 0.55 m-1 found without considering the bottom reflection (Figure 4B).
Figure 4: A) Log (x) transformed PAR values produced following the Beer- Lambert Law for each optical depth during the down (∇) and upcast (Δ) through the water column. B) Estimates of Kd obtained from regression (vertical coloured lines: Red: top sensor and blue: bottom sensor) and from instant measurements (single values - black points and the black vertical line corresponds to the mean value). C) Estimates of Kd, considering a sea-bed reflection of 50%, obtained from regression (vertical coloured lines) and from instant measurements (single values-black points and the black vertical lines correspond to the mean value). Sensors: Top and bottom. Casts: down (solid line) and up (dashed line).
Discussion
In Ria Formosa, higher mean Kd values were observed in Ponte rather than Ramalhete. This might express the higher influence of currents, resuspension of sediments and run-off at this site, which is a main channel, compared with Ramalhete, which is an inner channel [13]. Profiles recorded at Ponte and Ramalhete clearly express differences of light attenuation between low and high water. This shallow region is expected to have higher concentrations of suspended particles due to the run-off and re-suspension of sediments than the open ocean [14]. Therefore, a decrease in light attenuation is expected during the flood and high water periods [6,8]
One of the most striking findings is the relevance of bottom reflection in shallow systems such as Ria Formosa. This reveals the importance of the type of sensor used in systems such as this coastal lagoon (spherical vs planar sensor).
The increase of 0.15 in the vertical attenuation coefficient when considering the bottom reflection was very interesting. After applying the correction factor, the coefficient would be 0.7 m-1 in Ponte, which was the same number as obtained with the flat sensor for the same period. The shallowness of the system means that a significant part of the incident light will reach the bottom and be reflected [15]. Bottom reflection is therefore an important phenomenon that should be taken into account when studying shallow waters. Reflected light will be available again for phytoplankton and turns the water clearer. The twobulb light sensor was spherical and because of that it would also record the reflected light by the sea-bed. In this way, the spherical sensor was also measuring the scalar irradiance and should also be used for the estimation of the scalar coefficient (K0) and not solely the Kd. When the upwelling irradiance is very small, K0 may be approximated to Kd. However, in this case, the bottom reflection is very important. The influence of the reflected light on the flat sensor (single planar light sensor) should be smaller because the sensor was only recording light reaching from above.
The fact that these sensors are measuring different types of irradiance should explain the observed differences between the ‘Kd’ values obtained with the flat and spherical sensors. In fact, our spherical light sensor could provide more accurate measurements of the available irradiance for photosynthesis in the shallow waters of Ria Formosa. The flat sensor will always provide an underestimation of these values. Furthermore, the use of two sensors collecting PAR measurements at the same time is always more reliable than using only one sensor. Nevertheless, if the main aim of an investigation is to study the light attenuation due to particle concentration using spherical collectors, a correction for bottom reflection should be applied, or the flat collector should be considered.
Acknowledgements
Ana Brito was funded by a Portuguese PhD grant from FCT (POCI 2010 BD/21525/2005), an initial studentship (from October to December 2005) from Edinburgh Napier University and a Portuguese Post-doc grant from FCT (BPD/63017/2009). This study was also supported by the Fundação para a Ciência e a Tecnologia (FCT) (PEst-OE/MAR/UI0199/2011).
References
- Kirk JTO (1994) Light and Photosynthesis in Aquatic Ecosystems, (2ndedn). Cambridge University Press :528.
- Brito A, Newton A, Tett P, Fernandes TF (2011) How will shallow coastal lagoons respond to Climate Change? A modelling investigation. Estuarine, Coastal and Shelf Science 112: 98-104.
- Lloret J, Marín A, Marín-Guirao L (2008) Is coastal lagoon eutrophication likely to be aggravated by global climate change? Estuarine, Coastal and Shelf Science 78: 403-412.
- Brito AC, Newton A, Tett P, Icely J, Fernandes T (2010) The yield of microphytobenthic chlorophyll from nutrients: enriched experiments in microcosms. Journal of Experimental Marine Biology and Ecology 384: 30-43.
- Falkowski PG, Raven JA (2007) Aquatic Photosynthesis, (2ndedn). Princeton University Press: 484.
- Lund-Hansen LC (2004) Diffuse attenuation coefficients Kd(PAR) at the estuarine North Sea–Baltic Sea transition: time-series, partitioning, absorption, and scattering. Estuarine, Coastal and Shelf Science 61: 251-259.
- Painting SJ, Devlin MJ, Malcolm SJ, Parker ER, Mills DK, et al. (2007) Assessing the impact of nutrient enrichment in estuaries: susceptibility to eutrophication. Marine Pollution Bulletin 55: 74-90.
- Devlin MJ, Barry J, Mills DK, Gowen RJ, Foden J, et al. (2008) Relationships between suspended particulate material, light attenuation and Secchi depth in UK marine waters. Estuarine, Coastal and Shelf Science 79: 429-439.
- Gallegos CL, Werdell PJ, McClain CR (2011) Long-term changes in light scattering in Chesapeake Bay inferred from Secchi depth, light attenuation, and remote sensing measurements. Journal of Geophysical Research: Oceans 116.
- Newton A, Mudge SM (2003) Temperature and Salinity regimes in a shallow, mesotidal lagoon, the Ria Formosa, Portugal. Estuarine Coastal and Shelf Science 57: 73-85.
- Tett P, Gilpin L, Svendsen H, Erlandsson CP, Larsson U, et al. (2003) Eutrophication and some European waters of restricted exchange. Continental Shelf Research 23: 1635-1671.
- Mudge SM, Icely JD, Newton A (2008) Residence times in a hypersaline lagoon: using salinity as a tracer. Estuarine, Coastal and Shelf Science 77: 278-284.
- Brito A, Newton A, Tett P, Fernandes T (2010) Sediment and water nutrients and microalgae in a coastal shallow lagoon, Ria Formosa: Implications for the Water Framework Directive. J Environ Monit 12: 318-328.
- Obrador B, Pretus JL (2008) Light regime and components of turbidity in a Mediterranean coastal lagoon. Estuarine, Coastal and Shelf Science 77: 123-133.
- Ackleson SG (2003) Light in shallow waters: a brief research review. Limnology and Oceanography 48: 323-328.
Relevant Topics
- Aquatic Ecosystems
- Biodiversity
- Conservation Biology
- Coral Reef Ecology
- Distribution Aggregation
- Ecology and Migration of Animal
- Ecosystem Service
- Ecosystem-Level Measuring
- Endangered Species
- Environmental Tourism
- Forest Biome
- Lake Circulation
- Leaf Morphology
- Marine Conservation
- Marine Ecosystems
- Phytoplankton Abundance
- Population Dyanamics
- Semiarid Ecosystem Soil Properties
- Spatial Distribution
- Species Composition
- Species Rarity
- Sustainability Dynamics
- Sustainable Forest Management
- Tropical Aquaculture
- Tropical Ecosystems
Recommended Journals
Article Tools
Article Usage
- Total views: 18323
- [From(publication date):
March-2013 - Mar 31, 2025] - Breakdown by view type
- HTML page views : 13559
- PDF downloads : 4764


