Research Article Open Access
Macrobenthic Diversity in Black Sand Enrichment Area along the Coast between Poompukar to Nagoor, India
N. Chandrasekar, S. Saravanan*, V. Joevivek and M. SivaperumalCentre for Geotechnology, Manonmaniam Sundaranar University, Tirunelveli – 627 012, Tamil Nadu, India
- *Corresponding Author:
- S. Saravanan
Centre for Geotechnology
Manonmaniam Sundaranar University
Tirunelveli – 627 012
Tamil Nadu, India
Tel: +91 9994435416
E-mail: geosaravanan2000@yahoo.co.in
Received date July 11, 2012; Accepted date September 24, 2012; Published date September 28, 2012
Citation: Chandrasekar N, Saravanan S, Joevivek V, Sivaperumal M (2012) Macrobenthic Diversity in Black Sand Enrichment Area along the Coast between Poompukar to Nagoor, India. J Marine Sci Res Dev 2:111. doi:10.4172/2155-9910.1000111
Copyright: © 2012 Chandrasekar N, et al. This is an open-access article distributed under the terms of the Creative Commons Attribution License, which permits unrestricted use, distribution, and reproduction in any medium, provided the original author and source are credited.
Visit for more related articles at Journal of Marine Science: Research & Development
Abstract
The study of benthic organism is necessary to obtain a comprehensive idea of the fishery potential of any biotope. Benthic research in sedimentary estuarine environments began with an emphasis on descriptions of organism distributions and abundance. The present study area extends over distance of about 35 km and bound between Poompukar in the north and Nagore in the South India. The present study focuses on determining the spatial distribution and structure of the benthic assemblages, and to evaluate the species diversity along the study area, and finally whether there is any impact of black sand distribution on the benthic and pelagic community. A survey of benthic macrofauna at a total of 12 sampling stations from Poompukar to Nagoor was carried out between November 2004 to March 2005. Positions were fixed with a Trimble Global Positioning System (GPS). The sampling stations were chosen to quantify the benthos both within the black sand enrichment areas. The black sand enrichment area like Chandrapadi, Karaikal and Nagoor indicates that the colonisation of macrobenthic fauna is totally absent. This study is carried out on benthos in terms of impact of beach sand extraction and concluded that the white sand constituted more habitats than the black sand area. The sediment grain size particularly in coarse sand having non-black sand shows more interrelationship with macrobenthic faunal diversity which also clearly indicate the supply of organic matter source of food web to the species.
Keywords
Sediments; Intertidal area; Black sands; Benthic diversity; India
Introduction
Ocean covers 70% of the Earth’s surface and, in consequence, marine sediments represent the largest ecosystem in the world. In turn, benthic macrofauna usually constitutes the dominant biomass of the marine bottom system, and at the phylum level this group represents the most diverse assemblage on Earth [1]. Marine sediments cover most of the oceans bottom, and the organisms that reside in these sediments therefore constitute the largest faunal assemblage on Earth in areal coverage. The biomass in these sediments is dominated by macrofauna, a grouping of invertebrate polychaetes, molluscs, crustaceans and other phyla based on size. Globally, only a small portion of marine habitats have been sampled for macrofauna, but sampled areas have led to global estimates of macrofaunal species number ranging from 500,000 to 10,000,000. Most of these species are undescribed, and global syntheses of patterns of individual taxa and biodiversity are few and based on limited samples. The significance of biodiversity in marine sediments to ecosystem processes is poorly understood, but individual species and functional groups are known to carry out activities that have global importance. Macrofaunal activity impacts global carbon, nitrogen and sulphur cycling, transport, burial and metabolism of pollutants, secondary production including commercial species, and transport of sediments. Documented extinctions of marine macrofauna are few, but the ramifications of species loss through habitat shrinkage and undocumented extinctions are unknown. Limited data suggest there is substantial functional redundancy in macrofauna within trophic groups but whether this redundancy is sufficient to allow species loss without significantly altering ecosystem processes is unknown. Sorely needed are experiments that test specific hypotheses on biodiversity, redundancy and ecosystem processes as they relate to marine macrofauna.
Benthic research in sedimentary estuarine environments began with an emphasis on descriptions of organism distributions and abundance [2-7]. These efforts resulted in a crude map of infaunal assemblage types. This map is not complete even today but the data allow us to ask questions about pattern. As is typical of such efforts, the majorities of the techniques used to evaluate the existence of infaunal patterns are correlative and thus result in only weak inferences which do not necessarily expose the causal relationships. Such approaches dominated sedimentary benthic ecology until the 1960s and 1970s when investigators began to concentrate to a much larger extent on elucidating causal mechanisms. The original stimulus for this change has its origins in the work of Sanders and Rhoads and their collaborators who recognized the link between the activities of the infauna and the structure of the habitat. Additionally in the 1970s, several investigators with strong ties to rocky intertidal benthic ecology, where manipulative experiments have been enormously successful, began publishing their work which accelerated the move to address mechanisms through experimentation. During the 1980s and 1990s, the emphasis on explicit experiments has continued. In this contribution, we explore our current understanding of the processes that lead to patterns of distribution and abundance in marine sedimentary assemblages and our ability to ask testable questions concerning mechanism in this habitat in the black sand region. Biodiversity encompasses a range of different levels of organization from the genetic variation between individuals and populations, to species diversity, assemblages, habitats, landscapes and biogeographical provinces [8-10].
The study of benthic organism is necessary to obtain a comprehensive idea of the fishery potential of any biotope. The present study focuses on determining the spatial distribution and structure of the benthic assemblages, and to evaluate the species diversity along the study area, and finally study whether there is any impact of black sand distribution on the benthic and pelagic community.
Study Area
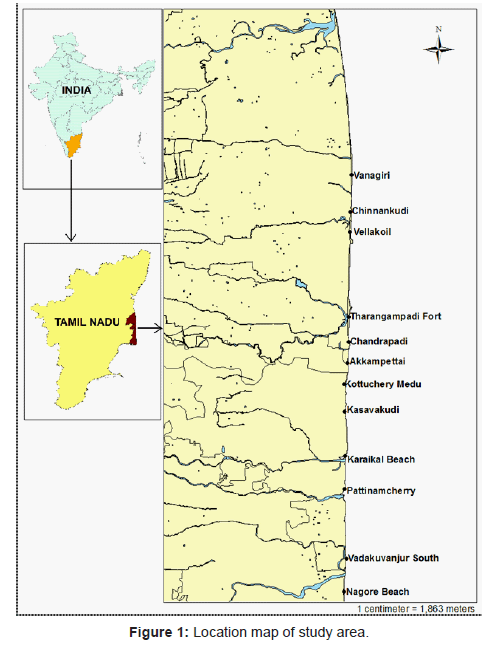
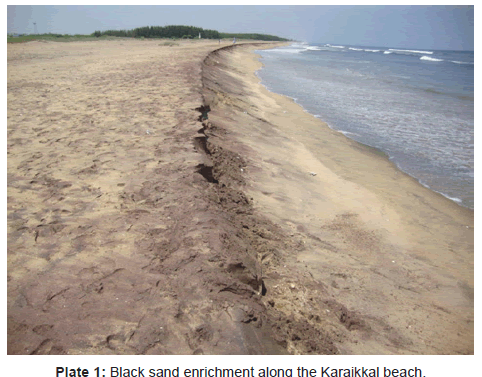
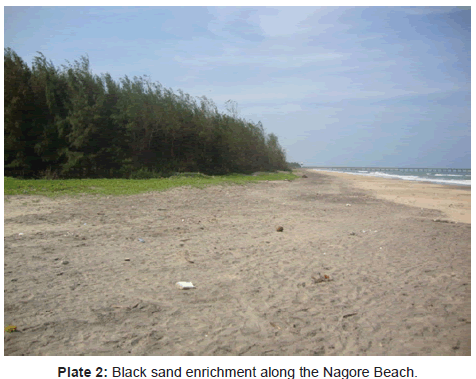
The present study area extends over distance of about 35 km and bound between Poompukar in the north and Nagore in the south. It falls in the survey of India toposheets (No.58M & 58N). The study area occupies the region between 11°07.703 to 10°48.807 N and 79°51.476 to 79°51.058 E covering the districts of Nagapattinam and Karaikkal (Union Territory of Pondicherry) as shown in the Figure 1. The coastal districts have excellent network of road and railway line connection. This area is traversed by a complex drainage pattern and open sea condition. Nevertheless the coast is being encountered by the Tsunami (December 26, 2004). Inspite of such characters, black sand accumulation is generally expected in the coast and the present study area has been chosen for macrofauna distribution in the black sand enrichment area (Plates 1 and 2).
The principle river in the study area is Cauvery and Coleroon, among which Cauvery is the most dominant river. It is only about 760 km long. It has a catchment of about 87900 sq.km and it drains through an area of 71680 sq.km. It takes its rise above the great Krishnarajasagar only 19.2 km east of Mysore city and flows through the hilly terrain with manifestation of thick forest in the Mysore plateau. The northern branch is known as Coleroon while the southern one is the Cauvery. From there onwards, it flows through the deltaic region, primarily of Tanjore district. After running to 12.8 km, it branches out into numerous small branches spread to about 120 km wide in the delta.
Geology and Geomorphology
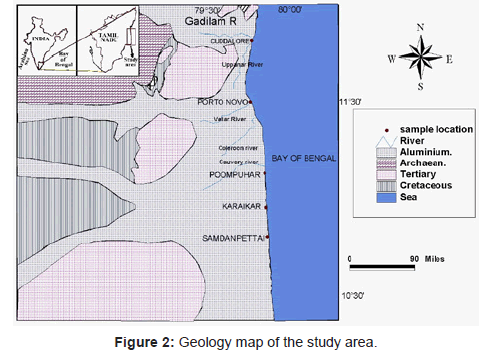
The coastal plain represents beaches, ridges, swales, dune complex, lagoons, estuaries and tidal flats. Strain plain is restricted to the closely spaced successive beach ridges which are suggestive of ancient shoreline boundary and are always fringing the delta front. It is comparatively a high relief plain with an elevation varying from 6 to 19 m above MSL and is noticed all along the coast but varying in width, increasing from north to south i.e., 3 km to 8 km. On the strand plains are strand flats and dunes. At places, the relief is broken by estuaries, lagoons and creeks. They can be seen both north and south of Nagapattinam. Cauvery delta’s eastward growth has been arrested by beach ridges of the strand plain, acting as barriers. Its ancient trend from Velanganni to Adirampattinam has been breached by a number of distributaries of the Pamainyar and the Vennar rivers which veered south eastwards consequent to sediment piling in the central and northern parts of the delta. The inland beach ridge is located about 32.5 km from coastline trending NE-SE direction. Later stages of beach ridges have changed their deposition to EW and NW directions. The beach ridge pattern has revealed that there is every possibility to believe that the ancient Cauvery River must have confluenced near Vedaranniyam through Tiruthuraipundi area. A series of sand dunes occurs parallel to the coast in places around Velanganni, Karaikal, Thirumullaivasal and Cuddalore. Within these dunes a set of old and recent or active dunes can be seen. Beach sediments comprise of mainly quartz along with feldspar and heavy minerals. The outcrops of the study area range in age from Late Jurassic to recent. However, older formations are located only around the western margin. The eastern parts are covered by alluvium and contain a relatively thicker and more complete sedimentary sequence. The area is well differentiated into depressions and ridges, formed owing to taphrogenic fragmentation and block faulting along the dominant basement trends during the onset of Late Jurassic (Figure 2).
In general stratigraphy, igneous and metamorphic rocks of Precambrian age form the basement. The sedimentary sequences in the outcrops and the subsurface are varied and range from Late Jurassic to recent. In general, the sediments are fairly rich in fossil faunal and palynological assemblages. Fossil fauna is more abundant in the Cenozoic sequence. Palynological assemblages are relatively more diagnostic in the Early Cretaceous sequence.
Methodology
Positions of the sampling stations
A survey of benthic macrofauna at a total of 12 sampling stations from Poompukar to Nagoor was carried out between November 2004 to March 2005 (Table 1). Positions were fixed with a Trimble Global Positioning System (GPS). The sampling stations were chosen to quantify the benthos both within the black sand enrichment areas. The distances between each transect is 1 km from Poompukar to Nagapatinam Coast. These sampling stations cover a potential economic zone of Black sand enrichment area.
| Station Number | ||||||||||||||
|---|---|---|---|---|---|---|---|---|---|---|---|---|---|---|
| Species | Species No | 1 | 2 | 3 | 4 | 5 | 6 | 7 | 8 | 9 | 10 | 11 | 12 | Total |
| Littorina | 1 | 1 | 1 | 1 | 1 | 0 | 0 | 1 | 1 | 0 | 1 | 1 | 0 | 8 |
| Pattela | 2 | 1 | 0 | 0 | 1 | 0 | 0 | 1 | 0 | 1 | 1 | 1 | 0 | 6 |
| Cerethidae | 3 | 3 | 2 | 2 | 1 | 2 | 2 | 1 | 3 | 1 | 2 | 0 | 3 | 22 |
| Nautica | 4 | 1 | 0 | 1 | 0 | 0 | 0 | 1 | 0 | 0 | 1 | 0 | 0 | 4 |
| Umbonium | 5 | 2 | 3 | 3 | 1 | 3 | 1 | 2 | 1 | 0 | 2 | 2 | 1 | 21 |
| Pecten | 6 | 0 | 0 | 1 | 0 | 0 | 1 | 0 | 0 | 1 | 0 | 0 | 0 | 3 |
| Arca | 7 | 0 | 1 | 0 | 1 | 0 | 1 | 0 | 0 | 1 | 0 | 1 | 0 | 5 |
| Donex | 8 | 1 | 0 | 1 | 1 | 0 | 0 | 1 | 1 | 0 | 0 | 1 | 0 | 6 |
| Bordiadipolar | 9 | 1 | 0 | 0 | 0 | 0 | 1 | 1 | 0 | 0 | 1 | 0 | 0 | 4 |
| Modulus | 10 | 0 | 1 | 0 | 0 | 0 | 1 | 0 | 0 | 0 | 1 | 0 | 0 | 3 |
| Nereis | 11 | 1 | 1 | 1 | 1 | 0 | 1 | 1 | 1 | 0 | 1 | 0 | 1 | 9 |
| Assicoda | 12 | 1 | 1 | 0 | 1 | 0 | 0 | 1 | 0 | 1 | 1 | 0 | 0 | 6 |
| Amphipods | 13 | 1 | 1 | 1 | 1 | 0 | 1 | 0 | 1 | 1 | 1 | 1 | 1 | 10 |
| Isopods | 14 | 1 | 0 | 1 | 1 | 0 | 0 | 0 | 1 | 0 | 1 | 1 | 0 | 6 |
| 14 | 11 | 12 | 10 | 5 | 9 | 10 | 9 | 6 | 13 | 8 | 6 | 113 | ||
Table 1: Name and Location of the Sampling Stations.
Transect quadrat method
The in situ quantitative analysis for intertidal fauna is done by this method which is recommended here as an easily adaptable method both with the view of collecting data and for analysis after pursuing through the other methods like Plots and Transects Method of Loya (1978), Random Sample Method of Bakus (1990) and Line Intercept Transact Method of English et al. (1997).
The presently recommended Transect Quadrat Method (TQM) is to cover 100 m along the shore and 50 m into the sea (littoral zone) which would cover a sector of littoral zone of an area of 5000 sq.m. The TQM sectors of 100 m wide of a critical habitat may be selected either at random if the ecosystem were to be uniform or as one sector of 100 m wide for each type of ecosystem, i.e., grass beds, coral reefs, rocky and sandy coast, etc., represented in the critical habitat. This decision of selecting the TQM sector should be based on a preliminary survey of the critical habitat.
Collection and extraction procedure
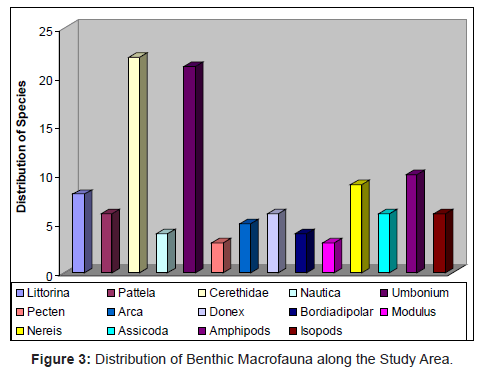
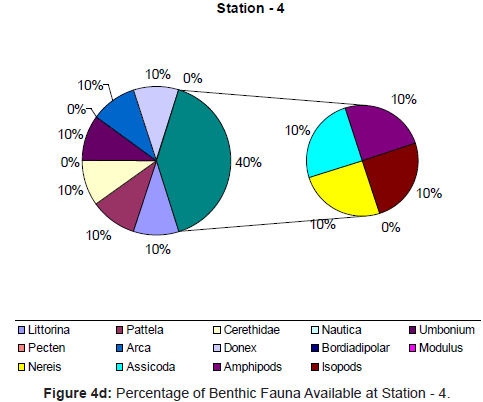
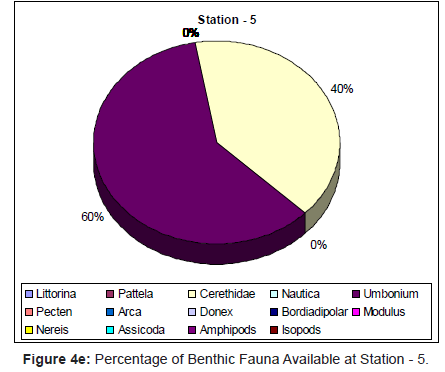
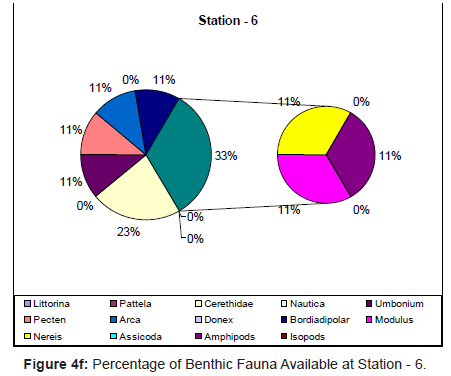
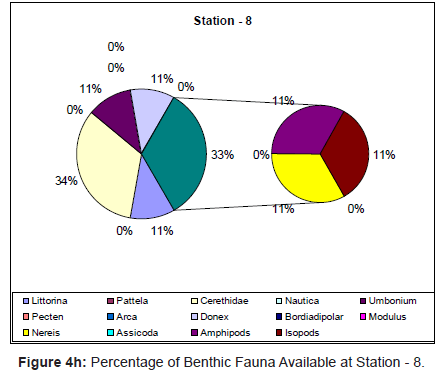
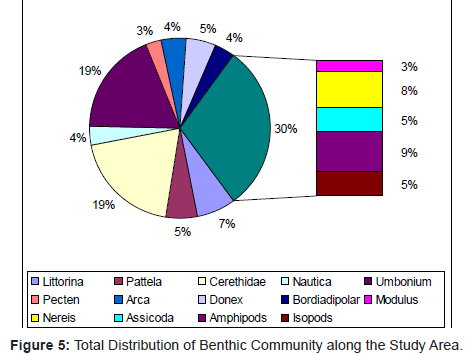
The separation of this macrofauna was carried out in the laboratory by elution with a large volume of tap water through a 0.5 mm mesh sieve and by careful manual separation of the residual fauna from the remaining sediment. The macrofauna was then preserved in 5% neutralized formalin for subsequent identification and enumeration. Total distribution of fauna species are shown in the Table 2 and Figures 3 and 5.
| Station Number | ||||||||||||||
|---|---|---|---|---|---|---|---|---|---|---|---|---|---|---|
| Species | Species No | 1 | 2 | 3 | 4 | 5 | 6 | 7 | 8 | 9 | 10 | 11 | 12 | Total |
| Littorina | 1 | 1 | 1 | 1 | 1 | 0 | 0 | 1 | 1 | 0 | 1 | 1 | 0 | 8 |
| Pattela | 2 | 1 | 0 | 0 | 1 | 0 | 0 | 1 | 0 | 1 | 1 | 1 | 0 | 6 |
| Cerethidae | 3 | 3 | 2 | 2 | 1 | 2 | 2 | 1 | 3 | 1 | 2 | 0 | 3 | 22 |
| Nautica | 4 | 1 | 0 | 1 | 0 | 0 | 0 | 1 | 0 | 0 | 1 | 0 | 0 | 4 |
| Umbonium | 5 | 2 | 3 | 3 | 1 | 3 | 1 | 2 | 1 | 0 | 2 | 2 | 1 | 21 |
| Pecten | 6 | 0 | 0 | 1 | 0 | 0 | 1 | 0 | 0 | 1 | 0 | 0 | 0 | 3 |
| Arca | 7 | 0 | 1 | 0 | 1 | 0 | 1 | 0 | 0 | 1 | 0 | 1 | 0 | 5 |
| Donex | 8 | 1 | 0 | 1 | 1 | 0 | 0 | 1 | 1 | 0 | 0 | 1 | 0 | 6 |
| Bordiadipolar | 9 | 1 | 0 | 0 | 0 | 0 | 1 | 1 | 0 | 0 | 1 | 0 | 0 | 4 |
| Modulus | 10 | 0 | 1 | 0 | 0 | 0 | 1 | 0 | 0 | 0 | 1 | 0 | 0 | 3 |
| Nereis | 11 | 1 | 1 | 1 | 1 | 0 | 1 | 1 | 1 | 0 | 1 | 0 | 1 | 9 |
| Assicoda | 12 | 1 | 1 | 0 | 1 | 0 | 0 | 1 | 0 | 1 | 1 | 0 | 0 | 6 |
| Amphipods | 13 | 1 | 1 | 1 | 1 | 0 | 1 | 0 | 1 | 1 | 1 | 1 | 1 | 10 |
| Isopods | 14 | 1 | 0 | 1 | 1 | 0 | 0 | 0 | 1 | 0 | 1 | 1 | 0 | 6 |
| 14 | 11 | 12 | 10 | 5 | 9 | 10 | 9 | 6 | 13 | 8 | 6 | 113 | ||
Table 2: Total distribution of species along the study area.
Particle size analysis
One factor that affects community composition of the macro benthos is sediment type [11,12]. In each station, 2 samples of sediment were taken for particle analysis. The material was sieved over the range. Result was expressed using conventional Wentworth classification to give percentage composition of each particle size. The result of analysis of sediment composition is reported separately.
Grain size analysis
The sediments along the beaches of study area mainly comprise of medium grained sands with clear light white colour. These sands are found to lack shell fragments and plant materials. The carbonate content values after acid treatment in the total sand was very negligible. On many occasions there is no effervescence on addition of dil. HCL. Similarly, on addition of H2O2 to the sandy sediments, one finds few bubbles which reflect the lack of plant material in the total sands.
The sandy sediments known in this area are termed as black sands. They have been reported to consist of garnet, zircon and iron oxides. These sands are also made up of light minerals which include mainly of quartz and feldspar. The grain size parameters of sediments are often used in interpreting the environments of the deposition of ancient as well as of recent sediments.
Results and Discussion
Macrofauna distribution
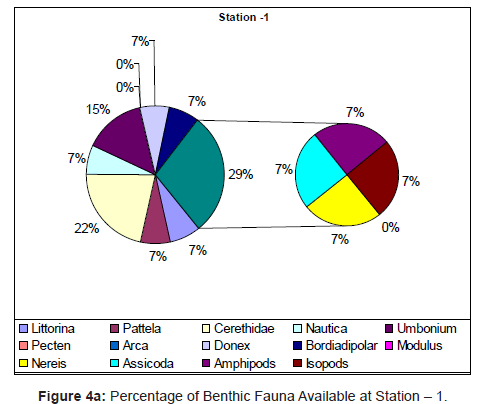
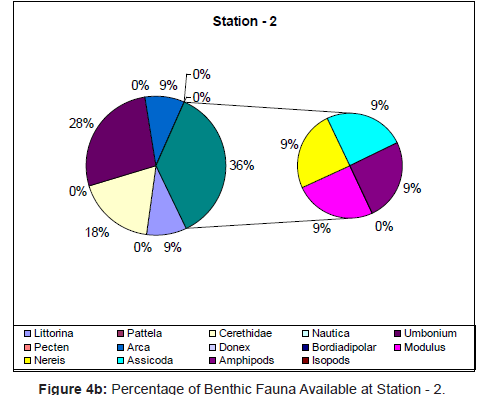
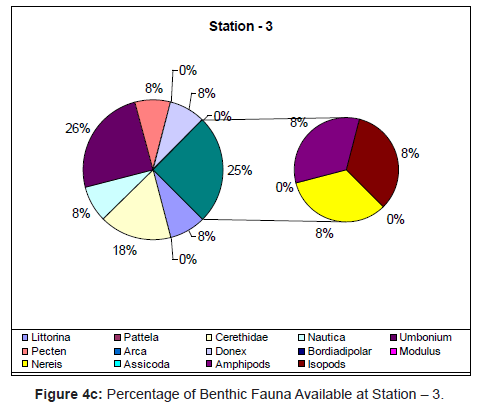
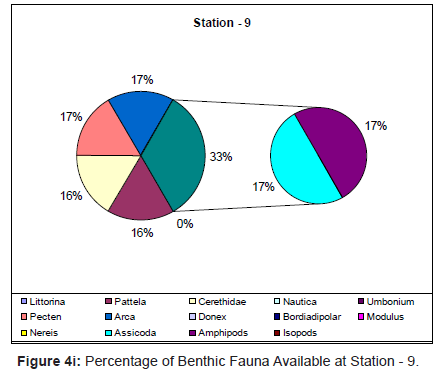
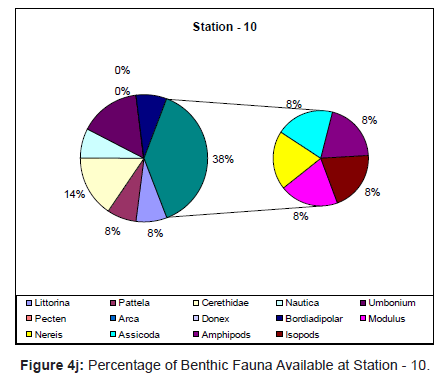
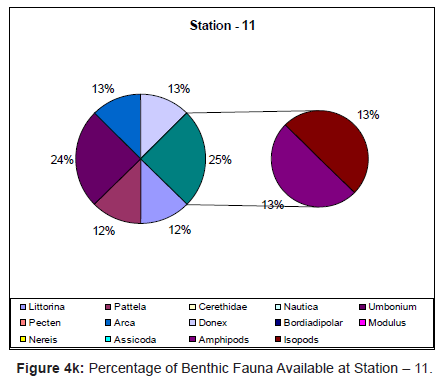
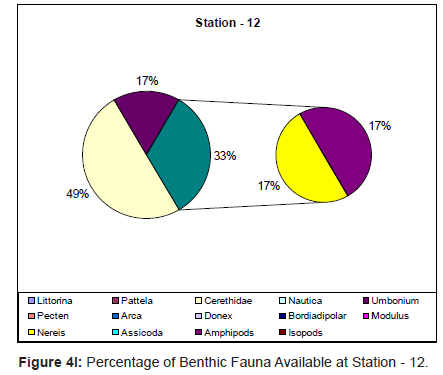
Table 2 provides the distribution of macrofauna for each station placed between Poombukar and Nagoor. The total number of species macrofauna recorded in the area was 14 in the black sand environment. The average number of species (Figure 4a to 4l) per station range between 5 to 14 which is dominated by Polycheates and Cerethidae. Cerithidae and Umbonium are dominated followed by decreasing contributionof Umbonium, Polycheates, Crustacea, Amphipods and Isopods. In general, in black sand regions, the distribution of macrofauna is very scarce whereas in the white sand region the macrobenthic fauna are highly notable. The spatial pattern of macrobenthic composition varied across and along the coast between Poombukar and Nagoor as a response to black sand composition. Although, valid or not valid due to different level of taxonomic identification and size mesh use for separating macro in faunas, the relation between black sand and species are similar to that observed by many scientists in other region. The high values were exhibited in the number of families in the nonblack sand region and very low density of population in the black sand region. The low content of macrofauna in the black sand region is not only due to grain size variation but also related to the organic content associated with it and the nature of black sand content namely ilmenite and zircon.
The enrichment of ilmente and zircon in the region of Chandrapadi, Karaikal and Nagoor accepted a strong influence and a spatial distribution and composition of macro infauna. The difference in community composition is evident between the black sand and nonblack sand region. The changes in macrofauna community composition with depth are under recognised pattern. This pattern of changes could also be related to changes in food supply and quality of water sterility, influence of waves, currents, tides and the radiation effects. Although in this study, the macro fauna in species level is evident that non-black sand area is rich in species with high density and that gradient grain into fine with enrichment of ilmenite and zircon influencing macrofauna distribution. The aerial patterns in macrobenthic community structure resulted due to the strong interaction between grain and mineralogical characters and process associated with nearshore circulation.
Out of this variability, the mineralogical variations are very clear in controlling macrobenthic community diversity. But the pattern is not uniform for all levels of mineralogical variation of these various stations with changes within the black sand region with markedly more than at white sand region. It is therefore proposed that reworking of black sand minerals by physical disturbance through the year controlled the macrofauna density and the abundance of the species. The hydrodynamic of a site can play a major role in determining the benthic larvae to become settled and resident in the swash zone. In sand environment where there is light but the sediment are too mobile, the white sand environment support macro algae, micro algae production but the production is partial in organic enrichment area. It is also inferred that black sand area is devoid of organic matter due to lack of light and algal growth, macrofaunal assemblages are virtually less.
Distribution of Textural Parameters
Mean
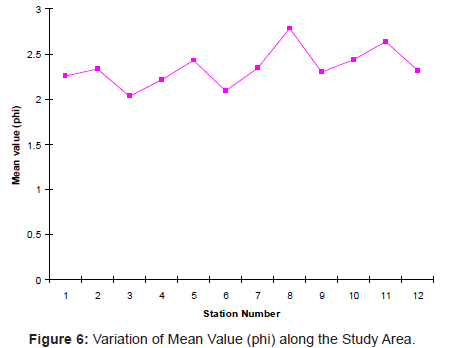
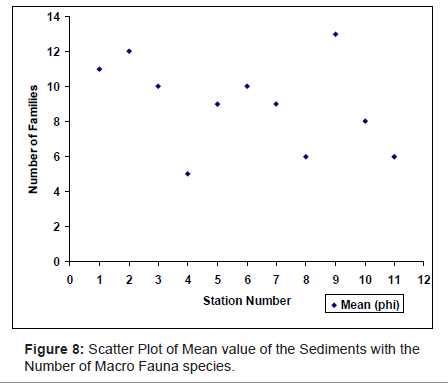
The geological significance of the mean grain size is to understand the nature of sediments and its depositional basin is very significant. Mean size is a function primarily of two factors: (1) the grain size range of available material and (2) the amount of energy imparted to the sediment. The latter depends upon the current or turbulence of the transporting medium. Fine sand fraction is more abundant than the coarse sand fraction except in the samples from the lowtide level where medium sand is present. Mean size values fluctuate between 1.67 φ to 2.78 φ. However, the beach sediments most of the study area beaches fall within the range of 1.67 φ to 2.21 φ (Table 3). Variation and scatter plot of mean value of sediments in species are shown in the Figures 6 and 8.
| Station No. | Mean (phi) |
|---|---|
| 1 | 2.26 |
| 2 | 2.33 |
| 3 | 2.03 |
| 4 | 2.21 |
| 5 | 2.43 |
| 6 | 2.09 |
| 7 | 2.34 |
| 8 | 2.78 |
| 9 | 2.3 |
| 10 | 2.44 |
| 11 | 2.64 |
| 12 | 2.32 |
Table 3: Mean size value along the Study Area.
Standard deviation
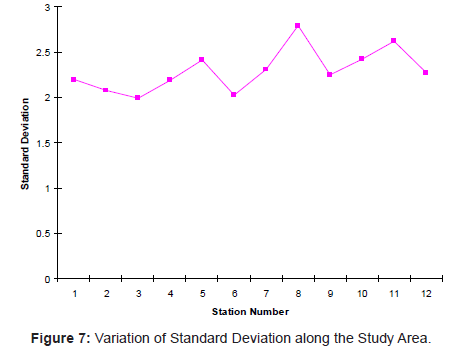
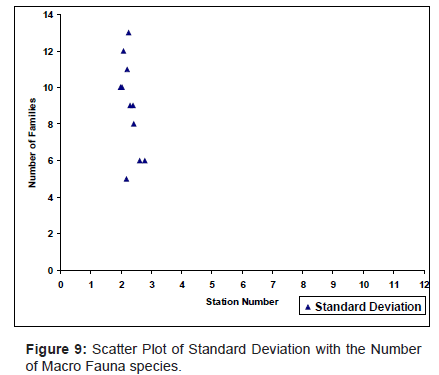
The standard deviation is a measure of sorting or spread. Sorting is another measure which is strongly dependent on grain size. It is principally controlled by the size range or material supplied to the environment, types of deposition, current characteristics, rate of supply of detritus and the efficiency of the sorting agent. As the area is influenced by number of rivers debouching into the sea, the study of sorting is essential to delineate the nature of depositional environment. The better sorted sediments are usually those with the mean size range of about 2 φ to 3 φ. Having different geomorphic units with variation in grain size, the three sub groups in the region show characteristic sorting values. They are in the range of 0.35 φ to 0.71 φ, 0.25 φ to 0.55 φ and 0.35 φ to 0.61 φ along the study area (Table 4). Variation and scatter plot of standard deviation of sediments in species are shows in the Figures 7 and 9.
| Station No. | Standard Deviation |
|---|---|
| 1 | 1.85 |
| 2 | 2.08 |
| 3 | 1.99 |
| 4 | 2.19 |
| 5 | 2.41 |
| 6 | 2.03 |
| 7 | 2.31 |
| 8 | 2.79 |
| 9 | 2.25 |
| 10 | 2.42 |
| 11 | 2.62 |
| 12 | 2.28 |
Table 4: Standard Deviation Value along the Study Area.
Conclusion
The black sand enrichment area like Chandrapadi, Karaikal and Nagoor indicates that the colonisation of macrobenthic fauna is totally absent. This study is carried out on benthos in terms of impact of beach sand extraction and concluded that the white sand constituted more habitats than the black sand area. The sediment grain size particularly in coarse sand having non-black sand shows more interrelationship with macrobenthic faunal diversity which also clearly indicate the supply of organic matter source of food web to the species. Based on the work the following recommendations are to be needed for better ecological balance in near shore regions i) The survey of macrofauna of the proposed mining site and mining site are carried out and compare with non-black sand enrichment area ii) The survey of benthic microfauna before and after disturbance in mining site is to be evaluated periodically iii) An experiment in which plots on the intertidal zone are defaunated by stimulated beach sand mining method and recolonisation of macrofauna monitor through time iv) Survey of benthic scavengers species is also to be monitored both in the mining and non-mining site.
Acknowledgement
The authors wish to thank the Council of Scientific and Industrial Research (CSIR), Government of India for providing financial support and necessary equipments in the form of a project to perform this study. We also thank the Registrar and Vice-Chancellor of Manonmaniam Sundaranar University, Tirunelveli for extending the required facilities for undertaking this study.
References
- Snelgrove PVR (1998) The biodiversity of macrofaunal organisms in marine sediments. Biodiversity and conservation 7: 1123-1132.
- Vourget Abioch L, Glacon R (1975) Distribution des peceplements benthiques on Manch orientale, dela Bace de Somma are Pas-de-calis. Comptes Rendus de la Academic des sciences de paris 280, serie D 491 - 494.
- Annapurna C, DV Ramasarma (1986) Distribution of living benthic ostracods in the Bimili backwaters East coast of India 15: 174-176.
- Gopala Krishnapillai., N. (1976). Distribution and seasonal abundance of macro benthos of the Cochin backwaters. Indian J. Mar. Sci. Vol 6 pp 1-5.
- Kazanci N, Oguikurt D, Girgin S, Dugel M (2003) Distribution of benthic macroinvertebrates in relation to Physico - Chemical properties in the Koyagiz Dalyan estuarine channel system (Mediterranean sea, Turkey). Indian J Mar Sci 32: 141-146.
- Sasekumar A (1974) Distribution of macrofauna on a Malayan mangrove shore. J Anim Ecol 43: 51-69.
- Venkatesh Praphee, MVM Reebly (1987) Macro benthos and sediment distribution in relation to Damer sal fish catches off Bai - Kampady - Suratkal, South Kanara coast, India. J Mar Sci 16: 60-64.
- Van Bruggen AC, Wells SM, kemperman TCM (1995) Biodiversity of the Mollusca; time for a New approach. In biodiversity and conservation of the Mollusca (A.C. Van Bruggen,ed) pp 1-20 - Oegstgeest - Leiden; Buckhuys publishers.
- Rex MA, Stuart CT, Hessler RR, Allen JA, Sanders HL, et al. (1993) Global-Scale latitudinal patterns of species diversity in the deep-sea benthos. Nature 365: 636-639.
- Gray JS (2000) The measurement of marine species diversity, with an application to the benethic fauna of the Norwegian continental shelf. J Exp Mar Biol Ecol 250: 23-49.
- Pearson TH, Rosenberg R (1978) Macrobenthic succession in relation to organic enrichment and pollution of the marine environment. Oceanogr. Mar Biol Ann Rev 16: 229-311.
- Weston DP (1988) Macrobenthos-sediment relationships on the continental shelf off cape hatteras, North Carolina. Cont Shelf Res 8: 267-286.
Relevant Topics
- Algal Blooms
- Blue Carbon Sequestration
- Brackish Water
- Catfish
- Coral Bleaching
- Coral Reefs
- Deep Sea Fish
- Deep Sea Mining
- Ichthyoplankton
- Mangrove Ecosystem
- Marine Engineering
- Marine Fisheries
- Marine Mammal Research
- Marine Microbiome Analysis
- Marine Pollution
- Marine Reptiles
- Marine Science
- Ocean Currents
- Photoendosymbiosis
- Reef Biology
- Sea Food
- Sea Grass
- Sea Transportation
- Seaweed
Recommended Journals
Article Tools
Article Usage
- Total views: 15093
- [From(publication date):
December-2012 - Mar 31, 2025] - Breakdown by view type
- HTML page views : 10397
- PDF downloads : 4696

