Research Article Open Access
Identification and Reduction of Matrix Effects Caused by Cremophor EL in Bioanalysis Using Liquid Chromatography/Tandem Mass Spectrometry
Vijaya Bhaskar V1 *, Anil Middha2 , Sudhir Tiwari1 and Savithiri Shivakumar1
1DMPK Laboratory (Biology Division), GVK BIO, Hyderabad, India
2Department of Pharmacy, Jagadishprasad Jhabermal Tibrewala University, Rajasthan, India
- *Corresponding Author:
- Vijaya Bhaskar V
DMPK Laboratory (Biology Division)
GVK BIO, Nacharam, Hyderabad
Andhra Pradesh, India-500076
Tel: +918143853440
E-mail: veeravalli.bhaskar@gmail.com
Received date: March 05, 2013; Accepted date: June 11, 2013; Published date: June 13, 2013
Citation: Vijaya Bhaskar V, Middha A, Tiwari S, Shivakumar S (2013) Identification and Reduction of Matrix Effects Caused by Cremophor EL in Bioanalysis Using Liquid Chromatography/Tandem Mass Spectrometry. J Anal Bioanal Tech 4:167. doi: 10.4172/2155-9872.1000167
Copyright: © 2013 Vijaya Bhaskar V, et al. This is an open-access article distributed under the terms of the Creative Commons Attribution License, which permits unrestricted use, distribution, and reproduction in any medium, provided the original author and source are credited.
Visit for more related articles at Journal of Analytical & Bioanalytical Techniques
Abstract
Ion suppression effect of dosing vehicle excipient Cremophor EL (CrEL) on the accuracy of liquid chromatography/ tandem mass spectrometry (LC-MS/MS) measurements was studied. Ion suppression cause significant errors in accuracy of the measured concentrations of test compounds, thereby invalidating the assessment of pharmacokinetic results. Using CrEL as a probe compound, the concentration-time profile of the excipient in plasma from rats dosed both orally and intravenously was determined. The most abundant molecular ions corresponding to PEG oligomers at m/z 828, 872, 916 and 960 with daughter ion at m/z 89 were selected for multiple reaction monitoring (MRM) in electrospray mode of ionization. Plasma concentrations of CrEL ranging from 0.50-1.0 mg/mL in the initial sampling points caused 2-10 fold ion suppression on most of the analytes studied. This can result in false rejection of compounds in a drug discovery screen. In this paper, various sample preparation methods, enhanced chromatographic selectivity, and alternative ionization methods were investigated as means to avoid or minimize ion suppression effects. The elimination of ion suppression effects was achieved by Liquid-Liquid Extraction (LLE) with hexane, TBME in Electrospray Ionisation (ESI) mode as sample preparation method. In contrast to ESI mode that had severe suppression effects from CrEL, atmospheric pressure chemical ionisation (APCI) mode is totally free of suppression effects. The mechanism of ion suppression caused by CrEL in relation to both liquid and gas phase reactions was discussed.
Keywords
CrEL; LC-MS/MS; MRM; LLE; Matrix effect
Introduction
Highthroughput pharmacokinetic screening plays an important role in pharmaceutical research to rapidly identify pharmacokinetic profiles of potent and selective compounds [1-3]. Liquid chromatography/ tandem mass spectrometry (LC-MS/MS) with either electrospray ionisation (ESI) or atmospheric pressure chemical ionisation (APCI) provides a sensitive and selective detection method for the quantitation of drug candidates in biological matrices [4]. Although LC-MS/MS is extremely sensitive and robust in terms of performance there is potential for ion suppression which leads to incorrect data interpretation. ESI is more prone to ion suppression effects than APCI [5,6]. Ion suppression could originate from endogenous compounds such as phospholipids [7], metabolites, coadministered drugs, internal standards [8], dosing vehicles [9-11], mobile phase additives [12] and plastic tubes [13]. In preclinical pharmacokinetic studies, formulation excipients typically are used at high concentrations to facilitate the dissolution of test compounds in the formulation solution. Cremophor EL (CrEL) can cause significant signal suppression for certain analytes when minimal sample cleanup is used. The presence of higher concentration of formulation excipient in early time point samples after intravenous or oral administration, can cause significant ion suppression on the analytes [9,10,14]. This effect is more pronounced with the use of ultrafast gradients that causes coelution of many analytes. Ion suppression effects are complicated to handle in a drug discovery environment where hundreds of molecules with differing physicochemical properties (logD7.4, logP, pKa) are handled. These molecules may be differrentially ion suppressed depending on their elution on a typical liquid chromatography (LC) gradient, compared with ion suppressing agent and their ability to compete with charge from the suppressing agent. The U.S food and drug administration (FDA) guidance for industry on bioanalytical method validation insists upon the assessment of matrix effects during method validation for quantitative bioanalytical LC-MS/MS methods [15]. Several approaches investigated so far to minimize the ion suppression effects by CrEL were LC gradient manipulation with short run time [16], sample preparation by LLE with TBME and separation by gradient elution [17]. While these strategies are helpful to solve the ion suppression issues on few analytes, a unique solution wasn‘t found for wide range of new chemical entities studied in drug discovery. In this paper, strategies for identification of ion suppression due to CrEL and effective removal of ion suppression are discussed.
The mechanism of ion suppression has been proposed and discussed by several research groups, but is not fully understood. Various mechanisms by which formulation excipients cause ion suppression are: charge competition, change in droplet surface tension, preferential ion evaporation, gas phase deprotonation and co precipitation [18-20]. The mechanism for Cremophor EL related signal interference has been proposed.
Experimental Section
Materials
Reference compounds (atenolol, caffeine, metaprolol, propranolol, telmisartan, ketoconazole, diltiazem, ranitidine and warfarin) were procured from Sigma Aldrich Co. (St. Louis, MO, USA). Cremophor EL, dimethyl sulfoxide (DMSO), monobasic sodium phosphate, dibasic sodium phosphate and ammonium acetate were procured from sigma Aldrich Co. (St. Louis, MO, USA). Acetonitrile, acetone, water and methanol (HPLC grade) were obtained from Merck specialities pvt ltd (Mumbai, India). Formic acid (90% purified) was procured from Merck specialities pvt ltd (Mumbai, India). Sprague dawley rats were procured from Bioneeds ltd (Bangalore, India). Blood collection vacutainers (Lithium Heparin as anticoagulant) were sourced from BD (Franklin lakes, USA).
Plasma concentrations of CrEL
Preparation of calibration standards and quality control samples: Master stock solution of polypropylene glycol (PPG) (1 mg/ mL) (specific gravity: 1.01 g/mL) was prepared in DMSO. Master stock solution of CrEL (50 mg/mL) (specific gravity: 1.05 g/mL) was prepared in DMSO. Working standard solutions of PEG Oligomers (CrEL-PEG) were prepared by serial diluting from master stock with acetonitrile: DMSO: water (2:2:1). Working standard solutions were prepared at 25 fold higher concentration than plasma calibration standards and quality control samples. Plasma calibration standards were prepared at 1.00, 1.50, 5.00, 20.00, 70.00, 120.00, 160.00, 180.00, 200.00 μg/mL and quality control samples were prepared at three levels, viz. 2.50 μg/mL (LQC, low quality control), 125.00 (MQC, middle quality control) and 162.00 μg/mL (HQC, higher quality control). Calibration standards and quality control samples of CrEL-PEG were prepared by spiking 2 μL of the working standard solutions into 48 μL of blank rat plasma. The working solution for internal standard (10 μg/mL) was prepared by diluting an aliquot of master stock solution with acetonitrile. Master stock solutions were stored at 4°C when not in use.
Animal dosing: Cremophor EL was administered intravenously (lateral tail vein) and orally (oral gavage needle) to fasted male sprague dawley rats at a dose of 0.26 g/kg. Dose volume administered was 5 mL/ kg. The composition of dosing vehicle used for the study was Ethanol/ CrEL/water (10: 5: 85, % v/v/v) [21,22]. Serial blood samples were collected into vacutainers containing lithium heparin (anticoagulant) at 0.08, 0.25, 0.50, 1, 2, 4, 8 and 24 h post dose [23] after intravenous administration and 0.25, 0.50, 1, 2, 4, 8 and 24 h post dose [23] after oral administration. Plasma was separated after centrifugation and stored at -80°C until analysis.
Sample preparation: A 50 μL aliquot of plasma (blank control plasma, plasma samples from rats dosed with CrEL, blank plasma spiked with calibration standards and QC samples) was pipetted in to a 96 well polypropylene plate and extracted with 200 μL of acetonitrile containing internal standard. Samples were vortex mixed for 10 min at 1200 rpm centrifuged at 3350 g for 10 min at 4°C. 50 μL of supernatant was pipette transferred in to a fresh analysis plate and diluted with 450 μL of water and 5 μL aliquots were injected for LC-MS/MS analysis.
LC-MS/MS analysis: All mass spectrometric estimations were performed on a sciex 3200 QTrap triple quadrupole instrument with turboionspray (AB Sciex, Toronto, Canada). The HPLC system consisted two of LC20AD UFLC pumps and a SIL HTC autosampler (Shimadzu, Kyoto, Japan). The stationary phase was XBridge C18 with 3.5 μm particle diameter (Waters, Ireland). The column dimensions were 50×4.6 mm. The mobile phase flow rate was 1.0 mL/min. The mobile phase consisted of 0.1% formic acid in water as aqueous component and acetonitrile with 20% tetrahydrofuran (THF) as organic modifier. A generic gradient LC method with a short run time of 3.5 min was developed for the analysis of CrEL-PEG in plasma samples. The column and auto sampler were maintained at 40°C and 4°C respectively. The turboionspray source was operated with typical settings as follows: ionization mode, positive; curtain gas, 20 psi; nebulizer gas (GS1), 50 psi; heater gas (GS2), 50 psi; ion spray voltage, 5500 V; temperature, 550°C. The molecular ions of CrEL-PEG and PPG were formed using the declustering potentials of 120 V, 80 V respectively. In MRM mode the most abundant and informative molecular ions corresponding to CrEL-PEG were selected at m/z 828, 872, 916, 960 and fragmented to identical daughter ion at m/z, 89.10 at collision energy of 50 V with medium CAD gas setting. Molecular ion (m/z, 906.80) of PPG was fragmented to daughter ion with m/z, 117.10 at collision energy of 45 V. Peak areas for all components were automatically integrated using Analyst software version 1.5.
Preparation of plasma samples-CrEL investigations
Preparation of master and working stock solutions: Master stock solutions of atenolol, caffeine, metaprolol, telmisartan, propranolol, diltiazem, ketoconazole, ranitidine and warfarin (1 mg/ml) were prepared in DMSO. Working standard solutions of CrEL were prepared by serial dilution from master stock (CrEL provided by supplier with density of 1.05 g/mL was used as master stock) at 25 times higher concentration than plasma concentrations in acetonitrile: water: DMSO (2:2:1). A total of twelve working concentrations of Cremophor EL were prepared. Plasma concentrations (0.05, 0.10, 0.25, 0.50, 0.75, 1.00, 1.25, 1.50, 1.75, 2.00, 4.00, 6.00 mg/mL) of CrEL were prepared by spiking 2 μL of working concentrations in 48 μL of blank rat plasma. Pooled working stock solution of reference compounds at 1000 ng/mL concentrations was prepared in acetonitrile: water (1:1). Master stock and working stock solutions were stored at 4°C when not in use.
Sample preparation
Protein Precipitation (PPT): A 50 μL aliquot of plasma (blank plasma, plasma samples spiked with CrEL) was pipette transferred in to a 96 well polypropylene plate and extracted with 200 μL of acetonitrile. Samples were vortex mixed for 10 min at 1200 rpm and centrifuged at 4000 rpm for 10 min at 4°C. 150μL of supernatant was pipette transferred to a fresh analysis plate and diluted with 150 μL of pooled working stock solution of reference compounds. 10μL were injected for LC-MS/MS analysis.
Liquid Liquid Extraction (LLE): A 50 μL aliquot of plasma (blank plasma, plasma samples spiked with CrEL) was pipette transferred in to a 96 well polypropylene plate and extracted with 1000 μL of ethyl acetate, tert-butyl-methyl ether (TBME) and hexane individually. Samples were vortex mixed for 10 min at 1000 rpm and centrifuged at 4000 rpm for 10 min at 4°C. 800 μL of supernatant was pipette transferred to a fresh evaporation plate and evaporated to dryness under nitrogen at 40°C for 10 min. After evaporation, samples were reconstituted with 300 μL of pooled working stock solution of reference compounds and 10 μL were injected for LC-MS/MS analysis.
LC-MS/MS analysis: All mass spectrometric estimations were performed on a sciex 3200 QTrap triple quadrupole instrument with turboionspray (AB Sciex, Toronto, Canada). The HPLC system consisted two of LC20AD UFLC pumps and a SIL HTC autosampler (Shimadzu, Kyoto, Japan). The stationary phase was XBridge C18 with 3.5 μm particle diameter (Waters, Ireland). The column dimensions were 50×4.6 mm. The mobile phase flow rate was 1.0 mL/min with a split ratio of 1:1 to the ionization source. The mobile phase consisted of the following combinations of aqueous and organic modifiers: 1) 0.1% formic acid in water, 100% acetonitrile (FA-ACN) 2) 0.1% formic acid in water, 100% methanol (FA-MEOH) 3) 10 mM ammonium acetate in water, 100% acetonitrile (AA-ACN) 4) 10 mM ammonium acetate in water, 100% methanol (AA-MEOH). A generic gradient LC method (Time (min)/% B=0.01/5, 1.50/95, 2.50/95, 2.60/5, 3.50/5) with a short run time of 3.5 min was used for the quantification of reference compounds and CrEL-PEG. The column and auto sampler were maintained at 40°C and 4°C respectively. The turboionspray source was operated with typical settings as follows: ionization mode, positive; curtain gas, 15 psi; nebulizer gas (GS1), 50 psi; heater gas (GS2), 50 psi (ESI); ionspray voltage (IS), 5500 V (ESI); nebulizer current (NC), 5A (APCI); temperature, 550°C. List of MRM used for quantification of reference compounds was presented in Table 1. Peak areas for all components were automatically integrated using Analyst software version 1.5.
| Compound Name | Q1 Mass (Da) | Q3 Mass (Da) | Dwell Time (msec) | Declustering Potential (v) | Collision energy (v) |
|---|---|---|---|---|---|
| Propranolol | 260.10 | 116.20 | 100 | 40 | 25 |
| Caffeine | 195.10 | 137.90 | 100 | 45 | 25 |
| Ketoconazole | 531.10 | 82.10 | 100 | 80 | 80 |
| Diltiazem | 415.10 | 178.10 | 100 | 40 | 32 |
| Ranitidine | 315.10 | 176.10 | 100 | 25 | 22 |
| Atenolol | 267.10 | 145.10 | 100 | 40 | 32 |
| Telmisartan | 515.30 | 276.10 | 100 | 65 | 64 |
| Metoprolol | 268.10 | 116.00 | 100 | 50 | 25 |
| Warfarin | 309.20 | 163.00 | 100 | 50 | 21 |
Table 1: List of MRM used for quantification of reference compounds.
Results and Discussion
Plasma concentrations of CrEL
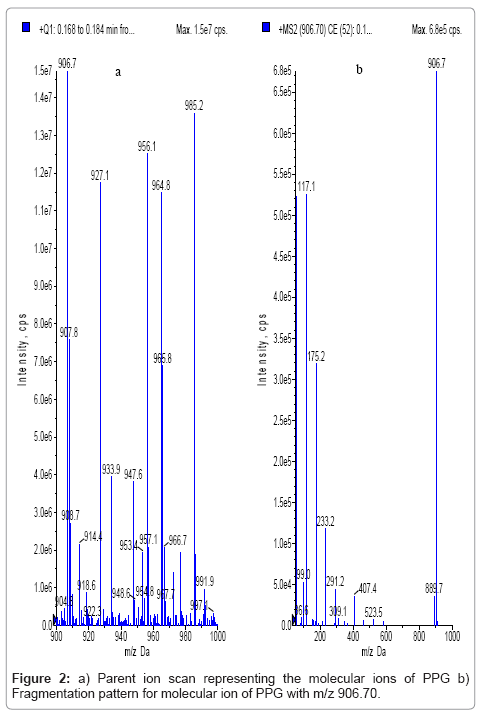
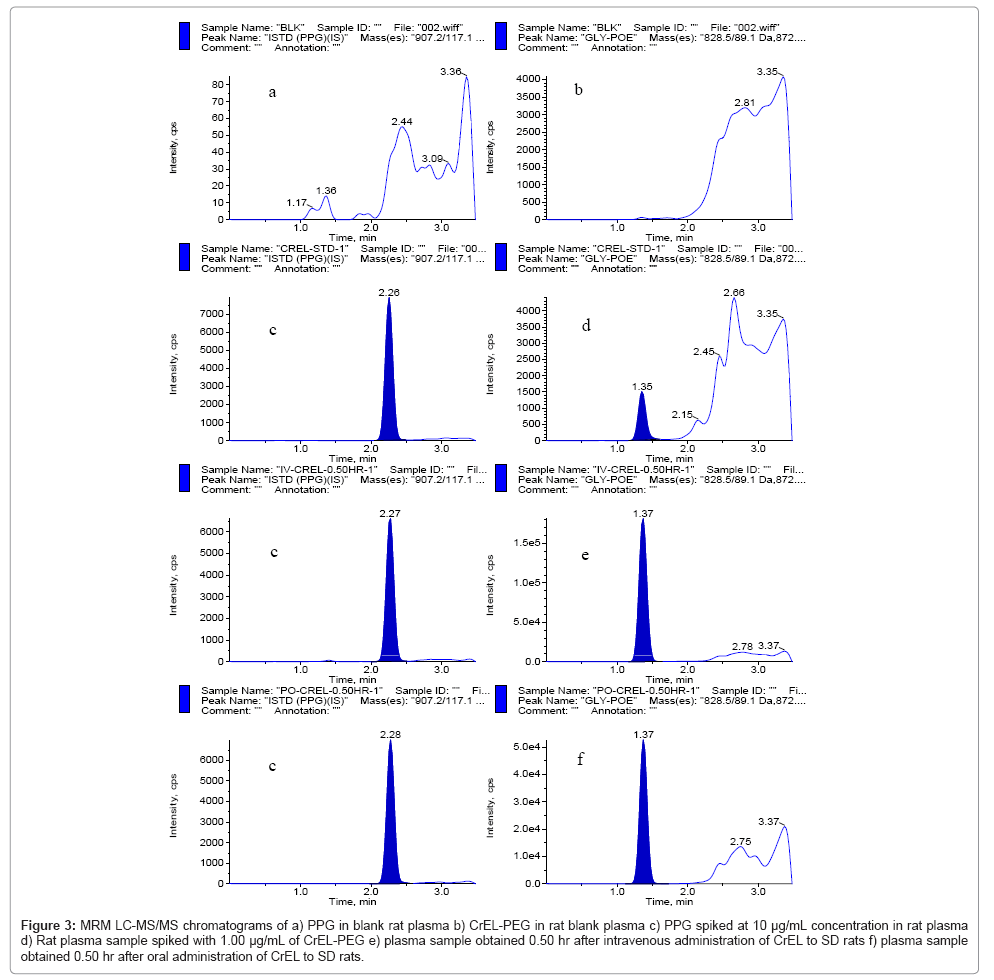
PEG oligomers corresponding to CrEL (Figure 1a) generated identical daughter ion with m/z, 89.10 (Figure 1b; fragmentation pattern of one oligomer m/z 960.20 was represented in the figure, other oligomers also shared similar fragmentation pattern). The molecular ions of PEG oligomers detected were ammonium adducts. For calculating the plasma concentrations of CrEL-PEG as a whole, analyte peak areas of the four oligomers were summed and calibration curve was built. The electrospray ionization of PPG produced abundant molecular ions at m/z, 906.70 (Figure 2a) and generated an intense fragment at 117.10 amu (Figure 2b). LC-MS/MS method operated with the C18 column and a 3.5 min generic gradient LC method (Time (min)/%B=0.01/5, 1.50/95, 2.50/95, 2.60/5, 3.50/5) was developed for the analysis of CrEL-PEG in plasma. Various organic modifiers such as acetonitrile, methanol and acetone were tested for achieving better peak shape and address the response saturation observed at higher calibration standards for CrEL-PEG. All organic modifiers tested resulted in poor linearity with response saturation at higher calibration standards. However, addition of THF to acetonitrile resulted in better linearity and response saturation was not seen. THF is the solvent of choice for the analysis of many polymers [24,25]. But, higher percentages of THF cannot be used practically in LC-MS/MS as it is highly inflammable solvent. So, final mobile phase conditions were optimized to 20% THF in acetonitrile. No interference at the retention times of PPG (2.26 min) (Figure 3a) and CrEL-PEG (1.35 min) (Figure 3b) was observed in any of the lots screened as shown in representative chromatogram of the extracted blank plasma sample, confirming the selectivity of the present method. Representative chromatogram of PPG at 10 μg/mL spiked concentration was shown in Figure 3c. Representative chromatogram of CrEL at LLOQ was shown in Figure 3d. The LLOQ was set at 1.00 μg/mL for CrEL-PEG using 50 μL of rat plasma. The retention times of CrEL-PEG and PPG were reproducible throughout the experiment and no column deterioration was observed after analysis of plasma samples. Plasma samples from both intravenous and oral routes were analysed with the developed bioanalytical method using LC-MS/ MS. Representative chromatograms of CrEL-PEG from intravenous (0.50 hr), oral (0.50 hr) study samples were shown in Figures 3e and 3f respectively. CrEL plasma concentrations following intravenous administration were high (0.5-1 mg/mL) in the initial sampling points. Mean plasma concentrations of CrEL after intravenous and oral administration were shown in Tables 2 and 3 respectively.
Figure 3: MRM LC-MS/MS chromatograms of a) PPG in blank rat plasma b) CrEL-PEG in rat blank plasma c) PPG spiked at 10 μg/mL concentration in rat plasma d) Rat plasma sample spiked with 1.00 μg/mL of CrEL-PEG e) plasma sample obtained 0.50 hr after intravenous administration of CrEL to SD rats f) plasma sample obtained 0.50 hr after oral administration of CrEL to SD rats.
| Time (hr) | Concentration(μg/mL) | %CV | ||||
|---|---|---|---|---|---|---|
| Rat-1 | Rat-2 | Rat-3 | Mean | STDEV | ||
| 0.08 | 784.38 | 687.73 | 600.85 | 690.99 | 91.81 | 13 |
| 0.25 | 692.94 | 585.97 | 584.83 | 621.25 | 62.09 | 10 |
| 0.50 | 587.92 | 491.69 | 402.23 | 493.95 | 92.87 | 19 |
| 1.00 | 415.86 | 331.82 | 313.03 | 353.57 | 54.76 | 15 |
| 2.00 | 207.41 | 160.13 | 159.28 | 175.61 | 27.54 | 16 |
| 4.00 | 102.73 | 75.51 | 85.11 | 87.78 | 13.80 | 16 |
| 8.00 | 23.63 | 31.71 | 38.89 | 31.41 | 7.63 | 24 |
| 24.00 | 14.92 | 19.32 | 21.70 | 18.65 | 3.44 | 18 |
Table 2: Plasma concentration levels of CrEL-PEG after intravenous administration of CrEL at 0.26 g/kg dose.
| Time (hr) | Concentration (μg/mL) | %CV | ||||
|---|---|---|---|---|---|---|
| Rat-1 | Rat-2 | Rat-3 | Mean | STDEV | ||
| 0.25 | 13.36 | 17.02 | 17.75 | 16.04 | 2.35 | 15 |
| 0.50 | 18.42 | 30.50 | 24.45 | 24.45 | 6.04 | 25 |
| 1.00 | 16.55 | 24.37 | 17.44 | 19.46 | 4.28 | 22 |
| 2.00 | 15.06 | 9.45 | 8.75 | 11.09 | 3.46 | 31 |
| 4.00 | 2.94 | 1.88 | 1.90 | 2.24 | 0.61 | 27 |
| 8.00 | BLQ | BLQ | BLQ | NC | NC | NC |
| 24.00 | BLQ | BLQ | BLQ | NC | NC | NC |
NC-Not Calculated
BLQ-Below Limit of Quantitation
Table 3: Plasma concentration levels of CrEL-PEG after oral administration of CrEL at 0.26 g/kg dose.
Preparation of plasma samples-CrEL investigations
Samples extracted by protein precipitation were analysed with different mobile phase conditions in ESI mode to check if the elution pattern of the excipient behaves differently to that of reference compounds. As it is well known that APCI was less prone to matrix effects compared to ESI, protein precipitated samples were also analyzed in this mode. Samples extracted by LLE were analyzed in ESI mode. LC conditions used for analysis of LLE samples in ESI mode and protein precipitated samples in APCI mode were similar to the conditions used for the analysis of CrEL in plasma samples. Solid phase extraction wasn´t tried as alternate extraction technique as this work was done to provide a unique solution for nullifying the ion suppression effects caused by CrEL in the bioanalysis of new chemical entities. For developing a SPE method, molecular, physico chemical properties of NCEs should be known and a lot of time should be invested on method development which practically is impossible in drug discovery where throughput drives the fate of project.
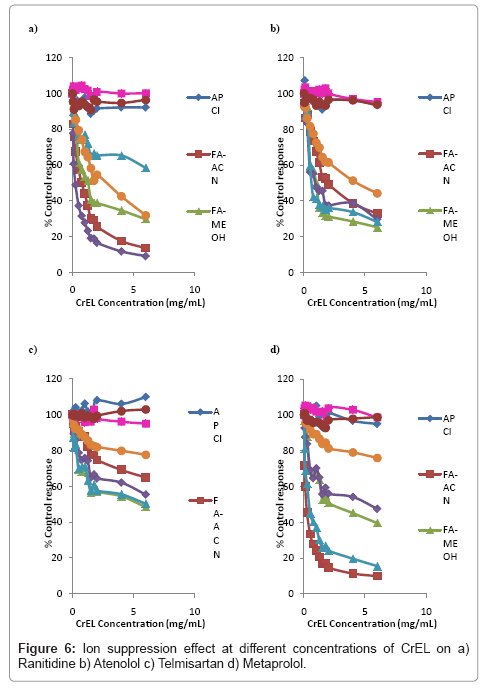
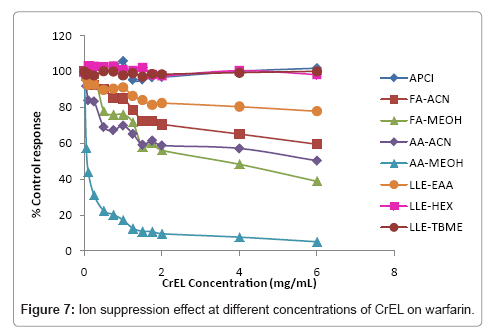
Peak area of reference compound at each concentration of CrEL spiked in to plasma was compared against negative control samples to calculate % ion suppression. A total suppression of ± 15% from the control response was considered as acceptable according to US FDA validation guidelines [15]. A detailed discussion on the results obtained with different system conditions for each reference compounds was given below.
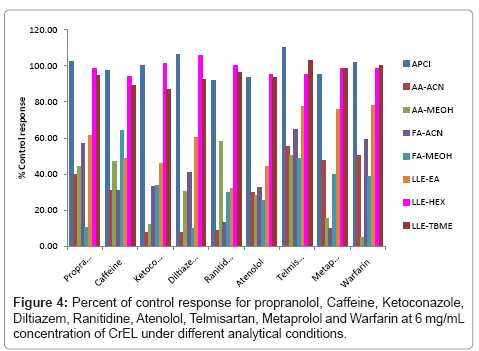
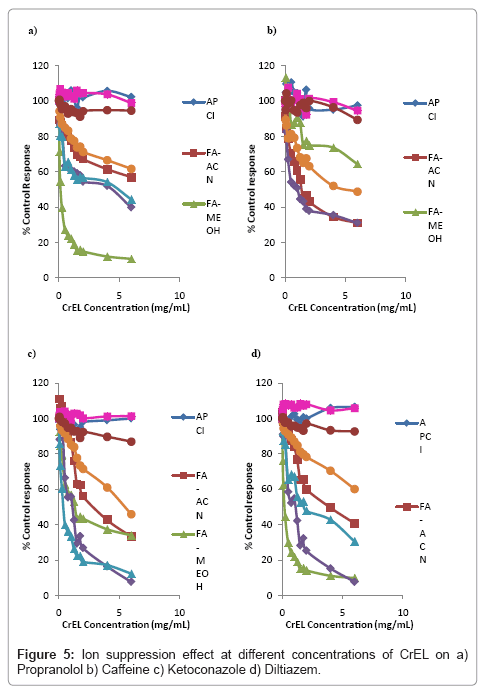
Propranolol: At an excipient concentration of 6 mg/mL, propranolol had >85% ion suppression using FA-MEOH as mobile
Caffeine: At an excipient concentration of 6 mg/mL, caffeine had >50% ion suppression using a) All mobile phase combinations (Except FA-MEOH with >35% ion suppression) b) ethyl acetate extraction (Figure 4). Ion suppression at different concentrations of CrEL under different analytical conditions was shown in Figure 5b.
Ketoconazole: At an excipient concentration of 6 mg/mL, ketoconazole had > 50% ion suppression using a)All mobile phase combinations b) ethyl acetate as extraction solvent (Figure 4). Ion suppression at different concentrations of CrEL under different analytical conditions was shown in Figure 5c.
Diltiazem: At an excipient concentration of 6 mg/mL, diltiazem had >50% of ion suppression using all mobile phase combinations (Figure 4). Ion suppression at different concentrations of CrEL under different analytical conditions was shown in Figure 5d.
Ranitidine: At an excipient concentration of 6 mg/mL, ranitidine had >50% ion suppression using a) mobile phase combination of FAACN, FA-MEOH, AA-ACN b) ethyl acetate extraction (Figure 4). Ion suppression at different concentrations of CrEL under different analytical conditions was shown in Figure 6a.
Atenolol: At an excipient concentration of 6 mg/mL, atenolol had >50% ion suppression using a) all mobile phase combinations b) ethyl acetate extraction (Figure 4). Ion suppression at different concentrations of CrEL under different analytical conditions was shown in Figure 6b.
Telmisartan: At an excipient concentration of 6 mg/mL, telmisartan had >35% ion suppression using all mobile phase combinations (Figure 4). Ion suppression at different concentrations of CrEL under different analytical conditions was shown in Figure 6c.
Metaprolol: At an excipient concentration of 6 mg/mL, metaprolol had >50% ion suppression using all mobile phase combinations (Figure 4). Ion suppression at different concentrations of CrEL under different analytical conditions was shown in Figure 6d.
Warfarin: At an excipient concentration of 6 mg/mL, warfarin had >60% ion suppression using mobile phase combination of AAMEOH, FA-MEOH and >40% ion suppression using mobile phase combination of AA-ACN, FA-ACN (Figure 4). Ion suppression at different concentrations of CrEL under different analytical conditions was shown in Figure 7a.
Using different mobile phase conditions didn´t nullify the ion suppression effects caused by CrEL on any of the reference compounds studied in ESI mode of analysis. Protein precipitated samples analysed by APCI mode of ionization brought down the ion suppression effects caused by CrEL on all the reference compounds studied. LLE with hexane and TBME proved to be the best sample preparation methods that brought down the suppression effects caused by CrEL. Sample preparation by extraction with hexane, TBME and analysis in ESI mode; APCI mode of ionization for protein precipitation samples proved to be the best methodologies for the analysis of all reference compounds (Figure 4). As none of the reference compounds had suppression effects in APCI mode of ionization, it shows that CrEL causes only liquid phase suppression effects in ESI mode of ionization. ESI is prone to matrix effects caused by excipients in liquid and gas phase whereas APCI is resistant to liquid phase suppression effects.
We propose various mechanisms by which CrEL might cause ion suppression effects on different analytes:
1. Increase in surface tension and viscosity of the droplets due to high concentrations of excipient leading to insufficient evaporation (ESI)
2. Solution phase charge competition (ESI)
Conclusion
A MRM based method was developed for the quantification of CrEL concentration levels in rat plasma samples. Based on the physiological concentration levels of excipient, various approaches such as a) different mobile phase conditions b) different extraction techniques c) different ionization conditions were tested for finding best technique that nullifies ion suppression effects. The approaches for reducing the ion suppression effects in LC-MS/MS are largely analyte dependent. Sample preparation with hexane, TBME as extraction solvent totally nullified the ion suppression effects caused by CrEL on all the reference compounds studied. APCI mode of ionization was proved to be the best ionization type for analyzing the samples containing significant amounts of CrEL. Mechanism of ion suppression caused by CrEL was proposed as a) charge competition b) increase in surface tension/ viscosity of droplets.
References
- Heath TG, Scott DO (1997) Quantification of a potent 5HT2a antagonist and an active metabolite in rat plasma and brain microdialysate by liquid chromatography-tandem mass spectrometry. J Am Mass Spectrom 8: 371-379.
- Olah TV, McLoughlin DA, Gilbert JD (1997) The simultaneous determination of mixtures of drug candidates by liquid chromatography/atmospheric pressure chemical ionization mass spectrometry as an invivo drug screening procedure. Rapid Commun Mass Spectrom 11: 17-23.
- Watt AP, Morrison D, Locker KL, Evans DC (2000) Higher throughput bioanalysis by automation of a protein precipitation assay using a 96-well format with detection by LC-MS/MS. Anal Chem 72: 979-984.
- Covey TR, Lee ED, Henion JD (1986) High-speed liquid chromatography/tandem mass spectrometry for the determination of drugs in biological samples. Anal Chem 58: 2453-2460.
- Pommier F, Frigola R (2003) Quantitative determination of rivastigmine and its major metabolite in human plasma by liquid chromatography with atmospheric pressure chemical ionization tandem mass spectrometry. J Chromatogr B Analyt Technol Biomed Life Sci 784: 301-313.
- Dams R, Huestis MA, Lambert WE, Murphy CM (2003) Matrix effect in bio-analysis of illicit drugs with LC-MS/MS: influence of ionization type, sample preparation, and biofluid. J Am Soc Mass Spectrom 14: 1290-1294.
- Little JL, Wempe MF, Buchanan CM (2006) Liquid chromatography-mass spectrometry/mass spectrometry method development for drug metabolism studies: Examining lipid matrix ionization effects in plasma. J Chromatogr B Analyt Technol Biomed Life Sci 833: 219-230.
- Sojo LE, Lum G, Chee P (2003) Internal standard signal suppression by co-eluting analyte in isotope dilution LC-ESI-MS. Analyst 128: 51-54.
- Tong XS, Wang J, Zheng S, Pivnichny JV, Griffin PR, et al. (2002) Effect of signal interference from dosing excipients on pharmacokinetic screening of drug candidates by liquid chromatography/mass spectrometry. Anal Chem 74: 6305-6313.
- Shou WZ, Naidong W (2003) Post-column infusion study of the 'dosing vehicle effect' in the liquid chromatography/tandem mass spectrometric analysis of discovery pharmacokinetic samples. Rapid Commun Mass Spectrom 17: 589-597.
- Schuhmacher J, Zimmer D, Tesche F, Pickard V (2003) Matrix effects during analysis of plasma samples by electrospray and atmospheric pressure chemical ionization mass spectrometry: practical approaches to their elimination. Rapid Commun Mass Spectrom 17: 1950-1957.
- Mallet CR, Lu Z, Mazzeo JR (2004) A study of ion suppression effects in electrospray ionization from mobile phase additives and solid-phase extracts. Rapid Commun Mass Spectrom 18: 49-58.
- Mei H, Hsieh Y, Nardo C, Xu X, Wang S, et al. (2003) Investigation of matrix effects in bioanalytical high-performance liquid chromatography/tandem mass spectrometric assays: application to drug discovery. Rapid Commun Mass Spectrom 17: 97-103.
- Weaver R, Riley RJ (2006) Identification and reduction of ion suppression effects on pharmacokinetic parameters by polyethylene glycol 400. Rapid Commun Mass Spectrom 20: 2559-2564.
- Gao L, Li J, Kasserra C, Song Q, Arjomand A, et al. (2011) Precision and accuracy in the quantitative analysis of biological samples by accelerator mass spectrometry: application in microdose absolute bioavailability studies. Anal Chem 83: 5607-5616.
- Mortier KA, Verstraete AG, Zhang GF, Lambert WE (2004) Enhanced method performance due to a shorter chromatographic run-time in a liquid chromatography-tandem mass spectrometry assay for paclitaxel. J Chromatogr A 1041: 235-238.
- Mortier KA, Renard V, Verstraete AG, Van Gussem A, Van Belle S, et al. (2005) Development and validation of a liquid chromatography-tandem mass spectrometry assay for the quantification of docetaxel and paclitaxel in human plasma and oral fluid. Anal Chem 77: 4677-4683.
- Chambers E, Wagrowski-Diehl DM, Lu Z, Mazzeo JR (2007) Systematic and comprehensive strategy for reducing matrix effects in LC/MS/MS analyses. J Chromatogr B Analyt Technol Biomed Life Sci 852: 22-34.
- King R, Bonfiglio R, Fernandez-Metzler C, Miller-Stein C, Olah T (2000) Mechanistic investigation of ionization suppression in electrospray ionization. J Am Soc Mass Spectrom 11: 942-950.
- Bonfiglio R, King RC, Olah TV, Merkle K (1999) The effects of sample preparation methods on the variability of the electrospray ionization response for model drug compounds. Rapid Commun Mass Spectrom 13: 1175-1185.
- Neervannan S (2006) Preclinical formulations for discovery and toxicology: physicochemical challenges. Expert Opin Drug Metab Toxicol 2: 715-731.
- Sheftel VO (2000) Indirect food additives and polymers: Migration and Toxicology. Lewis Publishers, 1114-1116.
- Kwon Y (2002) Pharmacokinetic study design and data interpretation. Kluwer Academic Publishers, New York, 3-28.
- Agilent solutions guide (1999) Polymer and hydrocarbon processing solutions with HPLC. 5968-7020E.
- Nasioudis A, van Velde JW, Heeren RM, van den Brink OF (2011) Detailed molecular characterization of castor oil ethoxylates by liquid chromatography multistage mass spectrometry. J Chromatogr A 1218: 7166-7172.
Relevant Topics
Recommended Journals
Article Tools
Article Usage
- Total views: 15033
- [From(publication date):
August-2013 - Mar 31, 2025] - Breakdown by view type
- HTML page views : 10416
- PDF downloads : 4617


