Research Article Open Access
HPTLC Method Validation for simultaneous determination of Tamsulosin Hydrochloride and Finasteride in Bulk and Pharmaceutical Dosage Form
Sanjay B. Bari*, Pritam S. Jain, Abdul R. Bakshi and Sanjay J. SuranaPatel Institute of Pharmaceutical Education and Research, Shirpur Dist: Dhule (M.S.) 425 405 India
- *Corresponding Author:
- Dr. S. B. Bari
R. C. Patel Institute of Pharmaceutical Education and Research
Shirpur Dist: Dhule (M.S.) 425 405 India
Tel: +91-9423918023
Fax: +91- 2563-255189
E-mail: sbbari@rediffmail.com
Received date: February 07, 2011; Accepted date: April 3, 2011; Published date: April 5, 2011
Citation: Bari SB, Jain PS, Bakshi AR, Surana SJ (2011) HPTLC Method Validation for simultaneous determination of Tamsulosin Hydrochloride and Finasteride in Bulk and Pharmaceutical Dosage Form. J Anal Bioanal Tech 2:119. doi: 10.4172/2155-9872.1000119
Copyright: ©2011 Bari SB, et al. This is an open-access article distributed under the terms of the Creative Commons Attribution License, which permits unrestricted use, distribution, and reproduction in any medium, provided the original author and source are credited.
Visit for more related articles at Journal of Analytical & Bioanalytical Techniques
Keywords
Tamsulosin hydrochloride; Finasteride; TLC/densitometry; Validation
Introduction
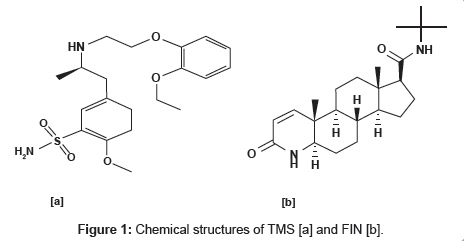
Benign Prostate Hyperplasia (BPH) is a common condition in aging men. Chemically tamsulosin hydrochloride is [(-)-(R)-5-[2- [[2-( -ethoxyphenoxy) ethyl]amino]propyl]-2-methoxybenzenesulfonamide] and is official in Martindale - The Extra Pharmacopoeia and Merck Index [1,2]. The chemical structures are shown in Figure 1, whereas chemically finasteride is N-(1,1-dimethylethyl)-3-oxo- (5α,17β)-4-azaandrost-1-ene-17-carboxamide and official in Merck Index [1,2]. The chemical structures are shown in Figure 1.
Literature survey reveals various chiral separation techniques [3-6] along with impurities [7] for tamsulosin. More over LC [8,9] coupled with MS-MS technique [10] is described for finasteride. Spectrophotometeric method [11] and simultaneous estimation for tamsulosin and dutasteride is also given [12-13].
The purpose of this work is to establish and validate a simple accurate and reproducible procedure for quantitative TLC analysis of tamsulosin hydrochloride and finasteride in bulk and tablet dosage form as per ICH guidelines [14,15].
Experimental
Chemicals and reagents
Tamsulosin hydrochloride and Finasteride was kindly gifted from Sun Pharmaceuticals, Vapi (Gujarat), India. Urimax-F tablets containing 0.4 mg of tamsulosin hydrochloride and 5 mg of finasteride were obtained from commercial sources within their shelf life period. All the reagents and solvents used were of HPLC grade.
HPTLC instrumentation
The samples were spotted in the form of bands of width 6mm with a Camag 100 ¯l sample (Hamilton, Bonaduz., Switzerland) syringe on precoated silica gel aluminium plate 60 F254 (20 cm x 10 cm with 0.2 mm thickness), supplied by Anchrom technologists, (Mumbai) using a Camag Linomat applicator 5 (Switzerland). A constant application rate of 150 nl sec-1 was employed and space between two band was 15 mm. The slit dimension was kept 6 mm x 0.45 mm. The mobile phase consisted of toluene: n-propanol: triethylamine (3.0:1.5:0.2 v/v). The optimized chamber saturation time for mobile phase was 20 min at room temp (25°C ± 2) and relative humidity 60% ± 5. The length of chromatogram run was approximately 80 mm. Subsequent to the development; TLC plates were dried in current of air with the help of an air dryer. Densitometric scanning was performed using Camag TLC scanner 3 in the absorbance mode at 260 nm and software used was winCATS 4.0.5. The source of radiation utilized was deuterium lamp emitting a continuous UV spectrum in the range of 190 - 400 nm.
Preparation of standard solutions for linearity studies
An accurately weighed quantity of 10 mg TAM and 50 mg of FIN were transferred to two different 10 ml volumetric flasks, dissolved in methanol and volume was made up to mark with the same solvent to obtain concentration 1000 ng/µl of Tam and 5000 ng/µl of FIN respectively. From these solutions 2 ml stock solution of TAM and FIN was transferred to 10 ml volumetric flask and made up to mark. Aliquots of standard solutions 1, 2, 3, 4, 5 and 6µl of TMS and FIN were applied on TLC plate with the help of microlitre syringe, using Linomat 5 sample applicator to obtained the concentration of 200, 400, 600, 800, 1000 and 1200 ng per spot of TMS and 1000, 2000, 3000, 4000, 5000 and 6000 ng per spot of FIN respectively.
Method validation
Accurately weighed 10 mg of TMS and 50 mg of FIN were transferred to 10 ml volumetric flask, dissolved in methanol and volume was adjusted to mark. This mix standard solution was used for validation study.
Precision: Repeatability of measurement of peak area was determined by spotting 400 ng/spot of TMS and 2000 ng/spot of FIN. Precision of the method was assessed by intra-day and inter-day variations. Intra-day variations were assessed by spotting 400, 600, 800 ng/spot of TMS and 2000, 3000, 4000 ng/spot of TMS on TLC plate on three different times within the same day. Inter-day variations were performed by analyzing same concentrations described above for TMS and FIN in three different days over a period of week.
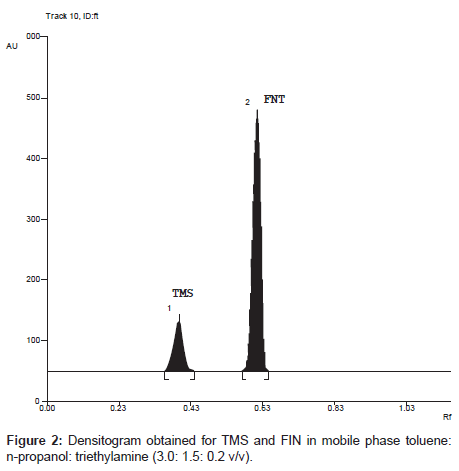
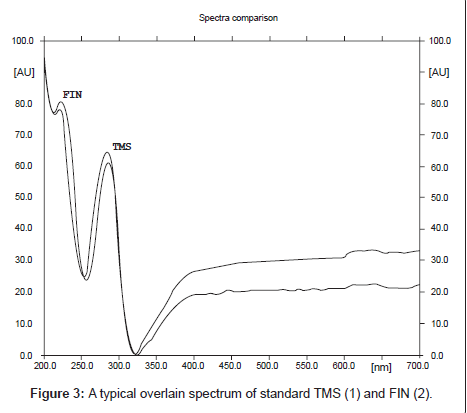
Specificity: Specificity of the method was ascertained by analyzing standard drug and sample. The mobile phase resolved both the drugs very efficiently, as shown in Figure 2. The spot for TMS and FIN was confirmed by comparing the RF and spectra of the spot with that of standard. A typical absorption overlain spectrum of TMS and FIN shown in Figure 3; wavelength 260 nm was selected for densitometric scanning. Peak purity of TMS and FIN was assessed by comparing the spectra of sample with that of standard at three different levels, i.e., peak start (S), peak apex (M) and peak end (E) positions.
Accuracy: The pre-analyzed samples were over spotted with extra 80, 100 and 120 % of the standard drug solution of TMS and FIN on TLC plate. The total concentrations of the drugs were determined. The experiment was conducted in triplicate. This was done to check for the recovery of the drug at different levels in formulation.
Robustness: Robustness of the method was performed by spotting 400 ng of TMS and 2000 ng of FIN on TLC plate by making small deliberate changes in chromatographic conditions. Mobile phases having different composition like toluene: n-propane: triethylamine (3.5: 1: 0.2 v/v/v) and toluene: n-propane: triethylamine (3.0: 1.5: 0.2 v/v/v) were tried and chromatograms were run. The development distance was varied from 7, 7.5 and 8 cm. The amount of mobile phase (4.7 and 9.4) was tried and chromatograms were run. Temperature and relative humidity was varied in the range of ± 5%. The plates were prewashed by methanol and activated at 60 ± 5oC for 2, 5 and 7 min prior to chromatography. Duration of saturation time of chamber was varied as 15, 20 and 25 min. Time from spotting to chromatography and time from chromatography to scanning was varied from 0, 20, 40 and 60 min. Robustness of the method was done at three different concentration levels.
Ruggedness: Ruggedness of the method was performed by spotting 400 ng of TMS and 2000 ng of FIN, respectively by two different analyst keeping same experimental and environmental conditions.
Limit of detection (LOD) and limit of quantification (LOQ): In order to determine detection and quantification limit, concentrations in the lower part of the linear range of the calibration curve were used. Stock solutions of TMS (1000 µg/ml) and FIN (5000 µg/ml) were prepared separately and different concentrations 200, 240, 280, 320, 360 and 400 ng of TMS and 1000,1200, 1400, 1600, 1800 and 2000 of FIN were separately spotted on TLC plates in triplicate. The LOQ and LOD were calculated using equation LOD = 3.3 x N/B and LOQ = 10 x N/B, where, N is standard deviation of the peak areas of the drugs (n=3), taken as a measure of noise, and B is the slope of the corresponding calibration curve.
Application of proposed method to tablet formulation
Twenty tablets were weighed; average weight determined and crushed in to fine powder. An accurately weighed tablet powder equivalent to 4 mg of tamsulosin hydrochloride and 50 mg of finasteride was transferred into 25 ml volumetric flask containing 15 ml methanol, an accurately weighed quantity of standard tamsulosin hydrochloride (6mg) was added to obtain the proportion of 1:5 for TMS and Fin respectively. The solution was sonicated for 10 min and volume was made up to mark with same solvent. The resulting solution was filtered using 0.41 µm filter (Millifilter, Milford, MA). The appropriate volume i.e. 5 µl containing 400 ng of TMS and 2000 ng of FIN was spotted on TLC plate.
Results and Discussion
HPTLC method development and validation
The TLC procedure was optimized with a view to develop method for simultaneous determination of TMS and FIN. The mobile phase toluene: n-propanol: triethylamine 3.0: 1.5: 0.2 (v/v) gave good resolution, sharp and symmetrical peak with RF value of 0.35 for TMS and 0.60 for FIN. It was observed that prewashing of TLC plates with methanol (followed by drying and activation) and pre-saturation of TLC chamber with mobile phase for 20 min ensure good reproducibility and peak shape of both the drugs.
Validation
Linearity: The linear regression data for the calibration curves showed good linear relationship over the concentration range 200 - 1200 ng/spot for TMS and 1000 - 6000 ng/spot for FIN. Linear regression equation was found to be Y = 1.0937 X + 32.884 (r2 = 0.9991) for tamsulosin hydrochloride and Y = 0.4696 X + 274.89 (r2 = 0.9987) for finasteride.
Precision: The precision of the developed HPTLC method was expressed in terms of % relative standard deviation (% R.S.D.). The results depicted revealed high precision of the method is presented in Table 1.
| Drugs | Conc. ng/ml |
Intra-day | Inter-day | ||
|---|---|---|---|---|---|
| % Amount found* | % R.S. D. | % Amount found * | % R.S.D | ||
| TMS | 400 | 101.19 | 1.70 | 101.34 | 1.68 |
| 600 | 99.02 | 1.04 | 99.02 | 0.80 | |
| 800 | 101.76 | 1.10 | 101.42 | 0.65 | |
| FIN | 2000 | 99.94 | 0.68 | 101.10 | 1.02 |
| 3000 | 99.14 | 0.41 | 100.20 | 0.58 | |
| 4000 | 99.48 | 0.45 | 99.78 | 0.59 | |
* mean of three estimations
Table 1: Intra-day and inter-day precision of HPTLC method.
LOD and LOQ: Detection limit and quantification limit was calculated by the method as described in Specificity. The LOQ and LOD for TMS were 52.94 ng and 17.47 and for FIN, LOQ and LOD were found to be 187.39 ng and 61.98 ng. This indicates that adequate sensitivity of the method.
Accuracy: The proposed method when used for extraction and subsequent estimation of both the drug from pharmaceutical dosage forms after over spotting with 80, 100 and 120 % of additional drug; afforded recovery of 98 - 102 % as listed in Table 2.
| Drugs | Label claim (mg/tablet) | Amount of standard drug added (%) | % Drug | % R.S.D. |
|---|---|---|---|---|
| TMS | 0.4 | 0 | 100.02 | 1.43 |
| 80 | 99.74 | 0.84 | ||
| 100 | 99.32 | 1.28 | ||
| 120 | 100.03 | 1.35 | ||
| FIN | 5 | 0 | 99.93 | 1.46 |
| 80 | 99.72 | 0.88 | ||
| 100 | 99.36 | 0.97 | ||
| 120 | 99.99 | 0.60 |
* mean of three estimations at each level
Table 2: Results of recovery studies*.
Robustness: The standard deviation of peak areas was calculated for each parameter and % R.S.D. was found to be less than 2 %.
Ruggedness of the method: Ruggedness of the method was performed by applying 400 ng and 2000 ng for TMS and FIN, respectively by two different analyst keeping same experimental and environmental conditions. The results summarized in Table 3.
| Parameter | TMS | FIN |
|---|---|---|
| Linearity range (ng/ spot) | 200 – 1200 | 1000 – 6000 |
| Correlation coefficient | 0.9991 | 0.9987 |
| Limit of detection (ng/spot) | 17.47006 | 61.98041 |
| Limit of quantitation (ng/spot) | 52.93956 | 187.3935 |
| % Recovery (n = 9) | 99.77 | 99.75 |
| Ruggedness (% R.S.D.) | ||
| Analyst I ( n = 3) | 1.19 | 0.95 |
| Analyst II ( n =3) | 0.71 | 0.71 |
| Precision (%R.S.D.) | ||
| Repeatability of application (n = 6) | 1.04 | 0.73 |
| Intra-day (n = 3) | 0.65 – 1.86 | 0.41 -0.68 |
| Inter-day (n = 3) | 1.04 – 1.70 | 0.58 – 1.02 |
| Robustness | Robust | Robust |
| Specificity | Specific | Specific |
Table 3: Summary of validation parameter.
Conclusion
The developed HPTLC method is simple, precise, accurate and reproducible and can be used for simultaneous determination of TMS and FIN in tablets. The method was validated as per ICH guidelines.
References
- Martindale (1989) Council of Royal Pharmaceutical Society of Great Britain. The Extra Pharmacopoeia 29th Ed.
- Budavari S (1996) The Merck Index, 14th Ed. Merck and Co. Inc., White House station, NJ.
- Maier V, Horakova J, Petr J, Tesarov E, Coufal, et al. (2005) Chiral separation of tamsulosin by capillary electrophoresis. J of Pharma Biomed Anal 39: 691-696.
- Zhang Z, Yang G, Liang G, Liu H, Chen Y (2004) Chiral separation of Tamsulosin isomers by HPLC using cellulose Tris (3,5-dimethhylphenylcarbamate) as a chiral stationary phase. J of Pharma Biomed Anal 34: 689-693.
- Qi M, Wang P, Cong R (2004) Determination of the Enantiomers of Tamsulosin Hydrochloride and its Synthetic Intermediates by Chiral Liquid Chromatography. Chromatographia 59: 251- 254.
- Macek J (2001) Separation of finasteride and analogues. J Chromatogr B 764: 207-215.
- Chandorkar JG, Kotwal VB, Dhande NS, Gurav SG, Pande VV, et al. (2008) J Pharm Sci 21: 136-149.
- J. G. Chandorkar, V. B. Kotwal, N. S. Dhande, S. G. Gurav, V. V. Pande (2008) A sensitive HPLC method for simultaneous estimation of tamsulosin hydrochlo-ride and its impurity. J. Pharm. Sci. 21: 307.
- Akheel AS, Mungalimane, Amshumali K (2001) J of Pharma Biomed. Anal 25: 1015.
- Demir H, Cucu A, Sakarya S (2006) Optimization of a microwave-assisted extraction large-volume injection and gas chromatography-ion trap mass spectrometry procedure for the determination of polybrominated diphenyl ethers, polybrominated biphenyls and polychlorinated naphthalenes in sediments. Analytica Chimica Acta, 557: 304-313.
- Rao RN, MVN Kumar Talluri, Raju AN, Shinde DD, et al. (2008) Development and Validation of Stability-Indicating HPTLC Determination of Tamsulosin in Bulk and Pharmaceutical Dosage Form. J of Pharma Biomed Analysis 46: 94-103.
- Ulu ST (2007) A new spectrophotometric method for the determination of finasteride in tablets. Spectrochimica Acta Part A 67: 778-783.
- Agarwal S, Gowda1 KV, Sarkar AK, Ghosh D, Bhaumik U et al. (2008) A new spectrophotometric method for the determination of finasteride in tablets. Chromatographia 67: 778-783.
- Patel DB, Patel NJ (2010) Validated RP-HPLC and TLC methods for simultaneous estimation of tamsulosin hydrochloride and finasteride in combined dosage forms Acta Pharm. 60: 197-205.
- ICH-Guidelines Q2A (1995) Validation of Analytical Procedures: Definition and terminology (CPMP III/5626/94) Geneva, Switzerland March.
- ICH-Guidelines Q2B (1996) Validation of Analytical Procedures: Methodology (CPMP/ICH/281/95) Geneva, Switzerland November.
Relevant Topics
Recommended Journals
Article Tools
Article Usage
- Total views: 89900
- [From(publication date):
April-2011 - Nov 18, 2025] - Breakdown by view type
- HTML page views : 85037
- PDF downloads : 4863


