Review Article Open Access
High Frequency Scanning Acoustic Microscopy as Diagnostic Tool in Tissue Science
Xiaoning Xi, Xin Li, Miyasaka C, Kropf M and Tittmann BR*Faculty of Acoustic Program, Pennsylvania State University, USA
- Corresponding Author:
- Tittmann BR
Faculty of Acoustic Program
Pennsylvania State University, USA
Tel: (814) 865-7827
E-mail: BRTESM@engr.psu.edu
Received date: May 15, 2013; Accepted date: June 17, 2013; Published date: June 22, 2013
Citation: Xi X, Li X, Miyasaka C, Kropf M, Tittmann BR (2013) High Frequency Scanning Acoustic Microscopy as Diagnostic Tool in Tissue Science. J Biotechnol Biomater 3:160. doi:10.4172/2155-952X.1000160
Copyright: © 2013 Xi X, et al. This is an open-access article distributed under the terms of the Creative Commons Attribution License, which permits unrestricted use, distribution, and reproduction in any medium, provided the original author and source are credited.
Visit for more related articles at Journal of Biotechnology & Biomaterials
Abstract
The objective of this paper is to demonstrate the feasibility of High Frequency Scanning Acoustic Microscopy (HF SAM) as a tool to characterize biological tissues. The HF SAM is shown to provide both imaging and quantitative stiffness measuring abilities. The plant cell wall is used as a test analog to study the influence on stiffness when one important structural component is removed from a complex polymer structure. In particular, the hypothesis of this work was that the biopolymer pectin may have a strong effect on the mechanical properties of primary plant cell walls. The technical approach was to use HF SAM to document the effect of pectinase enzyme treatment to remove pectin from onion primary cell wall. The novelty in this work was to demonstrate the capability of HF SAM in terms of a characteristic curve called the V(Z) signature. The results indicate a significant change in the V(Z) signature with time into the enzyme treatment. Thus the HF SAM method opens the door to a systematically nondestructive study of complex bio-polymer structures.
Background
High frequency scanning acoustic microscopy (HF SAM)
In contrast to Scanning Electron Microscopy (SEM), Optical or Scanning Laser Confocal Microscopy (SLCM), high frequency scanning acoustic microscopy (HF SAM) is capable of imaging not only the surface but also the shallow subsurface regions of materials with high resolution [1-9]. For example, at 500 MHz the resolution in water at Standard Temperature and Pressure is about 1.5 um. For the focus below the surface of a biological specimen the resolution is approximately 2 micron depending on the acoustical properties of the specimen. Imaging bonds between dissimilar polymers is a challenging task since the image contrast must be based on at least two mechanisms: (1) the contrast resulting from the dissimilar acoustic impedances of the different polymers and (2) the contrast due to absorption of acoustic waves in the material. Conventional acoustic microscopy typically operates in the 20 MHz to 200 MHz range with the use of focused transducers operating in the pulse wave mode. By contrast, HF SAM operates in the 0.4 GHz to 2 GHz range in the long tone burst mode which allows correspondingly much higher resolution [5]. More importantly, the high numerical aperture lens when brought close to the surface produces leaky surface acoustic waves which are sensitive to the presence of changes in structure and materials and mark them in high intensity contrast. This paper provides a description of the HF SAM and a review of the technique’s contrast mechanism and associated simulations involved in data analysis as it is applied to the mechanical characterization of plant cell walls subjected to enzymatic removal of pectin.
Description of HF-SAM system and the high numerical aperture lenses
The HF SAM uses a mechanically scanning, acoustic lens system operating in a pulse-echo reflection mode. The system used in this study is model UH3 built by Olympus Corp. The Scanning acoustic microscope provides a non-destructive method for studying the surface/ subsurface microstructure of nontransparent solids or biological materials. In scanning acoustic microscopy, a sample is examined by ultrasound waves, and the variation of wave propagation generates the contrast maps which are used to form the resulting image. Mechanical wave propagation and scattering is affected by the structure and elastic properties of the sample.
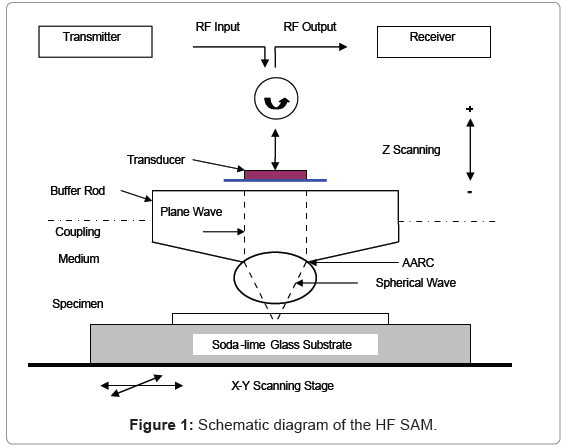
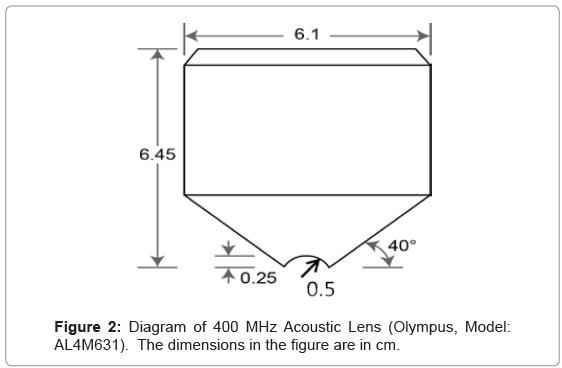
The working principle of the HF SAM can be described as below: As shown in Figure 1, a transmitter generates an electric signal (usually a tone burst waveform) which travels into a piezoelectric transducer located on the top of a sapphire buffer rod. A circulator limits the signal transmission to one direction: from the transmitter to the transducer or from the transducer to the receiver. The piezoelectric transducer is applied for the electro-acoustic conversion for the transmitter and receiver. The outgoing electric signal is converted to an acoustic plane wave by the transducer operating in transmission mode, and this plane wave is focused into an ultrasonic beam by a spherical or cylindrical lens at the end of the buffer rod. The ultrasonic beam is then transmitted through the fluid buffer, usually de-ionized water, into the sample. The wave travels through the sample at the material’s velocity; part of the signal is reflected by the sample and travels back through the lens. The transducer, now in receiving mode, converts the reflected ultrasonic signal into an electrical signal which is collected by the receiver. The returning signal’s amplitude or phase is recorded and modulated on a monitor to show the image of the focal area. Variations in the mechanical properties elicit changes in wave propagation which affect the amplitude and phase of the reflected signal from the sample forming the contrast for features on the grey-scale image. The operating frequencies of HF SAMs are between 400 MHz and 1 GHz with most at 400 MHz. Higher frequency lenses provide more accurate measurement results with a resolution of up to 1 μm at a depth of 10 μm. 600MHz was found to give optimum results for imaging. For the V(Z) measurement the choice of 400 MHz as the operating frequency was based on experience and a practical compromise between resolution and depth of penetration of the waves into the specimen. The parameters of the acoustic lens are shown in below in Figure 2. The specimen is located in a container filled with coupling medium. The temperature of the coupling medium (i.e., distilled water) is monitored by a thermocouple. The temperature is stabilized at 20.0°C (change less than ± 0.1°C) in our experiments.
Background of Plant Cell Wall Structure
Plant cells are bounded by thin, yet mechanically strong cell walls containing structural proteins, enzymes, phenolic polymers, and other materials which transform their chemical and physical characteristics [10]. The structure consists of three different layers: the middle lamella, the primary cell wall, and plasma membrane. The middle lamella (plural lamellae) is a layer high in pectin, which forms the interface between adjacent plant cells and glues them together [11]. Primary plant cell walls are polysaccharide-rich complex structures. Primary wall contains three main components: cellulose, hemicelluloses and pectin. Cellulose microfibrils are embedded in a highly hydrated polysaccharide matrix which consists of hemicelluloses and pectin. Cellulose is a polysaccharide consisting of a linear chain of several hundred to more than 10,000 d-glucose units linked by β-1,4 bonds. Cellulose comprise of many parallel chains of 1,4-glucan which make cellulose crystalline, strong and indigestible. Cellulose microfibrils serves as reinforcement material of cell wall composite. Cellulose microfibrils are about 5 nm in thickness and have indefinite length. Hemicellulose is also a polysaccharide, but it is typically made up of chains of xylose interspersed with side chains containing arabinose, galactose, mannose, glucose, acetyl, and other sugar groups, depending on plant type. Hemicelluloses separate microfibrils from each other but may tether them together into a cohesive network. Pectin is a gel phase that embeds the cellulose-hemicelluloses network. Pectin includes relatively simple polysaccharides and becomes soluble with mild treatments such as boiling water or mildly acidic solutions [12].
Sample Preparation
This study focuses on the primary cell wall of onion and celery epidermis as specimens. Typically, the plant epidermis was bathed in 1x PBS (Phosphate Buffered Saline) solution with 0.05% Tween 20 for 1 hour. The edges of the sample were glued to a clean, glass slide while the internal part remained intact and free.
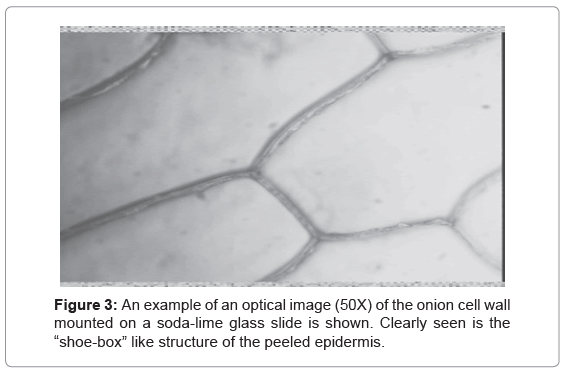
Figure 3 shows an example of an optical image (50x) of the onion cell wall mounted on a soda-lime glass slide. A characteristic feature of both onion and celery epidermis is the “shoe-box” -like structure of the peeled epidermis.
HF SAM Imaging
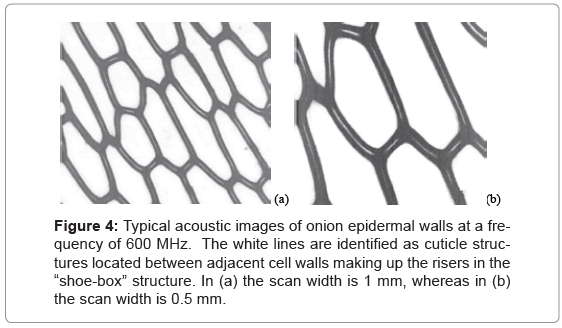
Fresh onion epidermis were laid smoothly on a clean (100) silicon wafer with edges glued. The samples were dipped into 1xphosphate buffered saline (pH 7.4) containing 0.1% Tween 20 for 1 hour and then rinsed with water. During experiments, water was used as the buffer liquid so the samples were kept hydrated. Acoustic images, such as those shown in Figure 4, were obtained first. In Figure 4 are displayed typical HF SAM images of onion epidermal walls at a frequency of f= 600 MHz and at two different scales. The white lines in (a) are identified as cuticle structures located between adjacent cell walls making up the risers in the “shoe-box” structure.
V(Z) measurement with HF SAM of Plant Cell wall
In addition to contrast variations provided by elastic properties of materials, another important usage of high frequency HF SAM is measuring the velocity of surface acoustic waves. Atalar, Quate, and Wickramasinghe established that the amplitude of the output voltage V as a function of lens-to-sample distance z has “a characteristic response that is dependent upon the elastic properties of the reflecting surface” [13]. Later Weglein reported the periodicity of dips in the V(Z) curves [14]. The periodicity of the V(Z) curve was related to surface wave propagation. Parmon and Bertoni [15] proposed a simple formula for determining the SAW velocity from V(Z) curves measurement using a ray model. Wave velocity in the sample derived from the V(Z) curve can be calculated according to Atalar’s model [16].
Following well-known procedures to obtain, measure, and interpret V(Z) curves [17-20], the longitudinal wave velocities were obtained by implementing a computer parameter-fitting technique. The algorithm of the V(Z) curve simulation is described in the following steps. First, initialize parameters of acoustic lens, specimen (thinly sectioned biological tissue), and soda-lime substrate. Second, calculate parameters of acoustic field at the back focal plane, pupil function of the lens, and reflectance function. Third, calculate and draw the V(Z) curve. In the simulation, parameters of the acoustic lens are shown in Table 1.
| Transducer Material: Zinc Oxide Center Frequency (i.e., F): 400MHz Radius: 383.00 μm The Distance from the Transducer Plane (i.e., Plane 0) from the Back Focal Plane (i.e., ZL): 6,122.00 μm |
| Buffer Rod Material: Sapphire (C-cut) Longitudinal Wave Velocity (i.e., VL): 11,175.0 m/sec Shear Wave Velocity (i.e., VS): 6,950.0 m/sec Density: 3.98 kg/m3 |
| Lens Aperture Angle: 120° Curvature of the Radius: 577.52 μm Focal Distance (i.e., f): 577.52 μm |
| Matching Layer Material: Silicon Oxide (i.e., SiO2) Longitudinal Wave Velocity (i.e., AARCL): 5,970.0 m/sec Shear Wave Velocity (i.e., AARCS): 3,760.0 m/sec Density: 2.20 kg/m3 |
Table 1: Parameters of AL4M350 Acoustic Lens.
The velocity of the longitudinal wave velocity of water was set as 1,487 m/s. Based on the previous research study [21], the speed of sound in most plant cells is quite constant and close to that of water, with ultrasound velocities are in the range of about 1600 m/s.
Therefore the longitudinal velocity of the tissue (thickness: 8 μm) was set to a range from 1540 m/s to 1650 m/s. Moreover, the plant cell wall density is set within a range of 1.3-1.6 (103 kg m-3) [21]. A Soda-lime glass slide was chosen as the substrate, its velocities of longitudinal and shear waves are 6,000 m/s and 3200 m/s respectively. The summarized physical parameters of biological tissue for computer simulation are shown in Table 2.
| Lens | AL4M350 |
| Liquid | De-ionized Water |
| Temperature of Water | 20°C |
| Substrate | soda-lime glass |
| Radius of Lens | 577.52 μm |
| Wave Length in Water | 3.725 μm |
| Longitudinal Wave Velocity of Tissue | 1540-1650 m/s |
| Density of Tissue | 1.4 g/cm3 |
| Thickness of Tissue | 5.00-8.00 μm |
Table 2: Parameters of Experimental conditions and Biological Tissue.
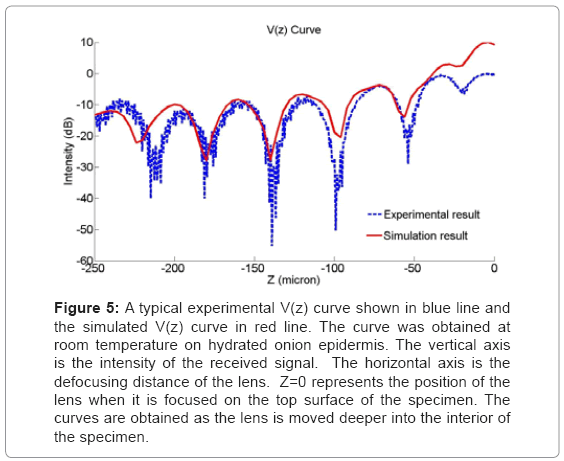
Changing the values of the longitudinal wave velocity and the thickness, the simulations were continued until the periodicities in the interference pattern were nearly coincident with the experimental values. Figure 5 shows a typical experimental Vz curve generated on an onion epidermal wall, as well as the matching curve from simulation. The vertical axis is the intensity of the received signal. The horizontal axis is the defocusing distance of the lens. Z=0 represents the position of the lens when it is focused on the top surface of the specimen. The curves are obtained as the lens is moved deeper and toward the interior of the specimen. The longitudinal wave velocity in epidermal wall was calculated as 1628 m/s. Ten curves were measured in different positions along the sample surface. The wave velocity resulting from simulation was found to be 1626 ± 3 m/s.
Figure 5: A typical experimental V(z) curve shown in blue line and the simulated V(z) curve in red line. The curve was obtained at room temperature on hydrated onion epidermis. The vertical axis is the intensity of the received signal. The horizontal axis is the defocusing distance of the lens. Z=0 represents the position of the lens when it is focused on the top surface of the specimen. The curves are obtained as the lens is moved deeper into the interior of the specimen.
The sample material longitudinal velocity VL is related to the elastic modulus with the relationships below:
 (1)
(1)
Where, V is the longitudinal wave velocity in the sample, K is the sample material bulk modulus which is related to the Young’s modulus E by:
 (2)
(2)
where ν is the material Poisson ratio. Then the elastic modulus E can be presented as
 (3)
(3)
According to Equation (3), the elastic modulus E could be calculated as
E=3.30 GPa. (4)
Using a standard assumed value for Poisson’s ratio and density, respectively, of ν=0.3 and ρ=1.4 g/cm3.
Those values are in approximate agreement with the modulus values and densities referred to in the literature [21]. UF SAM measures elastic properties at the macroscopic level. The macroscopic properties incorporate the mechanical composition of a sample over a distance proportionally large in comparison with the dimension of cellulose microfibrils and bundles. The V(Z) measurement is therefore, potentially more sensitive to visco-elasticity of the plant cell wall as a composite as compared to for example AFM techniques. AFM techniques do have the ability to measure the viscoelastic response of a single microfiber embedded in the plant cell wall matrix, however, the loss of the leaky surface acoustic wave resulting from a V(Z) measurement over millimeters of the surface of a sample is significantly more apparent.
Enzyme Treatment
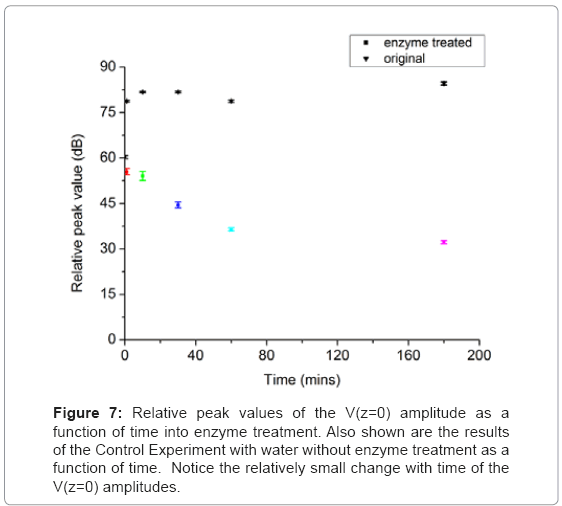
The V(Z) curve was also used to study the influence to the mechanical properties of the plant cell wall by using pectinase to remove the biopolymer pectin, which is one of the important structural components of a plant cell wall. Ten to twenty units of Pectinase were mixed with 1mL of NaOAc buffer and 100 to 150 microliters of the mixed liquid was applied to the prepared onion abaxial epidermis sample during the experiment. The V(Z) measurements were taken before the enzyme treatment, directly after the enzyme was applied, and at elapsed increments of 10, 30, 60, and 180 minutes after the enzyme was applied. Figure 6 shows the V(Z) curves of onion skin under the enzyme treatment. The gradual decrease of the amplitude at z=0 is obvious as a function of time, which means that less acoustic energy is reflected back to the transducer from the sample surface. Under the action of the enzyme, the biopolymer pectin was moved away from the cell wall, which changed the cell wall structurally. More acoustic energy was absorbed by the cell wall loosened by the removal of the supporting pectin. To illustrate the peak amplitude change more clearly, Figure 7 shows the relative peak value of the V(Z) curve at z=0 of as a function of time under enzyme treatment.
The control experiment was undertaken to compare with the enzyme treatment experiment. All the steps and measurements were the same except instead of using enzyme, water was applied. Figure 7 shows the measured V(Z) curves of onion skin with water without enzyme results of treatment. It shows that the peak amplitude at z=0 of different times remain at a static value with small amount of variation. This means the structure and mechanics of the cell wall remained unchanged during the experiment.
Discussion and Conclusions
The objective of this paper was to demonstrate the feasibility of High Frequency Scanning Acoustic Microscopy (HF SAM) as a biotechnological tool to characterize biological tissues, in particular primary plant cell wall tissues.
Currently, there is interest in the structure of cellulose micro-fibrils in primary cell walls from Celery collenchyma [22]. A combination of x-ray and neutron scattering methods with vibrational and nuclear magnetic resonance spectroscopy were found useful in the elucidation of many details on the micro-fibril structure. These observations were obtained with a dry primary wall structure. In contrast, the approach using the HF SAM was shown to provide both imaging capability and quantitative measurements of stiffness in the natural wet state of plant cell walls.
The plant cell wall was used as a test analog to demonstrate the influence on stiffness when one important structural component is removed from a complex polymer structure. In particular, this work tested whether the biopolymer Pectin has a strong effect on the mechanical properties of primary plant cell walls. Onion and Celery epidermis were used as examples because they are thought to contain between 50% and 60% pectin. The mechanism for the effect on the elastic wave propagation is thought to be the viscous absorption by the plant cell wall. The bio-technical approach was to use HF SAM to document the effect of pectinase enzyme treatment to remove pectin from onion primary cell wall. The novelty in this work was to demonstrate the capability of HF SAM. The results indicate a significant change in the V(Z) signature with time after enzymatic pectin removal. Thus the HF SAM method opens the door to a systematic study of complex polymer structures.
Acknowledgement
The authors gratefully acknowledge the helpful discussions with Dr. Sarah Kiemle. Authors thank Mr. Fumio Uchino (formally of Olympus Corp.) for providing the information on the lens configuration, and Dr. Tatsuro Kosaka (associate professor at Kochi Institute of Technology) for developing the V(Z) simulation software program (bio application).
The authors were partially supported as part of the Center for Lignocellulose Structure and Formation (CLSF) an Energy Frontier Research Center funded by the U.S. Department of Energy, Office of Science, Office of Basic Energy Sciences under Award Number DE-SC0001090.
References
- Petrella LI, Valle HA, Issa PR, Martins CJ, Pereira WC, et al. (2010) Study of cutaneous cell carcinomas ex vivo using ultrasound biomicroscopic images. Skin Res Technol 16: 422-427.
- Guittet C, Ossant F, Vaillant L, Berson M (1999) In vivo high-frequency ultrasonic characterization of human dermis. IEEE Trans Biomed Eng 46: 740-746.
- Nguyen TM, Couade M, Bercoff J, Tanter M (1999) Assessment of viscous and elastic properties of sub-wavelength layered soft tissues using shear wave spectroscopy: theoretical framework and in-vitro experimental validation. IEEE Trans Ultrason Ferroelectr Frequ Control. 58: 2305-15.
- Maeva E, Severin F, Miyasaka C, Tittmann BR, Maev RG (2009) Acoustic imaging of thick biological tissue. IEEE Trans Ultrason Ferroelectr Freq Control 56: 1352-1358.
- Johnston RN, Atalar A, Heiserman J, Jipson V, Quate CF (1979) Acoustic microscopy: resolution of subcellular detail. Proc Natl Acad Sci U S A 76: 3325-3329.
- Tittmann BR, Miyasaka C, Mastro AM, Mercer RR (2007) Study of cellular adhesion with scanning acoustic microscopy. IEEE Trans Ultrason Ferroelectr Freq Control 54: 1502-1513.
- Lamarque JL, Djoukhadar A, Rodiere MJ, Attal J, Boubals E (1981) Acoustic microscopy in the study of breast tissue. Proc 1981 Ultrasonic Symposium, pp 565-567.
- Bennett SD, Ash EA (1981) Differential Imaging with the Acoustic Microscope. IEEE Trans Sonic and Ultras SU-28: 59-64.
- Kolosov OV, Levin VM, Mayev RG, Senjushkina TA (1987) The use of acoustic microscopy for biological tissue characterization. Ultrasound Med Biol 13: 477-483.
- Cosgrove DJ (1989) Characterization of long-term extension of isolated cell walls from growing cucumber hypocotyls. Planta 177: 121-130.
- Cosgrove DJ (2000) Loosening of plant cell walls by expansins. Nature 407: 321-326.
- Cosgrove DJ (2006) Cell Walls: Structure, Biogenesis, and Expansion, In Plant Physiology, 2nd ed. Lincoln Taiz and Eduardo Zeiger, eds. Sunderland, MA: Sinauer Associates, Chapter 15.
- Atalar A, Quate CF, Wickramasinge HK (1977) Phase imaging in reflection with the acoustic microscope. Appl Phys Lett 31: 791.
- Weglein RD (1979) A model for predicting acoustic materials signatures. Appl Phys Lett 34: 179-181.
- Parmon W, Bertoni HL (1979) Ray interpretation of the material signature in the acoustic microscope. Electron Lett 15: 684-684.
- Atalar (1979) A physical model for acoustic signature. J Appl Phys. 50: 8237.
- Liang K, Kino GS, Khuri-Yakub BT (1985) Material characterization by the inversion of V(z). IEEE Trans. SU-32: 213-224.
- Kushibiki J, Horii K, Chubachi N (1983) Velocity measurement of multiple leaky waves on germanium by line-focus-beam acoustic microscope using FFT. Electron Lett 19: 404-405.
- Sasaki Y, Endo T, Yamagishi T, Sakai M (1992) Thickness measurement of a thin-film layer on an anisotropic substrate by phase-sensitive acoustic microscope. IEEE Trans Ultrason Ferroelectr Freq Control 39: 638-642.
- Kulik A, Gremaud G, Sathish S(1989) Continuous wave reflection scanning acoustic microscope. Acoustic Imaging, Plenum Press, New York, 17: 71-78.
- Albersheim P, Darvill A, Roberts K, Sederoff R, Staehelin A (2011) Plant Cell Walls, New York, NY: Garland Science Press.
- Thomas LH, Forsyth VT, Sturcova A, Kennedy CJ, May RP, et al. (2013) Structure of cellulose microfibrils in primary cell walls from collenchyma. Plant Physiol 161: 465-476.
Relevant Topics
- Agricultural biotechnology
- Animal biotechnology
- Applied Biotechnology
- Biocatalysis
- Biofabrication
- Biomaterial implants
- Biomaterial-Based Drug Delivery Systems
- Bioprinting of Tissue Constructs
- Biotechnology applications
- Cardiovascular biomaterials
- CRISPR-Cas9 in Biotechnology
- Nano biotechnology
- Smart Biomaterials
- White/industrial biotechnology
Recommended Journals
Article Tools
Article Usage
- Total views: 16376
- [From(publication date):
August-2013 - Mar 31, 2025] - Breakdown by view type
- HTML page views : 11580
- PDF downloads : 4796

