Research Article Open Access
Haematological Studies on Broiler Chickens Fed with Different Levels of Artemia Urmiana
Aliasghar Tehrani1, Javad Javanbakht2*, Saeed Askari3, Mehdy Aghamohammad Hassan4, Amirali Solati5, Sayad Golami6 and Hamid Akbari71Department of Pathology, School of Veterinary Medicine, University of Urmia, Urmia, Iran
2Department of Pathology, School of Veterinary Medicine, University of Tehran, Tehran, Iran
3GraduateSchool of Veterinary Medicine, University of Urmia, Urmia, Iran
4Department of Clinical Science, School of Veterinary Medicine, University of Tehran, Tehran, Iran
5Department of Veterinary Medicine, Islamic Azad University, Saveh branch, Saveh, Iran
6Graduate, School of Veterinary Medicine, University of Tehran, Tehran, Iran
7Department of Clinical Science, School of Veterinary Medicine, University of Urmia, Urmia, Iran
- Corresponding Author:
- Dr. Javad Javanbakht
Department of Pathology
University of Tehran, Azadi Avenue, Iran
Tel: +989372512581
E-mail: Javadjavanbakht@ut.ac.ir
Received date: April 26, 2012; Accepted date: June 05, 2012; Published date: June 07, 2012
Citation: Tehrani A, Javanbakht J, Askari S, Hassan MA, Solati A, et al. (2012) Haematological Studies on Broiler Chickens Fed with Different Levels of Artemia urmiana. J Biotechnol Biomater 2:138. doi:10.4172/2155-952X.1000138
Copyright: © 2012 Tehrani A, et al. This is an open-access article distributed under the terms of the Creative Commons Attribution License, which permits unrestricted use, distribution, and reproduction in any medium, provided the original author and source are credited.
Visit for more related articles at Journal of Biotechnology & Biomaterials
Abstract
The present study was carried out on broilers to study the effect of Artemia Urmiana on hematological parameters for a period of 56 days (8 weeks). In this study 190 one-day old broiler chicks from Ross 308 strain were divided into five equal groups: L1, L2, L3, L4 (Test groups) and control group. The control diet contained 5% fish meal, and the other four groups contained 2.5%, 5%, 7.5%, and 10% brine shrimp. At the end of the 7th day, blood samples were collected from all the experimental groups and analyzed for the following parameters: RBC, WBC, Hb, PCV, MCV, MCH and MCHC. The blood sample collection was repeated at the end of 14th, 21th, 28th, 35th, 42th, 49th, 56th days respectively, and the blood parameters determined as well. The results demonstrated that in Artemia-fed groups the PCV, MCV, MCH, Lymphocytes and TP were more than control group, whereas Leukocytes and Heterophils were lesser than control group. However, RBC, Hb and MCHC were approximately equal to control group.
Keywords
Artemia; Blood; Parameters; Broiler; Fish meal
Introduction
Artemia or Brine shrimp is a crustacean animal, lives in over 500 tropical and subtropical regions in the World [1], and has two species as Artemia urmiana (UA) and Parthenogenetica Artemia (PA) in Iran. Such animal was reported by Gunter in 1899 [2] for the first time and named Artemia urmiana by Clark and Bowen in 1976 [3]. All stages of Artemia from cysts and newly hatched nauplii to adult Artemia are utilized as food sources in aquaculture; however, there are scarce researches regarding the Artemia usage in poultry nutrition. In study by Zareia used Artemia meal (biomass) as a substitute for fish meal in broiler diet. Some studies approved that Artemia meal could be used as a feed ingredient in poultry nutrition [4-8]. The amino acid content of Artemia has been specified in different regions [9]. Thus, the Artemia is rich of amino acids which are efficient for broiler chick diet due to high digestibility, fatty acids and amino acids compared to fish meal although it varies in every region [10,11]. Commonly, Haematological parameters measurement provides valuable information in human and animal medicine. Unfortunately, due to lack of information of such parameters, blood profile is not used widely in avian medicine [12,13]. Although there is limited information in this field, evaluation of blood profiles of broiler strains have been assessed by several studies [14-17]. Talebi et al. [18] demonstrated that a significant increase of RBC and Leukocytic parameters was observable and haematological profile in broiler chicks (except heterophils and H / L ratio). Islam et al. [19] illustrated that the amount of RBC, Hb and PCV rise along with animal growth in three studied races. Nirmalan and Robinson [20] found the amount of lymphocytes, monocytes, heterophils, eosinophils and basophiles in poultries and quails at various ages, and demonstrated that through age increase, amount of all mentioned parameters except heterophils will be increased. Several other studies have been conducted on haematological parameters in poultries such as [21-25] and etc. The aim of present study is to evaluate haematological parameters in broiler chicks fed by diet containing AU.
Materials and Methods
Chickens design
In the experiment 190 one-day old broiler chicks from 308 Ross strain evaluated, provided from Urmia Chakavak institution (one-day chick producer unit), were purchased in February 2011. These chickens transferred to the Faculty of Veterinary Medicine, Urmia University and after six or seven days, the chicks were divided into five groups randomly (40 chicks in each experimental group and 30 chicks in the control group in 19 pens, each pen containing 10 chicks, L1, L2, L3, L4 (four experimental Groups and one control group). Furthermore, chicks were located in a standard single cages wire, with same environmental conditions for eight weeks, and received vaccines in the experimental period. During the eight weeks blood samples, including 1 ml of blood in vials with 2 mg ethylene-diamine tetra-acetic acid (EDTA), were collected for haematological tests from the jugular and brachial veins [26,27].
Food ration plan
1-Starter stage 2-Grower stage 3-Finisher stage (Tables 1, 2 and 3)
| 56 | 46 | 42 | 35 | 28 | 21 | 14 | 7 | Day | Group |
|---|---|---|---|---|---|---|---|---|---|
| 11.8 ± 0.14 | 11.7 ± 0.21 | 10.6 ± 0.96 | 11.1 ± 0.63 | 10.2±1.55 | 11±0.70 | 9.8± 0.14 | 9.6 ± 1.13 | C | |
| 11.8 ± 0.14 | 11.7 ± 0.21 | 11.8 ± 0.14 | 11.2 ± 0.56 |
10.1 ± 0.07 | 10.2 ± 1.55 | 9.4 ± 0.98 | 9.4 ± 0.98 | L1 | |
| 11.6 ± 0.28 | 11.5 ± 0.35 | 11.4 ± 0.42 | 11.1 ± 0.63 | 10.4 ± 3.11 | 10.4 ± 3.11 | 10.2 ± 1.55 | 9.6 ± 1.13 | L2 | |
| 13.4 ± 1.13 | 13.4 ± 1.13 | 13.6 ± 0.98 | 11.7 ± 0.21 | 13.4 ± 1.13 | 12.2 ± 0.14 | 11.4 ± 0.42 | 9.8 ± 0.14 | L3 | |
| 12.5 ± 1.06 | 12.3 ± 1.20 | 12.3 ± 1.20 | 12.1 ± 1.48 | 11.5 ± 0.35 | 10.1 ± 1.34 | 9.6 ± 1.13 | 9.2 ± 0.56 | L4 | |
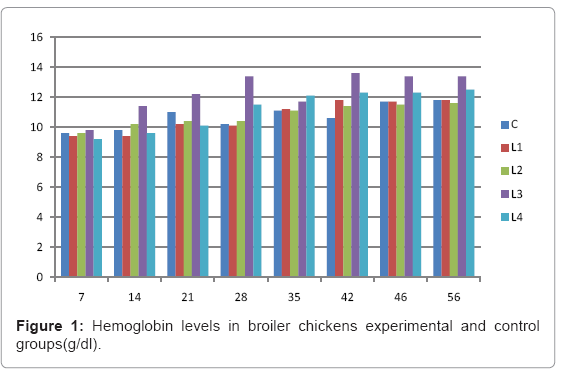
Table 1: Hemoglobin levels in broiler chickens experimental and control groups 
| 56 | 46 | 42 | 35 | 28 | 21 | 14 | 7 | Day | Group |
| 34.7± 0.91 | 43.6 ± 0.98 | 34 ± 1.41 | 33 ± 2.12 | 32.1 ± 0.07 | 31.3 ± 0.91 | 31.3 ± 0.91 | 30 ± 1.41 | C | |
| 35.3 ± 1.90 | 35.2 ± 1.97 | 35.3 ± 1.90 | 35.2± 1.97 | 34.8 ± 0.84 | 32.6 ± 0.42 | 30.8 ± 1.97 | 29.3 ± 2.33 | L1 | |
| 33.7 ± 0.21 | 33.7 ± 0.21 | 33.4 ± 0.42 | 32.5 ± 0.35 | 32.5 ± 0.35 | 32.3 ± 0.21 | 32.3± 0.21 | 29.6 ± 2.54 | L2 | |
| 34.7 ± 0.91 | 34.5 ± 7 | 34.3 ± 8.14 | 34.1" ± 1.34 | 34.1 ± 1.34 | 33.8 ± 0.14 | 33.2 ± 0.56 | 31.2 ± 0.84 | L3 | |
| 34.8 ± 0.84 | 34.6 ± 0.98 | 34.6 ± 0.98 | 34.3 ± 1.20 | 34.3 ± 1.20 | 34 ± 4.24 | 30.7 ± 1.90 | 28.8 ± 3.39 | L4 | |
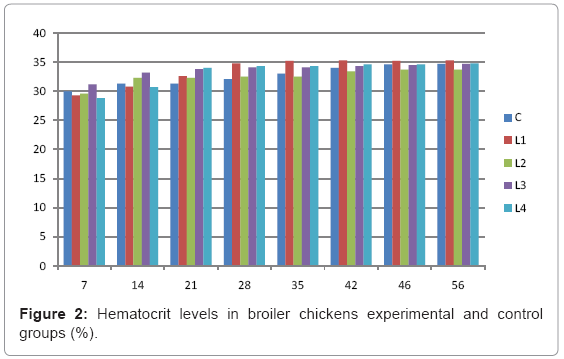
Table 2: Hematocrit levels in broiler chickens experimental and control groups (%).
| 56 | 46 | 42 | 35 | 28 | 21 | 14 | 7 | Day | Group |
| 3 ± 0.70 | 3±0.70 | 2.7±0.49 | 2.7±0.49 | 2.7±0.49 | 2.4±0.28 | 2.2±0.14 | 2.1± 0.07 | C | |
| 3.3 ± 0.49 | 2.7 ± 0.49 | 2.7 ± 0.49 | 2.5 ± 0.35 | 2.5± 0.35 | 2.4 ± 0.28 | 2.2 ± 0.14 | 2.1 ± 0.07 | L1 | |
| 2.6 ± 0.42 | 2.8 ± 0.56 | 2.8± 0.56 | 2.4 ± 0.28 | 2.6 ± 0.42 | 2.4 ± 0.28 | 2.4 ± 0.28 | 2.2 ± 0.14 | L2 | |
| 2.8 ± 0.56 | 2.6 ± 0.42 | 2.6 ± 0.42 | 2.6 ± 0.42 | 2.5 ± 0.35 | 2.4 ± 0.28 | 2.4 ± 0.28 | 2.1 ± 0.07 | L3 | |
| 3.2 ± 0.56 | 2.7 ± 0.49 | 2.6 ± 0.42 | 2.4 ± 0.28 | 2.3 ± 0.21 | 2.1 ± 0.07 | 2.1± 0.07 | 2 ± 0 | L4 | |
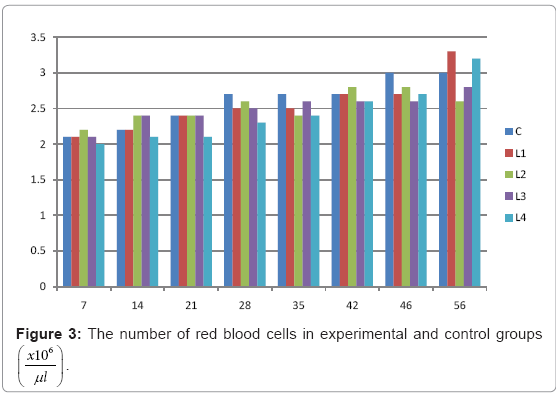
Table 3: The number of red blood cells in experimental and control groups 
sort of Artemia meal as Urmia Lake Artemia Meal (ULAM) was replaced with fish meal proteins, in experimental groups, in 4 levels of protein (2.5, 5, 7.5 and 10% respectively). The experiment was performed during 8 weeks, somehow traits relating to broiler performances measured and analyzed (Haematological parameters). Additionally, standard broiler diets had 5 percent fish meal, hence the protein amount of such fish meal were counted (Control group), and different levels of Artemia protein in one kind of Artemia including 2.5, 5, 7.5, 10 percent replaced with fish meal protein (Experimental groups). In each stage (1, 2, 3) 5 types of rationing were recorded through mentioned percentages of Artemia, and each stage elongated up to 16 days. In the first week of starter stage, the chicks consumed a usual diet without Artemia, whereas in the second week of this stage added Artemia to poultry diet. The biomass harvesting methods of Artemia urmiana was originated from by technique sorgeloos [28].
Feeding method
Obviously, sugar, powered milk, multivitamin and water were fed to chickens for the first 1-2 days. Subsequently, corn meal and water fed to the chickens solely until through one-week age. The starter rations served to L1, L2, L3, L4 and control groups after 7th day. In addition, food rations were changed in each stage, and in 6th day they divided into 19 pens. The first 4 cages named as L1 group, the second 4 cages as L2 group, the third 4 cages as L3 group, the fourth 4 cages as L4 group, and finally 3 cages as control group. Furthermore, 2.5% Artemia was added to the first group (L1), 5% Artemia to the second group (L2), 7.5% Artemia to the third group (L3), 10% Artemia to the fourth group and 0% Artemia to control group. Moreover, multivitamin powder and amino acids were prepared again and fed during breeding period, in 20th days, and the other fed in 39th days which contained vitamin A, D3, E, B2, B6, C, K3, Nicotinamide, pantothenate, and amino acids: L_Methionine, L_Cysteine and L_Lysine.
Vaccination
Two vaccines were used during this period:
1. Infectious bronchitis virus H120 vaccine strain was administered in 5th day, somehow 5 cc distilled water added to vaccine vial firstly, and 0.5 cc of prepared solution dissolved in 800cc drinking water, and the chickens were allowed to drink it upon 0.5 hours thirst.
2. Newcastle vaccine with LaSota strain (Italian oil) which was injected by automatic needle in 13th days, 0.5 cc per chicken subcutaneously to the right side of the sternum, by vaccinators.
Sampling procedures: The sampling procedure has been started since 14th day and 7th day of experimental period and feeding with Artemia respectively. Blood samples were collected in an EDTA anticoagulant in 7th day, from jugular veins using 1 ml EDTA syringe with 25 gauge needles, and repeated every 7 days.
Haematological tests: Haematological parameters such as RBC, WBC, PCV, Hb, MCV, MCH, MCHC, ESR, Total Protein, together with absolute count of heterophils, lymphocytes, monocytes, eosinophils and basophils as well as H/L ratio were determined by routine methods [29,30].
Statistical analysis: In order to analyzing data the Duncan test and SAS/STAT program were utilized for each haematological parameter between groups [31].
Results
The results demonstrated some haematological parameters such as Hb, PCV, RBC, MCV, MCH, MCHC, leukocytes, lymphocytes and total protein increased, whereas the heterophils decreased in each group. Furthermore, in Artemia-fed group PCV, MCV, MCH, lymphocytes, total protein were more than control group; however, leukocytes and heterophils were lesser than control group, and RBC, Hb, MCH were roughly equal to control group.
Importance of Artemia in poultry nutrition
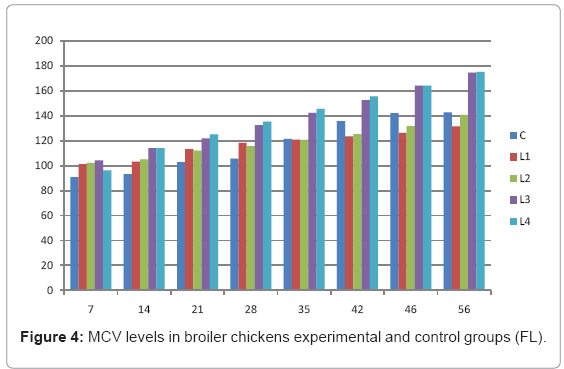
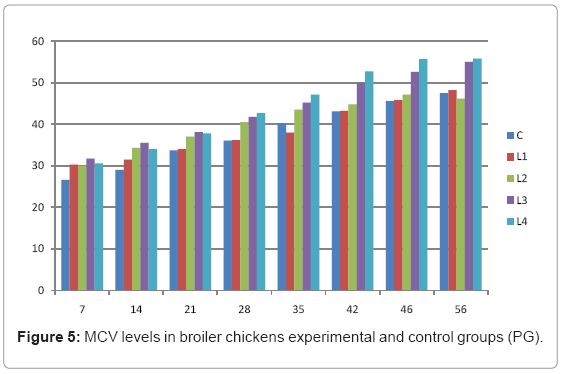
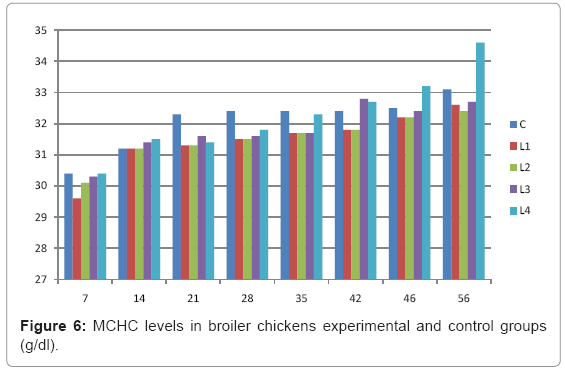
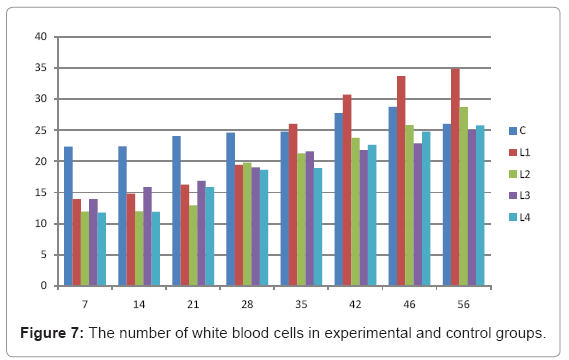
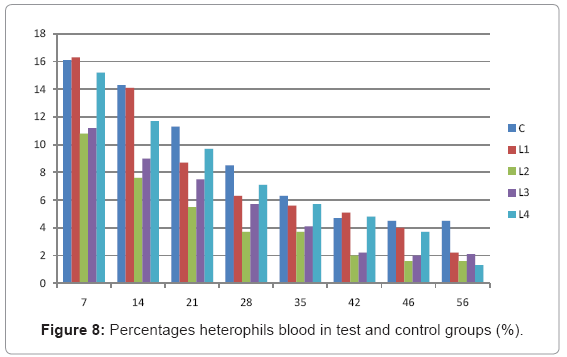
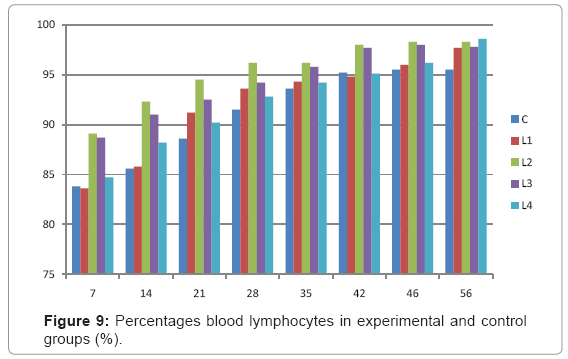
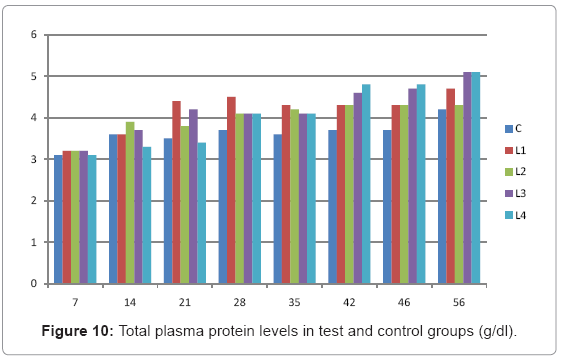
Various forms of Artemia such as decapsulated cysts, newly hatched nauplii, metanauplii and juvenile and adult, Frozen and freeze – dried Artemia, are commonly utilized for newly hatched shrimps, sturgeons, trouts, aquarium fishes and some crustaceans. The Artemia biomass is a suitable protein resource for other animals such as poultry, containing diverse stages of Artemia growth. The Artemia meal because of it has high levels of protein and high protein digestibility can be used as a feedstuff in poultry and other farm animal’s diets. Compared with other animal proteins, Artemia does not contain any feather, bone, hair or gastrointestinal tract components. In addition, in Artemia production there is no requirement for high pressure and high temperature treatments which can influence protein quality. Artificial culture of Artemia is easy and is possible everywhere [8]. Feeding role in compositions which form body is very important. As geographical situations in Iran, due to its hot and dry climatic conditions, desert regions, salt intakes and having one of the largest salt lake in the world (Urmia Lake), has a immense potential in the field of Artemia [10,32]. It is possible to convert Artemia to larvae during 24 hours. In addition, analysis showed that has a high food convertibility (more than 40%) and its dry element has six fold protein more than normal situation [10,32,33]. Matured Artemia meal has high amount of amino acid and essential fatty acids also has an excellence effect on blood parameters of birds as well as Artemia has good and high effects on poultry growth and other Artemia meal does not have fish meal shortcomings (such as smell, flavor), and it can be a suitable alternative for poultry growth from the viewpoint of protein and fatty acids [10,28,32]. Haematological values of poultry are influenced by egg, sex, bread, climate, geographical location, season, day length, and times of day, nutritional status, life habit of species, and such other physiological factors [18]. Taseer Ahmed khan and Farhat Zafar in a study showed there is not any significant difference in the field of comparing HB, ESR, and RBC in 40 & 50 days broiler chicks [34]. In the Interpretation of (table 1 and figure 1) A_ it was shown that average amount of HB in groups which were fed by Artemia was more or approximately equal to control group. B_ L3 group has maximum amount of hemoglobin average. C_ Control groups as L1 and L2 has equal amounts of HB during breeding period. D-adding Artemia to broiler poultry rationing results in raising of average amount of Hb, therefore the average amount of Hb in all of the groups which were fed by Artemia and in control group during breeding period would be an ascending process. Table 2 and figure 2 A_ groups which were fed by Artemia have higher level of PCV rather than control group. B_ PCV amount during breeding period in all of the groups has an ascending process and adding them to poultry rationing result in rising of PCV amount in that groups which were fed by Artemia rather than control group and this rising in L1, L3, and L4 groups is considerable. Table 3 and figure 3 Shows that average amount of RBC had an ascending process during breeding period in all of the groups and its amount in groups which were fed by Artemia and control group is approximately equal. Table 4 and figure 4 showed that the amount of MCV in that groups which fed by Artemia has had an ascending process rather than control group and this amount during breeding period has had an ascending process in all of these 5 groups. Table 5 and figure 5 showed that average amount of MCH in that groups which were fed by Artemia is more rather than control group and average amount of MCH has had an ascending process by increasing the amount of Artemia in rationing and has the most amount rather than L4 group. The amounts of MCV and MCH are related together and the amount of MCH in all of the groups has had an ascending process. Table 6 and figure 6 showed that the average amount of MCHC in control group and in groups which were fed with Artemia is approximately equal and the amount of MCHC in all of these groups has had an ascending process. Table 7 and figure 7 showed that the average amount of WBC in control group was more than those groups which were fed by Artemia, the amount of WBC has had an ascending process in all of the groups. WBC maximum amount is in control group and WBC minimum amount is in group L4. Table 8 and figure 8 showed that average amount of heterophils in control group was more than this amount in those groups which were fed by Artemia and a heteropenia process is seen in all of the groups during breeding period. Table 9 and figure 9 showed that the average amount of blood lymphocytes those groups which were fed by Artemia is more than this average amount in control group and a lymphocytosis process is seen in breeding period in all of the groups. Table 10 and figure 10 showed that the average amount of total protein in those groups which were fed by Artemia was more than control group and during breeding process has had an ascending process in all of these groups. Group L4 has the maximum amount of total protein and control group has the minimum amount of total protein. In the interpretation of total results of these investigations, during breeding period we have observed rising in blood parameters such as HB, PCV, RBC, MCV, MCH, MCHC,WBC, Lymphocytes, total protein and decreasing in heterophiles in all of the groups . In those groups which were fed by Artemia, the amount of PCV, MCV, MCH, Lymphocytes and total proteins was more than control group and the amount of Leukocytes (WBC), heterophiles was less than control group and the amount of RBC, HB, MCHC was approximately equal to control group. Results show that blood parameters were not affected by feeding with Artemia powder very much. Furthermore, in -fed group PCV, MCV, MCH, lymphocytes, total protein were more than control group; however, leukocytes and heterophils were lesser than control group, and RBC, Hb, MCH were roughly equal to control group. Finally it is notable to say that this is the first time that haematological investigations in the field of feeding rationing containing Artemia have been done.
| 56 | 46 | 42 | 35 | 28 | 21 | 14 | 7 | Day | Group |
|---|---|---|---|---|---|---|---|---|---|
| 142.7 ± 16.05 | 142.1 ± 15.27 | 135.7 ± 11.10 | 121.6 ± 1.13 | 105.6 ± 3.95 | 102.8 ± 1.97 | 93.2 ± 4.80 | 90.7 ± 6.57 | C | |
| 131.5 ± 8.13 | 126.3 ± 4.45 | 123.6 ± 2.54 | 120.8 ± 0.56 | 118.2 ± 1.27 | 113.3 ± 5.16 | 103.2 ± 2.26 | 101.3 ± 0.91 | L1 | |
| 140.8 ± 14.70 | 131.6 ± 8.20 | 125.3 ± 3.74 | 120.6 ± 0.42 | 115.6 ± 3.11 | 112 ± 5.65 | 105.1 ± 2.89 | 102.3 ± 1.62 | L2 | |
| 174.7 ± 24.53 | 164.2 ± 17.11 | 152.5 ± 16.23 | 142.3 ± 15.98 | 132.5 ± 8.83 | 122 ± 1.41 | 114.1 ± 4.31 | 104.2 ± 2.96 | L3 | |
| 175.3 ± 24.96 | 164.2 ± 17.11 | 155.5 ± 16.52 | 145.6 ± 18.10 | 135.3 ± 10.81 | 125 ± 3.53 | 114 ± 4.27 | 96.2 ± 2.68 | L4 | |
Table 4: MCV levels in broiler chickens experimental and control groups (FL).
| 56 | 46 | 42 | 42 | 35 | 28 | 21 | 14 | 7 | Day | Group |
|---|---|---|---|---|---|---|---|---|---|---|
| 47.5 ± 7.412 | 45.6 ± 6.64 | 43.1 ± 4.87 | 43.1 ± 4.87 | 40.3 ± 2.61 | 36.1 ± 0.07 | 33.7 ± 3.25 | 29 ± 2.61 | 26.6 ± 1.41 | C | |
| 48.2 ± 7.62 | 45.8 ± 6.79 | 43.2 ± 4.92 | 43.2 ± 4.92 | 38 ± 2.46 | 36.2 ± 0.11 | 34 ± 2.25 | 31.5 ± 1.37 | 30.3 ± 1.31 | L1 | |
| 46.2 ± 6.24 | 47.1 ± 7.83 | 44.8 ± 5.95 | 44.8 ± 5.95 | 43.5 ± 5.01 | 40.5 ± 2.83 | 37 ± 2.12 | 34.3 ± 2.37 | 30 ± 0 | L2 | |
| 55 ± 10.60 | 52.6 ± 8.17 | 50 ± 0 | 50 ± 0 | 45.2 ± 6.25 | 41.8 ± 2.98 | 38.1 ± 2.01 | 35.5 ± 2.27 | 31.7 ± 1.48 | L3 | |
| 55.8 ± 10.81 | 55.7 ± 10.73 | 52.7 ± 8.316 | 52.7 ± 8.316 | 47.1 ± 7.83 | 42.7 ± 4.19 | 37.8 ± 2.12 | 34 ± 2.24 | 30.6 ± 1.54 | L4 | |
Table 5: MCV levels in broiler chickens experimental and control groups (PG).
| 56 | 46 | 42 | 35 | 28 | 21 | 14 | 7 | Day | Group |
|---|---|---|---|---|---|---|---|---|---|
| 33.1 ± 0.63 | 32.5 ± 0.35 | 32.4 ± 0.28 | 32.4 ± 0.28 | 32.4 ± 0.28 | 32.3 ± 0.21 | 31.2 ± 0.77 | 30.4 ± 1.69 | C | |
| 32.6 ± 0.42 | 32.2 ± 0.14 | 31.8 ± 1.27 | 31.7 ± 1.20 | 31.5 ± 1.06 | 31.3 ± 0.91 | 31.2 ± 0.77 | 29.6 ± 2.54 | L1 | |
| 32.4 ± 0.98 | 32.2 ± 0.14 | 31.8 ± 1.27 | 31.7 ± 1.20 | 31.5 ± 1.06 | 31.3 ± 0.91 | 31.2 ± 0.77 | 30.1 ± 1.48 | L2 | |
| 32.7 ± 0.49 | 32.4 ± 0.28 | 32.8 ± 0.56 | 31.7 ± 1.20 | 31.6 ± 1.13 | 31.6 ± 1.13 | 31.4 ± 0.98 | 30.3 ± 1.62 | L3 | |
| 34.6 ± 0.98 | 33.2 ± 0.56 | 32.7 ± 0.49 | 32.3 ± 0.21 | 31.8 ± 1.27 | 31.4 ± 0.98 | 31.5 ± 1.06 | 30.4 ± 1.69 | L4 | |
Table 6: MCHC levels in broiler chickens experimental and control groups (g/dl).
| 56 | 46 | 42 | 35 | 28 | 21 | 14 | 7 | Day | Group |
|---|---|---|---|---|---|---|---|---|---|
| 33.1 ± 0.63 | 32.5 ± 0.35 | 32.4 ± 0.28 | 32.4 ± 0.28 | 32.4 ± 0.28 | 32.3 ± 0.21 | 31.2 ± 0.77 | 30.4 ± 1.69 | C | |
| 32.6 ± 0.42 | 32.2 ± 0.14 | 31.8 ± 1.27 | 31.7 ± 1.20 | 31.5 ± 1.06 | 31.3 ± 0.91 | 31.2 ± 0.77 | 29.6 ± 2.54 | L1 | |
| 32.4 ± 0.98 | 32.2 ± 0.14 | 31.8 ± 1.27 | 31.7 ± 1.20 | 31.5 ± 1.06 | 31.3 ± 0.91 | 31.2 ± 0.77 | 30.1 ± 1.48 | L2 | |
| 32.7 ± 0.49 | 32.4 ± 0.28 | 32.8 ± 0.56 | 31.7 ± 1.20 | 31.6 ± 1.13 | 31.6 ± 1.13 | 31.4 ± 0.98 | 30.3 ± 1.62 | L3 | |
| 34.6 ± 0.98 | 33.2 ± 0.56 | 32.7 ± 0.49 | 32.3 ± 0.21 | 31.8 ± 1.27 | 31.4 ± 0.98 | 31.5 ± 1.06 | 30.4 ± 1.69 | L4 | |
Table 7: The number of white blood cells in experimental and control groups 
| 56 | 46 | 42 | 35 | 28 | 21 | 14 | 7 | Day | Group |
|---|---|---|---|---|---|---|---|---|---|
| 26.000 ± 1.40 | 28.722 ± 1.92 | 27.730 ± 2.63 | 24.743±2.30 | 24.610±2.39 | 24.022±2.81 | 22.386±1.68 | 22.360 ± 1.62 | C | |
| 34.808 ± 2.61 | 33.668 ± 1.65 | 30.670 ± 0.94 | 25.990 ± 1.40 | 19.433 ± 0.40 | 16.237 ± 0.16 | 14.820 ± 0.83 | 13.935 ± 1.46 | L1 | |
| 28.700 ± 2.87 | 25.786 ± 1.25 | 23.757 ± 1.59 | 21.253 ± 0.53 | 19.799 ± 0.14 | 12.936 ± 0.75 | 11.975 ± 0.02 | 11.906 ± 0.07 | L2 | |
| 25.000 ± 0.70 | 22.859 ± 2.01 | 21.782 ± 0.15 | 21.606 ± 0.28 | 19.039 ± 0.68 | 16.846 ± 0.59 | 15.848 ± 0.11 | 13.936 ± 1.46 | L3 | |
| 25.750 ± 1.23 | 24.750 ± 2.25 | 22.642 ± 1.86 | 18.917 ± 0.77 | 18.637 ± 0.96 | 15.836 ± 0.12 | 11.875 ± 0.09 | 11.768 ± 0.16 | L4 | |
Table 8: Percentages blood heterophils in experimental and control groups (%).
| 56 | 46 | 42 | 35 | 28 | 21 | 14 | 7 | Day | Group |
|---|---|---|---|---|---|---|---|---|---|
| 4.5 ± 0.35 | 4.5 ± 0.35 | 4.7 ± 0.49 | 6.3 ± 0.21 | 8.5 ± 0.35 | 11.3 ± 0.49 | 14.3 ± 0.21 | 16.1± 0.07 | C | |
| 2.2 ± 0.14 | 4.0 ± 0.0 | 5.1 ± 0. 63 | 5.6 ± 0.28 | 6.3 ± 0.21 | 8.7 ± 0.49 | 14.1 ± 0.07 | 16.3±0.21 | L1 | |
| 1.6 ±0.28 | 1.6 ± 0.28 | 2.0 ± 0.0 | 3.7 ± 0.21 | 3.7 ± 0.21 | 5.5 ± 0.35 | 7.6 ± 0.28 | 10.8±0.84 | L2 | |
| 2.1 ± 0.12 | 2.0 ± 0.0 | 2.2 ± 0.14 | 4.1 ± 0.07 | 5.7 ± 0.21 | 7.5 ± 0.35 | 9.0 ± 0.70 | 11.2±0.56 | L3 | |
| 1.3 ± 0.49 | 3.7 ± 0.21 | 4.8 ± 0.52 | 5.7 ± 0.21 | 7.1 ±0.63 | 9.7 ± 0.21 | 11.7 ± 0.64 | 15.2±0.72 | L4 | |
Table 9: Percentages blood lymphocytes in experimental and control groups (%).
| 56 | 46 | 42 | 35 | 28 | 21 | 14 | 7 | Day | Group |
|---|---|---|---|---|---|---|---|---|---|
| 4.2 ± 0.69 | 3.7 ± 0.21 | 3.7 ± 0.21 | 3.6 ± 0.28 | 3.7 ± 0.21 | 3.5 ± 0.35 | 3.6 ± 0.28 | 3.1 ± 0.63 | C | |
| 4.7 ± 0.65 | 4.3 ± 0.68 | 4.3 ± 0.68 | 4.3 ± 0.68 | 4.5 ± 0.67 | 4.4 ± 0.67 | 3.6 ± 0.28 | 3.2 ± 0.56 | L1 | |
| 4.3 ± 0.68 | 4.3 ± 0.68 | 4.3 ± 0.68 | 4.2 ± 0.69 | 4.1 ± 0.70 | 3.8 ± 0.14 | 3.9 ± 0.07 | 3.2 ± 0.56 | L2 | |
| 5.1 ± 0.63 | 4.7 ± 0.65 | 4.6 ± 0.66 | 4.1 ± 0.70 | 4.1 ± 0.70 | 4.2 ± 0.69 | 3.7 ± 0.21 | 3.2 ± 0.56 | L3 | |
| 5.1 ± 0.63 | 4.8 ± 0.65 | 4.8 ± 0.65 | 4.1 ± 0.70 | 4.1 ± 0.70 | 3.4 ± 0.42 | 3.3 ± 0.49 | 3.1 ± 0.63 | L4 | |
Table 10: Total plasma protein levels in test and control groups (g/dl).
References
- Vanstappen G (1996) Introduction, biology and ecology of Artemia. In: Manual on the Production and Use of Live Food for Aquaculture. (Eds) Lavens P, Sorgeloos P, Food and Agriculture Organization of the United Nations, Rome, Italy.
- Asem A, Rastegar-Pouyani N (2007) Sexual dimorphism in Artemia urmiana Günther, 1899 (Anostraca: Artemiidae) from the Urmia Lake (West Azerbaijan, Iran). J Anim Vet Adv 6: 1409-1415.
- Clark LS, Bowen ST (1976) The genetics of Artemia salina. VII. Reproductive isolation. J Hered 67: 385-388.
- Bengtson DA, Legar P, Sorgeloos P ( 1991) Use of Artemiaas a food source of aquaculture. Artemia Biology, CRC Press Inc, Florida, USA.
- Dhont J, Lavens P, Sorgeloos P (1993) Preparation and use of Artemia as food for shrimp and prawn larvae, Crustacean Aquacult uer, CRC press Inc, Florida, USA.
- Legar P, Bengtson DA, Simpson KL, Sorgeloos P (1986) The use and nutrition value of Artemia as a food source. Oceanogr Mar Biol Ann Rev 24: 521-623.
- Legar P, Bengtson DA, Sorgeloos P, Simpson KL, Beck AD (1987) The nutrition value of Artemia: a review. The nutritional value of Artemia 3: 357-372.
- Zareia A (2010) ArtemiaMeal: A newer animal protein source for poultry. Indian J Anim Res 44: 235- 240.
- Aragao C, Concicao LEC, Danis MT, Fyhn H (2004) Amino acid pools of rotifers and Artemia under different conditions: nutritional implication for fish larvae. Aquaculture 234: 429-445.
- Akbarpour M (2001) Determination of protein and fat Artemia urmiana. ArtemiaResearch, Center Student Research Lake.
- Kemp C, Kenny M(2003) Feeding the modern broiler for more. International Hatchery Practice 17: 11-13.
- Kral I, Suchy P (2000) Hematological studies in adolescent breeding cocks. Acta Vet Brno 69: 189-194.
- Mushi EZ, MG Binta, Chabo RG (1999) Hematological studies on apparently healthy Tswana indigenous chickens (Gallus domesticus) around Gaborone, Botswana. INFPD News letter 9: 83-88.
- Hauptmanova K, Literak I, Bartova E (2002) Hematology and leucocytozoonosis of great Tits (Parus major) during winter. ACTA Vet Brno 71: 199-204.
- Levi A, Perelman B, Waner T, Van Grevenbroek M, Van Creveld, et al. (1989) Haematological parameters of the ostrich (Struthio camelus). Avian Pathol 18: 321-327.
- Onifade AA, Odunsi AA (1998) Efficacy of procaine penicillin as growth promoter in broiler chicks fed low and high fiber diets in the tropics. Arch Zootec 47: 621-628.
- Uko OJ, Ataja AM (1996b) Haematological studies of pure indigenous domestic fowl (Gallus domesticus) and guinea fowl (Numida meleagris) in Northwest Nigeria. Revue Elevage Med Vet Pays Trop 49: 257-262.
- Talebi A, Asri-Rezaei S, Roszeh-Chai R, Sahraei R (2005) Comparative studies onhaematological values of broiler strains (Ross, Cobbs, Arbor acres and Arian). Int J Poult Sci 4: 573-579.
- Islam MS, Lucky NS, Islam MR, Ahad A, Das BR, et al. (2004) Haematological parameters of fayoumi, assil and local chickens reared in Sylhet region in Bangladesh. Int J Poult Sci 3: 144-147.
- Nirmalan GP, Robinson GA (1971) Hematology of Japanese quail (Coturnix coturnyx japonica). Br Poult Sci 12: 475–481.
- Simaraks S, Chinrasri O, Aengwanich W (2004) Hematological, electrolyte and serum biochemical values of the Thai indigenous chickens (Gallus domesticus) in northeastern, Thailand, Songklanakarin J Sci Technol 26: 425-430.
- Gilbert AB (1963) The effects of estrogen and thyroxine on blood volume of the domestic cock. J Endocrinol 26: 41-47.
- Verma PN, Rawat JS, Pandey MD (1975) Effect of age and sex on the serum proteins of the white leghorn birds. Indian Vet J 52: 544-546.
- Abdi-Hachesoo B, Talebi A , Asri-Rezaei S (2011) Comparative Study on Blood Profiles of Indigenous and Ross-308 Broiler Breeders. Global Veterinaria 7: 238-241.
- Ayoola SO (2010) Haematological Characteristics of Clarias gariepinus(Buchell, 1822) Juveniles Fed with Poultry Hatchery Waste. American-Eurasian Journal of Toxicological Sciences 2: 190-195.
- Alcorn JM (2002) Poultry Diseases. (5thedn), Saunders Company, London, UK.
- Bermudez AJ, Stewart-Brown B (2003) Diseases of Poultry. (11thedn), Iowa State Press, a Blackwell Publishing Compan, USA.
- Sorgeloos P (1980) The use of brine shrimp Artemiain Aquaculture. The Brine Shrimp Artemia3: 25-45.
- Campbell TW (1995) Avian Haematology and Cytology. Iowa State University Press, USA.
- Nazify S (1999) Hematology and Biochemistry birds. Published by University of Tehran. Iran.
- SAS (1990) SAS/STAT User?s Guide. Statistiscal Analysis System Institute Inc., Cary NC.
- Hosseini SH (1998) Nutritional value of Artemia Lake with emphasis on fatty acid composition in various stages of growth. Thesis Veterinary.
- Ronsivalli PC, Simpson KL(1983) The brine shrimp Artemiaas a protein source for humans. ArtemiaResearch and its Applications 3: 503-514.
- Ahmed Khan T, Zafar F (2005) Haematological Study in Response to Varying Doses of Estrogen in Broiler Chicken. Int J Poult Sci 4 : 748-751
Relevant Topics
- Agricultural biotechnology
- Animal biotechnology
- Applied Biotechnology
- Biocatalysis
- Biofabrication
- Biomaterial implants
- Biomaterial-Based Drug Delivery Systems
- Bioprinting of Tissue Constructs
- Biotechnology applications
- Cardiovascular biomaterials
- CRISPR-Cas9 in Biotechnology
- Nano biotechnology
- Smart Biomaterials
- White/industrial biotechnology
Recommended Journals
Article Tools
Article Usage
- Total views: 19002
- [From(publication date):
July-2012 - Mar 31, 2025] - Breakdown by view type
- HTML page views : 13737
- PDF downloads : 5265
