Research Article Open Access
Ex-Vivo Trace Assay Using Silver-doped Microfilm Electrode
Suw Young Ly* and Juo Yang KimBiosensor Research Institute, Seoul National University of Science and Technology, 172, gong reung 2-dong, Nowon gu, Seoul, South Korea
- *Corresponding Author:
- Suw Young Ly
Biosensor Research Institute
Seoul National University of Science and Technology
172, gong reung 2-dong, Nowongu
Seoul, South Korea 139-743
Tel: +82 2 970 6691
Fax: +82 2 973 9149
E-mail: suwyoung@snut.ac.kr
Received April 20, 2011; Accepted July 01, 2011; Published July 20, 2011
Citation: Young Ly S, Kim JY (2011) Ex-Vivo Trace Assay Using Silver-doped Microfilm Electrode. J Addict Res Ther 2:113. doi:10.4172/2155-6105.1000113
Copyright: © 2011 Young Ly S, et al. This is an open-access article distributed under the terms of the Creative Commons Attribution License, which permits unrestricted use, distribution, and reproduction in any medium, provided the original author and source are credited.
Visit for more related articles at Journal of Addiction Research & Therapy
Abstract
Trace lead is a dangerous environmental chemical that is associated with increased cancer risk. In this study, assay was conducted in ex-vivo mouse fluid, using a silver-doped microfilm electrode (SDE). The analytical working range was from 20 to 160 mg/L. Under optimum conditions, the micro range improved to 5-65μg/L while the detection limit was 5μg/L. Under a 10.0-mg/L Pb constant, the 10-time statistic was R 2 =9.795. This result was applied to mice ordure using SDE via cyclic and square-wave stripping voltammetry. As a result, 27.6μg/L Pd(II) was detected in the mice ordure solution with a precision value of ±12.5%. The techniques developed in this study using a probe that did not require pretreatment and expensive equipment can be applied in medical diagnosis.
Keywords
Lead; Cancer; Analytical; Silver; Diagnosis
Introduction
Lead is an abundant and important but dangerous environmental chemical that is globally well-distributed [1]. It has been used since the ancient times, and some of its toxic effects were recognized as early as several centuries ago [1]. It exists in the natural agricultural grain, particularly in water [2,3], soil [4], animals and plants [7,8], and is also found in children’s toys. In addition, it is a versatile, subtle, and persistent poison [9]. Recent epidemiological data provide increasing evidence that environmental as well as occupational lead exposures may be associated with increased cancer risk [10]. Recent data also indicate the possibility of DNA synthesis stimulation caused by lead in human astrocytoma cells, through the mechanism that involves the activation of PKCα and mitogen-activated protein kinase [11]. It has likewise been reported that preschool children who have been exposed to lead obtain poor grades [12]. Due to lead’s toxicity, it is important to detect its presence and determine levels of such presence. Methods of detecting lead include electrothermal atomic-absorption spectrometry [13,14], X-ray fluorescence [15], anodic stripping voltammetry [16-18], and adsorptive stripping voltammetry [19]. However, spectro photometrics require complicated light separation and other detection techniques, while common type voltammetrics call for expensive reference and counter electrode. In this study, a silver-paste-coated microfilm electrode was used because it does not require pretreatment and expensive equipment. Moreover, electrodes are inexpensive and easy to make (they can be made manually in the laboratory). Compared to other techniques, use of electrodes is effective and economical. Results obtained a 5μg/L detection limit that was also improved for ex-vivo assay application.
Materials and Methods
Systems, reagents, electrode preparation, experimental procedure and statistical data
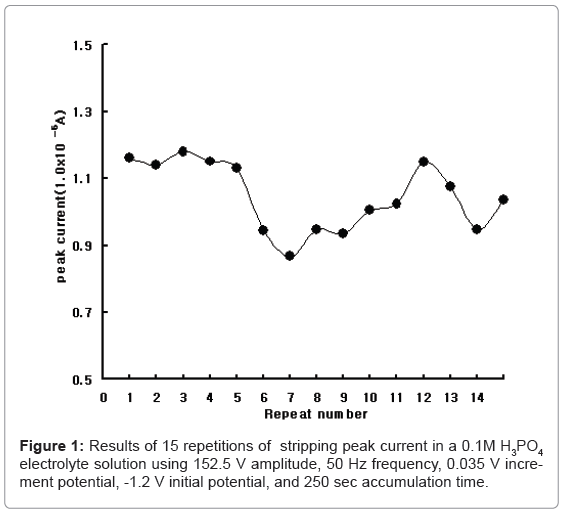
Analytical systems were used with the bioelectronics-2 system, which was constructed at the authors’ institute. The second version involves a computerized handheld voltammetric instrument that is as big as a typical cellular phone. It can be used in the bioassay and sensor techniques for individual and laboratory applications. A standard lead solution (1,000 mg/L) was obtained from Merck. All the chemicals used were of analytical grade. The reference, counter, and working electrodes were used with SDE. The SDE was prepared by coating it with silver paste at the polyethylene microfilm (0.2 mm thick) surface with 3mm × 10 mm. A copper wire was subsequently connected to the electrical system. All the experiments were performed at room temperature without removing the oxygen. The electrolyte solution composed of 0.1M NH4H2PO4 with a pH of 3.6 was found to be the most suitable electrolyte solution. Using 0.1 M electrolyte solutions, Figure 1 shows the results for the stability of SDE. The counter and reference electrodes were examined under optimum conditions. 0.2 ml lead was spiked and tested 15 times. First, it obtained 1.161×10⁻⁴A and oscillated from 0.865 to 1.148×10⁻⁴A. Precision was 9.795 %, and analytical redox potential was examined.
Results
Cyclic and square-wave voltammetry
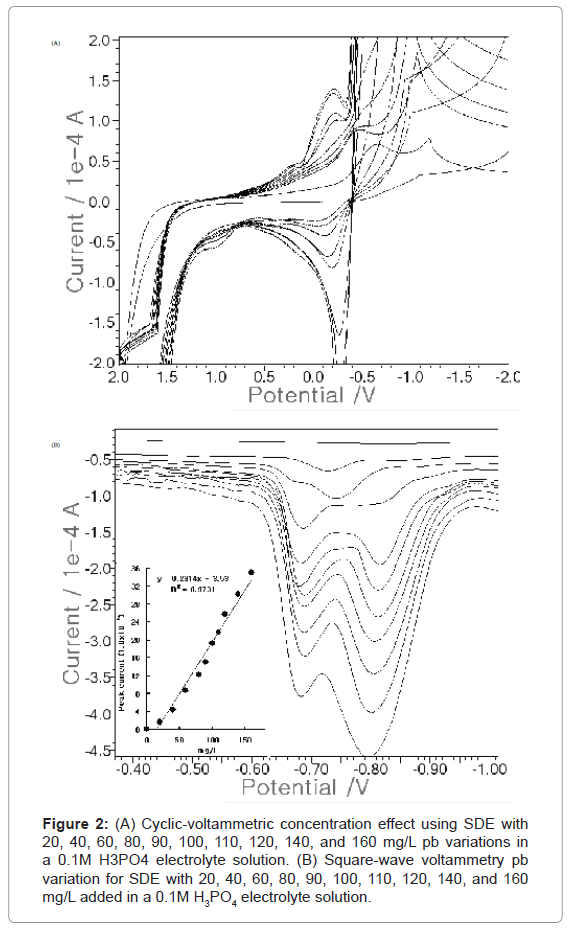
In cyclic voltammetry, the analytical peak potential is determined using SDE working, reference, and counter electrodes. Figure 2A shows the CV results at 20, 40, 60, 80, 90, 100, 110, 120, 140, and 160 Pb(II) mg/L add, respectively. The peak current appeared at around -0.3 V. Whenever more lead was added, it continuously increased. In the blank solution, no signal was obtained. The peak current piled up one by one. Under these conditions, the SW voltammetry was determined using three SDEs. Figure 2B shows the SW anodic results at 20, 40, 60, 80, 90, 100, 110, 120, 140, and 160 mg/L add, respectively. The peak current appeared at around -0.8 V, with two peaks. It also increased from 1.673 to 35.13x10⁻⁵A. The SW results equation was y=0.231x-3.53, with a precision value of R2=0.973. Here, stripping was found to be more sensitive than cyclic voltammetry. For this reason, the optimum conditions were examined with SDE using SW.
Figure 2:(A) Cyclic-voltammetric concentration effect using SDE with 20, 40, 60, 80, 90, 100, 110, 120, 140, and 160 mg/L pb variations in a 0.1M H3PO4 electrolyte solution. (B) Square-wave voltammetry pb variation for SDE with 20, 40, 60, 80, 90, 100, 110, 120, 140, and 160 mg/L added in a 0.1M H3PO4 electrolyte solution.
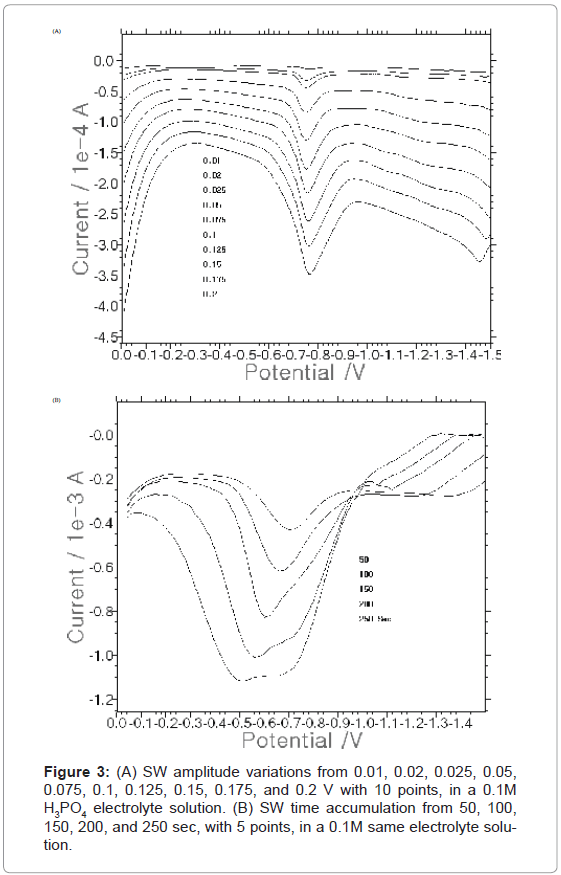
After the voltammetric system was selected, the following optimum conditions were examined, and the square-wave amplitude, frequency, increment potential, initial potential, and time accumulation were changed in that order. First, Figure 3A shows the 0.01, 0.02, 0.025, 0.05, 0.075, 0.1, 0.125, 0.15, 0.175, and 0.2 V SW amplitudes for 8 points, in the 10 mg/L spike. In the blank solution, a clear curve appeared. After that, various amplitudes were continuously given. At 0.2 V, the maximum current of 152.5×10⁻⁶A was obtained. Thus, the 0.2 V amplitude was chosen as an optimum condition. Figure 3B shows the 50, 100, 150, 200, and 250 sec SW accumulation times. The peak current continuously increased from 2.096 to 9.075×10⁻⁶A. As more time was given, the curve became deeper and narrower. At 250 sec, the maximum current was obtained. Therefore, 250 sec was chosen as an optimum condition. Furthermore, the parameters of the other optimum conditions were examined, including 50 Hz frequency, 0.035 V increment potential, and -1.3 V initial potential (not shown here).
Discussion, interference and applications
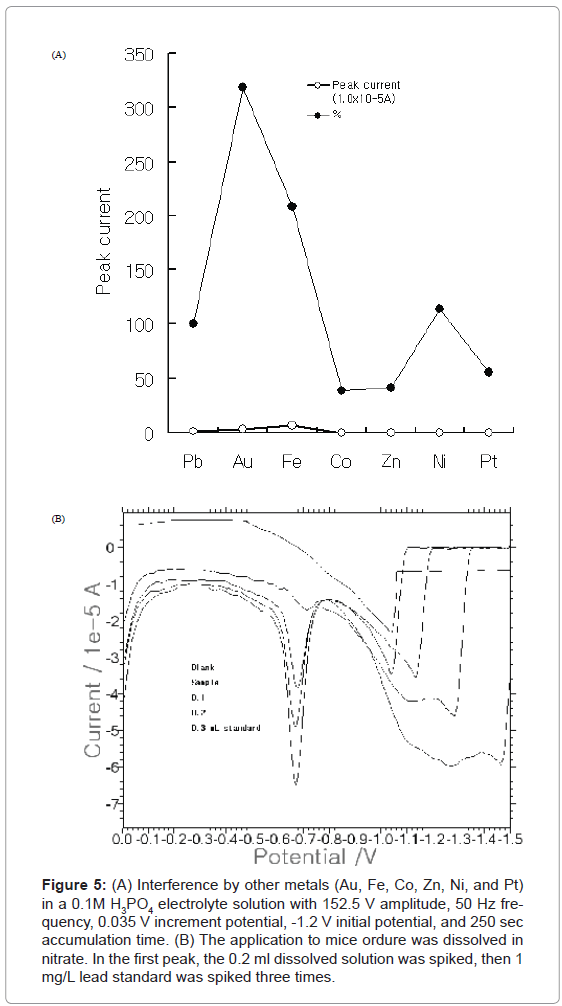
Figure 5:(A) Interference by other metals (Au, Fe, Co, Zn, Ni, and Pt) in a 0.1M H3PO4 electrolyte solution with 152.5 V amplitude, 50 Hz frequency, 0.035 V increment potential, -1.2 V initial potential, and 250 sec accumulation time. (B) The application to mice ordure was dissolved in nitrate. In the first peak, the 0.2 ml dissolved solution was spiked, then 1 mg/L lead standard was spiked three times.
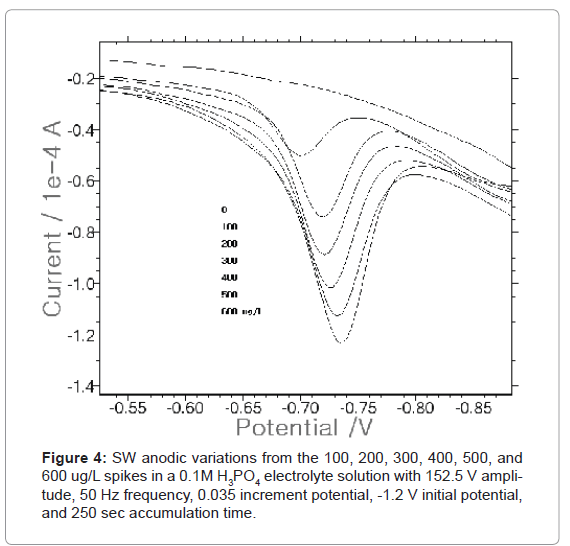
Under optimum conditions, the 100, 200, 300, 400, 500, and 600 μgL/L analytical working ranges were examined (Figure 4) using SDE. The peak current appeared at the point between -0.70 and -0.75 V. In the blank solution, the clear curve appeared without a small peak. After that, the concentration was spiked in the aforementioned order. The greater the concentration of Pb(II) that was spiked, the bigger and narrower the peak current that was obtained. It continuously increased at 2.255, 4.307, 5.344, 6.3, 6.961, and 8.298×10⁻⁶A. As a result, the detection limit was 100 μg/L.
After the working ranges were examined, the various analytical interference ions were also examined. Figure 5A shows the results of the interference by various metals under optimum conditions. Analog metals were added into the medium containing 0.1 mg/L lead for the tenfold spiking of 1 mg/L Au, Fe, Co, Zn, Ni, and Pt, respectively. This yielded results of 319, 209, 39.0, 41.6, 114, and 56.0%, respectively. The analytical interferences were effectively corrected using standard addition methods. Analytical application was then performed under optimum conditions. Figure 5B shows the stripping to the mice ordure. The standard addition method was used in this experiment. 0.1 g of mice ordure provided by the Cancer Center Hospital was put in the 1-mL-conc nitrate. It was dissolved in 100 mL distilled water. Initially, 0.2 ml dissolved solution was spiked. Afterwards, 1 mg/L lead standard was spiked three times. Here, the statistical analysis was performed three times, and the average concentration was 27.6±0.0346 μg/L. Results show that the developed methods can be applied to ex-vivo detection.
Conclusion
Three-SDE microfilm cell systems are inexpensive, and easy and fast to make. In this study, the optimum conditions of 152.5 V amplitude, 50 Hz frequency, 0.035 increment potential, -1.2 V initial potential, and 250 sec accumulation time were obtained. The detection limit was 5 μg/L. These optimized conditions were applied to the detection of lead in mice ordure. After the experiment, trace lead was found to remain in the mice ordure. Therefore, it can be used to detect lead in other fields, such as in in-vivo or ex-vivo fluid, tissue, and biological assay.
References
- Zhijian C, Jianlin L, Shijie C, Wei Z, Wei W, et al. (2006) Evaluating the genotoxic effects of workers exposed to lead using micronucleus assay, come assay and TCR gene mutation test. Toxicology 223: 219-226.
- Cabon JY (2002) Determination of Cd and Pb in seawater by graphite furnace atomic absorption spectrometry with the use of hydrofluoric acid as a chemical modifier. Spectrochim Acta B 57: 513-524.
- Slaveykova VI, Parthasarathy N, Buffle J, Wikinson K (2004) Permeation Liquid membrane as tool for monitoring bioavailable Pb in natural waters. Sci Total Environ 328: 55-68.
- Saby N, Arrousays D, Boulonne L, Jolivet C, Pochot A (2006) Geostatistical assessment of Pb in soil around Paris, France. Sci Total Environ 367: 212- 221.
- Zemberyova M, Bartekova J, Zavadska M, Sisolakova M (2007) Determination of bioavailable fractions of Zn, Cu, Ni, Pb, and Cd in soils and sludges by atomic absorption spectrometry. Talanta 71: 1661-1668.
- Fokas P, Zervas G, Fegeros K, Zoiopoulos P (2004) Assessment of Pb retention coefficient and nutrient utilization in growing pigs fed diets with added clinoptilolite. Anim Feed Sci Tech 117: 121-129.
- Hong BJ, Shan CB, Wei D, Gai WQ, Yi DQ (2007) Plant Pb Contents in Elevation Zones of the Changbai Mountain National Nature Reserve, China. Pedosphere 17: 229-234.
- Yanqun Z, Yuan L, Schvartz C, Langlade L, Fan L (2004) Accumulation of Pb, Cd, Cu, and Zn in plants and hyperaccumulator choice in lanping lead-zinc mine area, China. Environ Int 30: 567-576.
- Danadevi K, Rozati R, Banu BS, Rao PH, Grover P (2003) DNA damage in workers exposed to lead using comet assay. Toxicology 187: 183-193.
- Silbergeld EK (2003) Facilitative mechanisms of lead as a carcinogen. Mutat Res 533: 121-133.
- Wozniak K, Blasiak J (2003) In vitro genotoxicity of lead acetate: induction of single and double DNA strand breaks and DNA-protein cross-links. Mutat Res 535: 127-139.
- Nevin R (2009) Trends in preschool lead exposure, mental retardation, and scholastic achievement: Association or causation? Environ Res 109: 301- 310.
- Giacomelli MBO, Lima MC, Stupp V, de C. Junior RM, da silva JB, et al. (2007) Determination of As, Cd, Pb and Se in DORM-1 Dogfish muscle refernce meterial using alkaline solubilization and electorthermal atomic absorption spectrometry with Ir +Rh as permanent modifiers or Pd + Mg in solution. Spectrochim Acta B 57: 2151-2157.
- Myohanen T, Mantylathi V, Koivuen K, Matilainen R (2002) Simultaneous determination of As, Cd, Cr and Pb in aqua regia digests of soils and dediments using electrothermal atomic absorption spectrometry and fast furnace programs. Spectrochim Acta B 57: 1681-1688.
- Luo L, Chettle DR, Nie H, McNeill FE, Popovic M (2007) The effect of filters and collimators on compton scatter and Pb K-series peaks in XRF bone lead analysis. Nucl Instrum Meth B 263: 258-261.
- Woolever CA, Dewald HD (2001) Differential pulse anodic stripping voltammetry of barium and lead in gunshot residue. Forensic Sci Int 117: 185- 190.
- Wagner K, Strojek JW, Koziel K (2001) Processes during anodic stripping voltammetry determination of lead in the presence of copper on a solid electrode modified with 2,2'-bipyridyl in polyaniline. Anal Chim Acta 447: 11- 21.
- Bonifil Y, Kirowa-Eisner E (2002) Determination of nanomolar concentration of lead and cadmium by anodic-stripping voltammetry at the silver electrode. Anal Chim Acta 457: 285-296.
- Wu Q, Batley GE (1995) Determination of sub-nanomolar concentration of lead in sea water by adsorptive stripping voltammetry with xylenol orange. Anal Chim Acta 309: 95-101.
Relevant Topics
- Addiction Recovery
- Alcohol Addiction Treatment
- Alcohol Rehabilitation
- Amphetamine Addiction
- Amphetamine-Related Disorders
- Cocaine Addiction
- Cocaine-Related Disorders
- Computer Addiction Research
- Drug Addiction Treatment
- Drug Rehabilitation
- Facts About Alcoholism
- Food Addiction Research
- Heroin Addiction Treatment
- Holistic Addiction Treatment
- Hospital-Addiction Syndrome
- Morphine Addiction
- Munchausen Syndrome
- Neonatal Abstinence Syndrome
- Nutritional Suitability
- Opioid-Related Disorders
- Relapse prevention
- Substance-Related Disorders
Recommended Journals
Article Tools
Article Usage
- Total views: 14652
- [From(publication date):
August-2011 - Nov 14, 2025] - Breakdown by view type
- HTML page views : 9901
- PDF downloads : 4751

