Research Article Open Access
Evaluation of Interaction of Carbonization Temperatures and Concentrations on the Adsorption Capacities and Removal Efficiencies of Activated Carbons Using Response Surface Methodology (RSM)
| Alade AO1,3, Amuda OS2*, Ogunleye OO3 and Okoya AA4 | |
| 1Biotechnology Engineering Department, International Islamic University Malaysia, Kuala Lumpur, Malaysia | |
| 2Department of Pure and Applied Chemistry, Ladoke Akintola University of Technology, Ogbomoso, Nigeria | |
| 3Chemical Engineering Department, Ladoke Akintola University of Technology, Ogbomoso, Nigeria | |
| 4Institute of Ecology and Environmental Studies, Obafemi Awolowo University, Ile- Ife, Nigeria | |
| Corresponding Author : | Amuda OS Department of Pure and Applied Chemistry Ladoke Akintola University of Technology Ogbomoso, Nigeria Tel: +234 803 440 2907 E-mail: osamuda@lautech.edu.ng |
| Received: December 11, 2011; Accepted: December 29, 2011; Published: December 31, 2011 | |
| Citation: Alade AO, Amuda OS, Ogunleye OO, Okoya AA (2012) Evaluation of Interaction of Carbonization Temperatures and Concentrations on the Adsorption Capacities and Removal Efficiencies of Activated Carbons Using Response Surface Methodology (RSM). J Bioremed Biodegrad 3:134. doi:10.4172/2155-6199.1000134 | |
| Copyright: © 2012 Alade AO, et al. This is an open-access article distributed under the terms of the Creative Commons Attribution License, which permits unrestricted use, distribution, and reproduction in any medium, provided the original author and source are credited. | |
Related article at Pubmed Pubmed  Scholar Google Scholar Google |
|
Visit for more related articles at Journal of Bioremediation & Biodegradation
Abstract
Response Surface Methodology was used to evaluate the interactions of carbonization temperatures of adsorbents and concentrations of adsorbates on the adsorption capacities and removal efficiencies of activated carbons obtained from flamboyant ( Delonix regia ) pod bark (FB), milk bush ( Thevetia peruviana ) kernel shell (MB) and rice ( Oryza sativa ) husks (RH). The activated carbons produced at various temperatures (300-600 ?C) were used to adsorb concentrations (50-150 mg/L) of naphthalene and acenaphthene in a batch process at 150 rpm. The amount adsorbed was quantified with gas chromatography (GC-FID). Two factors interaction (2FI) model Y = a 0 + a 1 A + a 2 B + a 12 AB, showed that the interactions between increasing activation temperature of the adsorbents and increasing concentrations of the adsorbates increased the adsorption capacity of the MB while the adsorption capacities of FB and RH were reduced. The order of suitability of the adsorbents is MB > RH > FB and MB > FB > RH, respectively
| Keywords |
| Response Surface Methodology; Polyaromatic hydrocarbons; Adsorption capacities |
| Introduction |
| Presence of polycyclic aromatic hydrocarbons (PAHs) in wastewater stream forms one of the current challenges facing wastewater treatment research [1-4]. Common treatment methods adopted for treating PAHs such as biodegradation, scrubber adsorption, high–energy electron beam irradiation, ozonization and catalytic combustion have secondary environmental effects [5-7]. However, adsorption process with activated carbon has been reported to be effective for the removal of pollutant from wastewater [8]. |
| The nature and mechanism of adsorption is primarily effective within porous solids however, the interactive forces of physical attraction between the surface of porous solids and the targeted components of the molecules in the bulk phase establish adsorption process [9]. Several reseaches have studied the factors affecting removal of PAHs in wastewater using activated carbons [10-11]. Moreno–Castilla [12] reported that, there is complex interplay between electrostatic and non–electrostatic interactions while both are highly influenced by the surface chemistry of the carbon. |
| For adsorption in aqueous solution, adsorbates may specifically interact with the adsorbent surface, including basal plane electrons, unpaired electrons located on the edges of terminated basal planes and surface functional group [13]. Other factors include surface area, pore structure, pore size distribution, pH, and temperature [14], and in the overall, the larger the value of these factors the better. However, the factors can be optimised to facilitate effective adsorption [15]. The activation temperature, composition and structure of the selected raw material greatly affect the pore structure and chemistry of most activated carbons of agricultural origin [16]. The surface area of an adsorbent typically composed of various surface functional groups, which are created by oxidation during activation process of a given adsorbent and hence, affects adsorption process [10-11]. |
| It has been shown that adsorption of PAHs on activated carbon depends on microporosity, mesoporosity and pore size distribution of activated carbon [17-22]. In this study, the effects of interactions of carbonization temperatures of adsorbents and concentrations of adsorbates on the adsorption capacities and removal efficiencies of activated carbons obtained from flamboyant (Delonix regia) pod back, milk bush (Thevetia peruviana) kernel shell and rice (Oryza sativa) husks for the adsorption of naphthalene and acenaphthene were evaluated statistically from the response models generated through response surface methodology. |
| Materials and Methods |
| Materials |
| The agricultural waste materials used in the production of the adsorbents in this study were obtained within the vicinity of Ogbomosho Township, Nigeria. The reagents used include sodium bicarbonate (NaHCO3), phosphoric acid (H2PO4 58%), acetone (BDH Chemicals Ltd, mw 58.08g , spg 0.789 - 0.791 g/Ã?Â?C), distilled water, polycyclic aromatic hydrocarbon (PAHs) of 2-rings, Naphthalene ( 100 g , Merck, Mw 128.18 g), and 3-ring, Acenaphthene (100 g, Merck, Mw 178.23). All reagents are analytical grade. |
| Production of activated carbons |
| The barks and the shells of the flamboyant pod and milk bush kernel, respectively, were removed, washed with distilled water, to remove surface impurities [23] and dried in the oven (105°C) overnight [24] to constant moisture level. The dried materials were crushed using milling machine to reduce their sizes to pellet-form and increase their surface area [23] and then stored in dry containers prior to carbonization. The above steps were repeated for rice husks after washing with distilled water [24]. Each agricultural material (1 Kg) was charred in the furnace (Vecstra, Model 184A, Italy) at 300°C, for 2h and the resulting charred material was cooled at room temperature. The procedure was repeated for all the materials separately at carbonization temperatures of 300-600°C [25]. Samples of the carbonized material were weighed and soaked in excess phosphoric acid (H3PO4) for 3 h, after which the mixtures were charged inside an oven at temperature of 200°C for 24h to ensure proper activation [26]. The materials were later cooled for 2h, washed with distilled water until leachable impurities due to free acid and adherent powder were removed [24]; this was later soaked in 2% (w/v) NaHCO3 to remove any residual acid. The resulting mixture was further washed with distilled water to a constant pH (7.0), drained, dried overnight in an oven at 110°C [24] and cooled at room temperature. |
| Preparation of simulated water |
| Calculated amount (50-150mg) of naphthalene was weighed and added to 300 mL of acetone in 1dm3 standard flask and was carefully swirled together for 10 min to allow proper dissolution; this was made up to the mark with distilled water [27]. The procedure was repeated for the preparation of 75, 100, 125 and 150 mg/L of naphthalene and acenaphthene separately. |
| Determination of adsorption capacity |
| Weighed amount (1g) of each activated carbon was added to 50 mL of the adsorbate (50 mg/L) in 250 mL conical flask. The flask was covered and agitated on magnetic stirrer at 150 rpm for 2 h [28] at ambient temperature (28±2°C) and pH 7.5 [27]. The content was allowed to stand for 1 h and the supernatant solution was filtered with Whatman filter paper (15mm) into sample bottles [27]. The process was repeated for 75, 100, 125 and 150 mg/L of naphthalene and acenaphthene, respectively. The resulting filtrates were subjected to analysis. |
| Analytical measurement |
| The unadsorbed concentration of naphthalene and acenaphthene in the filtrate was quantified using gas chromatography coupled with flame ionization detection (GC-FID) [25,27]. A HP-5 capillary of 30 m with internal diameter of 0.25 mm and film thickness of 0.25 μm was used. The column temperature was set to 60Ã?Â?C for 2 min and then ramped to 320Ã?Â?C programmed at 10Ã?Â?C /min. Nitrogen was used as carrier gas at a constant pressure of 35 psi while hydrogen and air flow rate pressure were 22 psi and 28 psi, respectively. Injector port and detection temperatures were 250Ã?Â?C and 320Ã?Â?C, respectively. While 1.0 μL of sample was injected, before analysis, calibration standard was run to check column performance peak height and resolution; the limits of detection of the compound were identified mainly by its retention time. The abundance of quantification of analyte with respect to authentic PAH standard detection limits was derived from replicate procedure. |
| Quantification of adsorption capacity |
| The adsorption capacities of the materials carbonized at different temperature were determined using the equation below [27]. |
 (1) (1) |
| Where qe is the adsorption capacity of adsorbent (mg/g), Co is the initial concentration of the adsorbate in the solution (mg/L); Ce is the final concentration of the adsorbate in the solution quantified with GCFID (mg/L); V is the volume of the solution (mL) and w is the mass of the adsorbent (g). |
| Statistical analysis |
| Statistical analysis of all data was done with the Design Expert® software Version 6.0.8 [29]. Responses of the adsorption capacities and removal efficiencies in the entire experimental region studied were evaluated under Response Surface 2FI (2-factor interaction), which can process two factors interactions [30]. The interaction allows one factor to be varied while the other factor is kept constant [31-32]. The influence of these factors on each other is important to the analysis, though the interaction may be contributory or antagonistic [32]. Each response (Y) is described by a 2FI model (equation 2), which is adequate for predicting the responses in all experimental regions, and all the variables in a particular model were determined with the aid of the facilities inbuilt in the Design Expert software Version 6.0.8 [29]. |
| Y = a0 + a1 A + a2 B + a12 AB (2) |
| Where A = coded variable related to carbonization temperature of adsorbent, B = coded variable related to initial concentration of adsorbate, α0 = intercept term (constant that corresponds to the response when A is zero for each factor), α1 = influence of carbonization temperature, α2 = influence of initial concentration, α12 = interaction effect between carbonization temperature and initial concentration. |
| Results and Discussion |
| In this study, each of the agricultural materials employed were carbonized at 300, 500 and 600Ã?Â?C and thus flamboyant pod back are coded FB300, FB500 and FB600; rice husk, RH300, RH500 and RH600 while milk bush kernel shell carbons are coded MB300, MB500 and MB600. |
| Surface Response Analysis |
| The experimental responses studied were adsorption capacity (Y1) and removal efficiency (Y2). The coefficients of the postulated model obtained from analysis of variance for Response Surface 2FI Model were used to interpret the results. The validity of the model chosen is justified by the coefficient of correlation (R2) between the maximum capacities of adsorption calculated by the model and those determined experimentally. Values of these coefficients are summarized in table 1. |
| Adsorption of naphthalene onto flamboyant pod back |
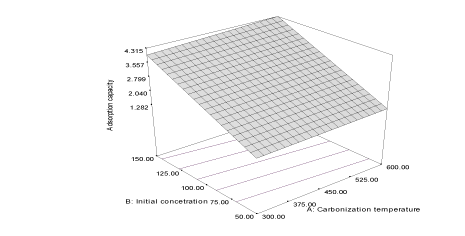
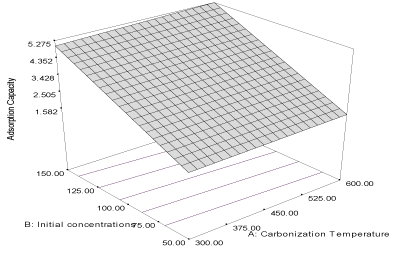
| The correlation coefficient (R2) of the response adsorption capacity obtained is 0.997 and the predicted correlation coefficient (PR2) is 0.9947 which is a reasonable agreement with the adjusted correlation coefficient (AR2) (0.9962). The final equation in terms of coded factors for the adsorption of naphthalene unto flamboyant pod bark (Y1FB) is described by the equation 3 and the response curve describing the equation is shown in Figure 1. |
| Y1FB = 2.76 + 0.14A + 1.38B + 0.039AB (3) |
| The effects of the carbonization temperature (α1= 0.14) and initial concentration (α2 = 1.38) are more important than their interaction (α12= 0.039). The larger value of α2 shows that the adsorption of naphthalene is influenced by increasing concentration at lower carbonization temperature, yet both have positive effect on the adsorption capacity of activated carbon [23]. The response of removal efficiency of flamboyant pod back is described by the following equation: |
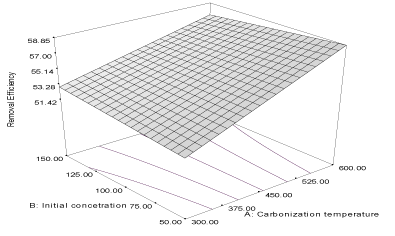
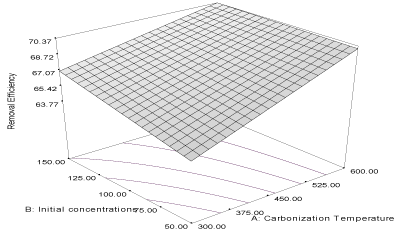
| Y2FB = 55.15 + 2.95A + 0.016B - 0.76AB (4) |
| The correlation coefficient of the response is 0.8689 while the adjusted and predicted correlation coefficients (R2) are 0.8332 and 0.7774, respectively. The predicted (PR2) is in reasonable agreement with the adjusted (AR2) and the response curve describing the equation is shown in Figure 2. The equation shows that carbonization temperature (α1= 2.95) has greater influence than initial concentrations (α2 = 0.016) and the removal efficiency of carbon derived from flamboyant pod bark, [33]. Thus, more naphthalene would be adsorbed unto flamboyant pod bark produced at higher carbonization temperature. The value of α12 = - 0.76, indicates that the combine influence of carbonization temperature and initial concentration will affect the removal efficiency of the activated carbon negatively. |
| Adsorption of naphthalene unto milk bush kernel shells |
| The response of the adsorption capacity of activated carbon produced from milk bush kernel shell for the adsorption of naphthalene is described as: |
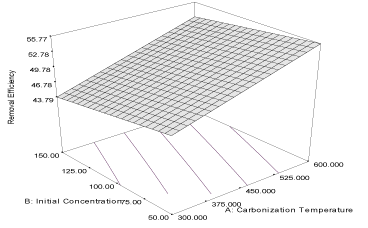
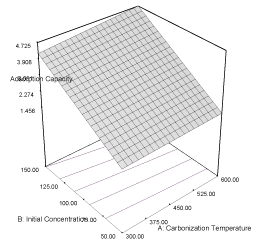
| Y3MB = 2.48 + 0.22A + 1.18B + 0.12AB (5) |
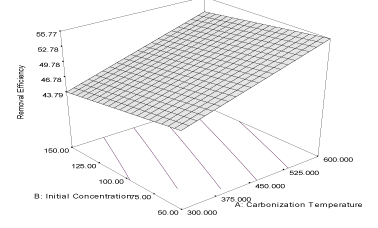
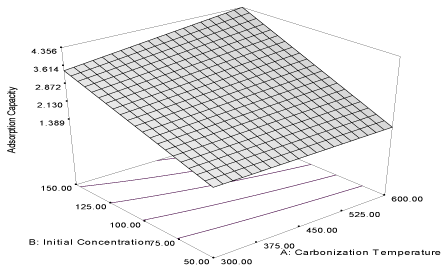
| The response curve describing the equation is shown in Figure 3. The coefficient of correlation (R2) is 0.9998 while the predicted (PR2) and adjusted (AR2) are 0.9957 and 0.9972, respectively; the values are in reasonable agreement with one other. The effect of initial concentration of naphthalene (α1 = 1.18) is higher than the effect of carbonization temperature (α2 = 0.22) on the adsorption capacity of the activated carbon. The combine effects of the two responses (α12 = 0.12) have positive influence on the adsorption capacity which may improve as the carbonization temperature and initial concentration are increased. The coefficient of correlation of the response of removal efficiency of carbon derived from milk bush kernel shell is 0.9622 and the predicted correlation coefficient (PR2) is 0.9272 which is in reasonable agreement with adjusted correlation coefficient (AR2) (0.9519). The equation describing the response is given as equation 6, while the response curve describing the equation is shown in Figure 4. |
| Y4MB = 49.92 + 4.35A – 1.65B + 0.14AB (6) |
| Removal efficiency of this activated carbon is highly influenced by carbonization temperature (α1= 4.35) and the equation shows that initial concentration has a highly negative influence (α2 = -1.65) on the removal efficiency of the activated carbon. Thus, increasing initial concentration of the naphthalene is not favourable to the removal efficiency of the carbon. The combine influence (α12 = 0.14) of carbonization temperature and initial concentration is relatively low compared to the high values of influence of carbonization temperature on the removal efficiency of the activated carbon. |
| Adsorption of naphthalene unto rice husk |
| The response of adsorption capacity of activated carbon produced from rice husk (RH) is described by the equation: |
| Y5RH = 3.40 + 0.11A + 1.73B + 0.027AB (7) |
| The correlation coefficient (R2) of the model is 0.9976 and the predicted correlation coefficient (R2)’ is 0.9957, which are in agreement with the adjusted correlation coefficient (AR2) (0.9969) and the response curve describing the equation is shown in Figure 5. The influence of initial concentration (α2 = 1.73) of naphthalene is higher than the influence of the carbonization temperature (α2 = 0.11) of the carbon for the adsorption of naphthalene from simulated wastewater. The influence of the two factors (α12 = 0.027) on the adsorption capacity of the carbon is very low. The above results show that more naphthalene can be adsorbed to the rice husk activated carbon at high concentration as the carbonization temperature increased [23]. The model describing the response of removal efficiency of the rice husk activated carbon (RH) is described as: |
| Y6RH = 67.81 + 2.42A + 0.88B – 0.74AB (8) |
| The correlation coefficient of (R2) of the equation is 0.7589 while the adjusted correlation coefficient (AR2) and predicted correlation coefficients (PR2) are 0.6932 and 0.6019, respectively; they are in reasonable agreement with each other. The response curve describing the equation is shown in Figure 6. The carbonization temperature (α1 = 2.42) has a higher influence on the removal efficiency of the activated carbon for the removal of naphthalene from simulated wastewater than the influence of initial concentrations (α2 = 0.88) of the adsorbate. This shows that the removal efficiency of the rice husk carbon can be improved at high carbonization temperature and at low concentration of naphthalene [33]. |
| Adsorption of acenaphthene unto flamboyant pod back |
| The coefficient of correlation of the response of adsorption capacity is 0.9994 and the predicted correlation coefficient (PR2) is 0.9993 and it is in reasonable agreement with adjusted correlation coefficient (AR2) (0.990). The response is described by the equation (9) and the response curve describing the equation is shown in Figure 7. |
| Y7FB = 3.00 + 0.17A + 1.46B + 0.093AB (9) |
| The effect of initial concentration (α2 = 1.46) is higher than the effect of carbonization temperature (α1 = 0.17) on the adsorption capacity of carbon derived from flamboyant pod back for adsorption of acenaphthene from simulated wastewater. Furthermore, both carbonization temperature and initial concentration have combine influence for the adsorption of acenaphthene. The correlation coefficient (R2) for the response of removal efficiency of the carbon derived from flamboyant pod back for the removal of acenaphthene from simulated wastewater is 0.9576. The predicted the correlation coefficient (PR2) (0.9009) is in reasonable agreement with the correlation coefficient adjusted (AR2) (0.9460). The response equation is given as: |
|
Y8FB = 60.21 + 3.41A – 1.02B + 0.21AB (10) |
| The response curve describing the equation is shown in Figure 8. The results show that carbonization temperature (α1 = 3.41) has a high positive effect on the adsorption capacity of the activated carbon. Initial concentration, has a high negative influence on the adsorption capacity of the carbon, though, the combine influence of the two factors positively favoured removal efficiency. Carbonization temperature and initial concentration have positive influence on the adsorption capacity of carbon derived from flamboyant pod bark for the removal of naphthalene and acenaphthene from wastewater. However, increasing initial concentration has negative effect on the removal of acenaphthene from the simulated wastewater but it is an influence to be considered for the adsorption of naphthalene unto the carbon. |
| Adsorption of acenaphthene unto milk bush kernel shells |
| The equation describing the response of adsorption capacity of activated carbon derived from milk bush kernel shell for the adsorption of acenaphthene from simulated wastewater is given as: |
|
Y9FB = 2.66 + 0.25A +1.23B + 0.21AB (11) |
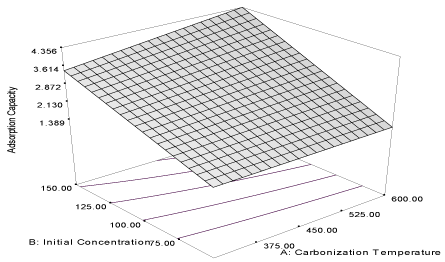
| The coefficient of correlation (R2) of the equation is 0.9996 and the predicted correlation coefficient (PR2) is 0.9993, which are in reasonable agreement with adjusted correlation coefficient (AR2) (0.9995) and the response curve describing the equation is shown in Figure 9. Initial concentration (α2 = 1.23) of acenaphthene in the simulated wastewater has a positive influence on the adsorption capacity of the carbon. It shows that the adsorption capacity increased as the initial concentration increased at a particular carbonization temperature. Influence of carbonization temperature (α1 = 0.25) has a less effect, compared to initial concentration on the adsorption capacity of the carbon, and the combine effect of the two responses (α12 = 0.21) has a lesser effect than the carbonization temperature, though it is a favourable influence [32]. The response of removal efficiency of the activated carbon for the removal of acenaphthene from simulated wastewater is described by the equation (12) and the response curve describing the equation is shown in Figure 10. |
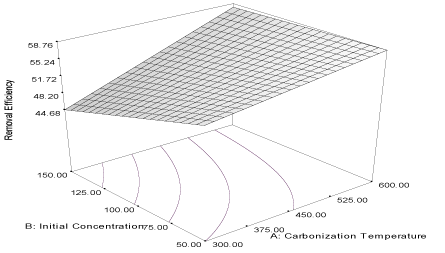
| Y10MB = 53.88 + 4.50A – 2.54B + 2.16AB (12) |
| The carbonization temperature has a high positive influence (α1 = 4.50) on the removal efficiency of the activated carbon while the initial concentration has a high negative influence (α2 = -2.54). It shows that the removal efficiency of the activated carbon can be improved at high carbonization temperature and low initial concentration. This is evident in the combined influence (α12 = 2.16) of the two factors which is relatively high. Thus, the results show close relationship in the responses obtained for the adsorption capacity and removal efficiency of the carbon obtained from milk bush kernel shell for the removal of naphthalene and acenaphthene from simulated wastewater. The adsorption capacities of the carbon for the removal of naphthalene and acenaphthene are positively influenced by carbonization temperature and initial concentration and the two responses compare closely for the two adsorbates [34]. Furthermore, the removal efficiency, as expected, is positively influenced by high carbonization temperature of the activated carbon for the removal of naphthalene and acenaphthene in the simulated wastewater [33]. |
| Adsorption of acenaphthene unto rice husk |
| The correlation coefficient (R2) obtained for the model describing the response of adsorption capacity of rice husk carbon (RH) for adsorption of acenaphthene from simulated wastewater is 0.8472. The predicted correlation coefficient (PR2) (0.6270) is in reasonable agreement with the adjusted correlation coefficient (PR2) (0.8056). The model equation is described as: |
| Y11RH = 3.80 + 0.14A + 1.39B – 0.12AB (13) |
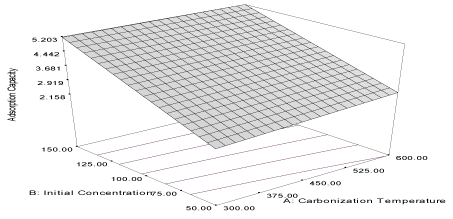
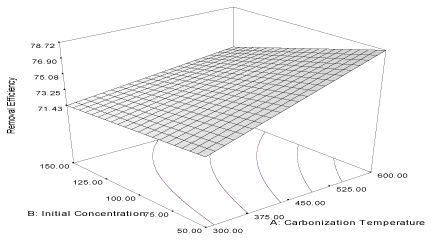
| The response curve describing the equation is shown in Figure 11. The influence of the initial concentration (α2 = 1.39) and carbonization temperature (α1 = 0.14) are more important than the influence of their interaction. (α12 = -0.12). This shows that the capacity of the rice husk increased with increasing concentration of acenaphthene in the simulated wastewater particularly at lower carbonization temperature. However, the combination of the two factors will negatively affect the adsorption capacity of the rice husk activated carbon. The response of removal efficiency of activated carbon derived from rice husk is given by the equation 14 and the response curve describing the equation is shown in Figure 12. |
| Y12RH = 74.09 + 2.19A – 1.46B – 0.99AB (14) |
| The correlation coefficient of the response model equation is 0.8605 and the predicted correlation coefficient (PR2) (0.6880) is in reasonable agreement with the adjusted correlation coefficient (AR2) (0.8224). The removal efficiency of rice husk carbon is positively influenced by carbonization temperature as obtained for other carbons [33]. However, the initial concentration has negative influence on the removal efficiency of the carbon and this indicates that the activated carbon is more efficient at lower initial concentration of acenaphthene. As a result, increasing the initial concentration will reduce the efficiency. The combine influence (α12 = - 0.99) of the two factors has a negative effect on the removal efficiency of the carbon. It shows that the two factors cannot be improved at the same time; one is to be kept at constant while the other is varied [30]. Generally, the adsorption capacities of rice husk carbon for the removal of naphthalene from wastewater are highly influenced by initial concentration of the adsorbate than the carbonization temperature of the rice husk activated carbon [23]. However, the removal efficiency of the carbon is highly influenced by high carbonization temperature and low initial concentration of acenaphthene in the simulated wastewater [33]. |
| Suitability of the software |
| The suitability of the software (Design Expert, Version 6.0.8) is justified by the ratio of adequate precision reported by the software. The adequate precision of the three raw materials for the adsorption of naphthalene ranged from 9.088 to 115.764 while the range obtained for the adsorption of acenaphthene is 12.585 to 280.278. Adequate precision ratio greater than 4 is desirable, thus the ranges (9.088 - 115.764 and 12.585 - 280.278) indicate signal which shows that the models obtained can be used to navigate the design space [29]. Furthermore, based on the value of the correlation of coefficient (R2), the order of suitability of the selected material for the adsorption of naphthalene from simulated wastewater in terms of influence of carbonization temperature is MB > RH > FB (0.9978 > 0.9976 > 0.9970) while the order of influence of initial concentration is MB > FB > RH (0.9622 > 0.8689 > 0.7589). Similarly, for the adsorption of acenaphthene from the simulated wastewater, the order of suitability is MB > FB > RH (0.9996 > 0.9994 > 0.8472) under the influence of carbonization temperature, while under the influence of initial concentration, the order of suitability is MB > FB > RH (0.9710 > 0.9576 > 0.8605). This result further substantiates the efficiency of activated carbon produced from milk bush kernel shell for effective treatment of wastewater containing polyaromatic hydrocarbons, (PAHs) under the influence of increasing carbonization temperature and initial concentration. |
| Conclusion |
| This study was conducted to determine the suitability and the performance of activated carbon produced from flamboyant pod back, milk bush kernel shell and rice husk for the effective removal of naphthalene and acenaphthene from simulated wastewater under the influence of carbonization temperature and initial concentration. The experimental data were subjected to Response Surface 2FI Model using Design Expert software (Version 6.0.8) to validate the responses of adsorption capacity and removal efficiency on the study. The order of suitability of the selected materials for the adsorption of naphthalene from simulated wastewater in terms of influence of carbonization temperature is MB > RH > FB (0.9978 > 0.9976 > 0.9970) while the order of influence of initial concentration is MB > FB > RH (0.9622 > 0.8689 > 0.7589). Similarly, for the adsorption of acenaphthene from the simulated wastewater, the order of suitability is MB > FB > RH (0.9996 > 0.9994 > 0.8472) under the influence of carbonization temperature and while under the influence of initial concentration the order of suitability is MB > FB > RH (0.9710 > 0.9576 > 0.8605). This result further substantiates the efficiency of activated carbon produced from milk bush kernel shell for effective treatment of wastewater containing polyaromatic hydrocarbons, (PAHs) under the influence of increasing carbonization temperature and initial concentration. Thus, milk bush (Thevetia peruviana) kernel shell is a potential waste for the production of adsorbent for the removal of polyaromatic hydrocarbons in wastewater. |
References
|
Tables and Figures at a glance
| Table 1 |
Figures at a glance
 |
 |
 |
 |
| Figure 1 | Figure 2 | Figure 3 | Figure 4 |
 |
 |
 |
 |
| Figure 5 | Figure 6 | Figure 7 | Figure 8 |
 |
 |
 |
 |
| Figure 9 | Figure 10 | Figure 11 | Figure 12 |
Relevant Topics
- Anaerobic Biodegradation
- Biodegradable Balloons
- Biodegradable Confetti
- Biodegradable Diapers
- Biodegradable Plastics
- Biodegradable Sunscreen
- Biodegradation
- Bioremediation Bacteria
- Bioremediation Oil Spills
- Bioremediation Plants
- Bioremediation Products
- Ex Situ Bioremediation
- Heavy Metal Bioremediation
- In Situ Bioremediation
- Mycoremediation
- Non Biodegradable
- Phytoremediation
- Sewage Water Treatment
- Soil Bioremediation
- Types of Upwelling
- Waste Degredation
- Xenobiotics
Recommended Journals
Article Tools
Article Usage
- Total views: 14548
- [From(publication date):
January-2012 - Nov 18, 2025] - Breakdown by view type
- HTML page views : 9876
- PDF downloads : 4672
