Research Article Open Access
Effect of Physico-Chemical Parameters on Crabs Biodiversity
Varadharajan D*, Soundarapandian P and Pushparajan N
Faculty of Marine Sciences, Centre of Advanced Study in Marine Biology, Annamalai University, Parangipettai-608502, Tamil Nadu, India
- *Corresponding Author:
- Varadharajan D
Faculty of Marine Sciences
Centre of Advanced Study in Marine Biology
Annamalai University, Parangipettai-608502
Tamil Nadu, India
E-mail: heartvaradhan@gmail.com
Received date: October 01, 2012; Accepted date: November 12, 2012; Published date: November 16, 2012
Citation: Varadharajan D, Soundarapandian P, Pushparajan N (2013) Effect of Physico-Chemical Parameters on Crabs Biodiversity. J Marine Sci Res Dev 3:116. doi: 10.4172/2155-9910.1000116
Copyright: © 2013 Varadharajan D, et al. This is an open-access article distributed under the terms of the Creative Commons Attribution License, which permits unrestricted use, distribution, and reproduction in any medium, provided the original author and source are credited.
Visit for more related articles at Journal of Marine Science: Research & Development
Abstract
If physico-chemical parameters are not suitable, it will affect the distribution of crabs. So, it is designed to know the effect of physico-chemical parameters on the biodiversity of crabs from Arukkattuthurai to Pasipattinam. Minimum atmospheric temperature was recorded in the months of November and December 26.4°C (stations 2 and 8) and maximum 32.3°C was recorded in the months of April and May (stations 2 and 5). Minimum water temperature was recorded in the month of November 26.3°C (stations 2 and 8) and maximum 31.5°C was recorded in the months of April and May (stations 2 and 5). The salinity was minimum in month of December 25.5% (stations 2, 5 and 9) and maximum was recorded in the month of May 35.5 (stations 2, 5 and 9). The minimum pH 7.6 was recorded in the month November (stations 2, 5 and 8) and maximum was 8.3 in the month of May (stations 2, 5 and 8). Minimum dissolved oxygen 2.58 mg/L was recorded in the month of May (stations 2, 5 and 7) and maximum was 5.83 mg/L recorded in the month of November (stations 2, 5 and 8). Light extension co-efficient was recorded minimum, 1.43 Mcm-1 during the summer season in April (stations 5, 6 and 8), and maximum 7.95 Mcm-1, during monsoon season in November (stations 5, 6 and 8). The minimum turbidity 24.0 NTU was recorded during the monsoon in April (stations 2, 3 and 5) and maximum 35. 0 NTU was recorded during summer in December (stations 2, 3 and 5).
Keywords
Physico-chemical; Crab; Biodiversity; Distribution; Affect
Introduction
The coastal ecosystems provide food and other resources, waste disposal, recreation and inspiration [1]. The crustaceans are highly sensitive to pollution [2-4], and their distributions are strongly influenced by the physico-chemical parameters [5]. Nutrients in coastal waters have caused a number of environmental problems, such as death of benthic fauna, decapod crabs occurrence of nuisance algal blooms [6,7], and the disappearance of seagrass and mangroves [7]. Physico-chemical variations induce changes in immune status of crustaceans. These physico-chemical variations are often stressing crustacea, resulting in a reduction of immune vigour. Water quality monitoring has one of the highest priorities in environmental protection policy. The main objective is to control and minimise the incidence of pollutant oriented problems, and to provide water of appropriate quality to serve various environmental purposes [8,9]. The environmental parameters of coastal areas are very important, because the variations in the physico-chemical properties, such as temperature, salinity, pH, dissolved oxygen and nutrients influence on the crustaceans abundance and life cycles. So, in the present study, effect of physico-chemical parameters on the biodiversity of crabs was studied all along Arukkattuthurai to Pasipattinam coast.
Materials and Methods
The physico-chemical parameters were selected for ten different stations viz., Arukkattuthurai (Station-1), Pointcalimere (or) Kodikkarai (Station-2), Muthupettai (Station-3), Adirampattinam (Station-4), Mallipattinam (Station-5), Sethubavachatram (Station-6), Kattumavadi (Station-7), Manamelkudi (Station-8), Jegathapattinam (Station-9) and Pasipattinam (Station-10). The rainfall data were collected from the meteorological unit (Govt. of India). The surface water samples were collected monthly from all stations (stations 1 to 10) during the study period, from January 2010 to December 2010. The temperature (Atmospheric and Water) and pH were recorded immediately after collection, using a standard centigrade thermometer of 0.01°C accuracy and a field pH ELICO Grip pH meter (Model LC-12 0), respectively. Light penetration in the water column was measured with the help of a Secchi disc, and the Light Extinction Co-efficient (LEC) was calculated using Poole and Atkins [10] formula. Salinity was determined by a Refrectometer (Model-2, ERMA, Japan), while Winkler’ method [11] was adopted for oxygen determination, and turbidity was determined by using the standard Turbidity meter (LP- 2000).
For the analysis of nutrients, surface water samples were collected in clean polythene bottles and kept immediately in an icebox, and transported to the laboratory. The water samples were than filtered using a Millipore filtering system and analyzed for dissolved inorganic phosphate, nitrate, nitrite, reactive silicate and ammonia, by adopting standard procedure of Strickland and Parsons [11]. All the statistical analysis was performed by using SPSS 16 software, particularly Box Plot Method.
Results
Rainfall
Total rainfall recorded from the study area was on average of 788 mm. Minimum rainfall was recorded during the month of March (27.5 mm), and maximum rainfall was recorded during the month of November (289.1 mm) in all stations. There was no rainfall during January, February, April and May.
Atmospheric temperature
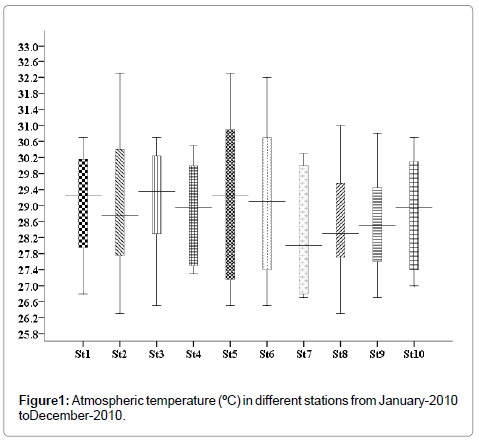
In the present study, minimum atmospheric temperature was recorded in the months of November and December 26.4°C (stations 2 and 8), and maximum 32.3°C was recorded in the months of April and May (stations 2 and 5) (Figure 1).
Water temperature
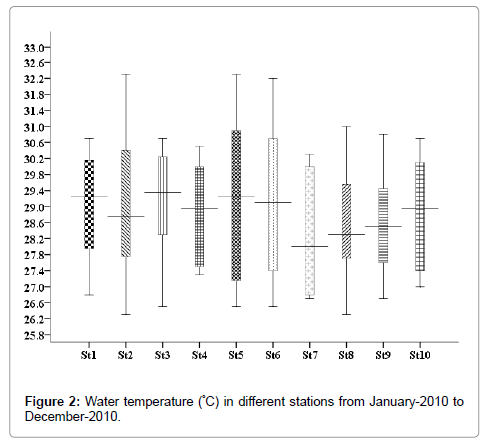
In the present study, minimum water temperature was recorded in the month of November 26.3°C (stations 2 and 8), and maximum 31.5°C was recorded in the months of April and May (stations 2 and 5) (Figure 2).
Salinity (%)
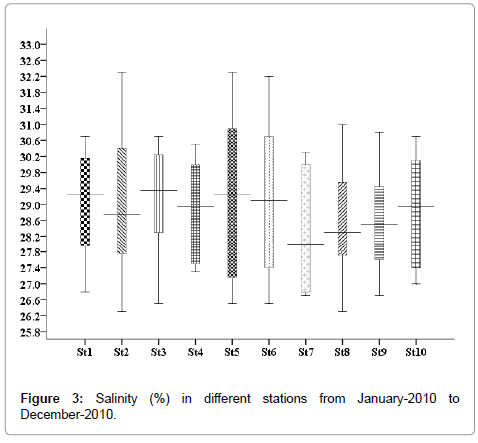
The salinity was minimum in the month of December 25.5% (stations 2, 5 and 9) and maximum was recorded in the month of May 35.5% (stations 2, 5 and 9) (Figure 3).
pH (Hydrogen ion concentration)
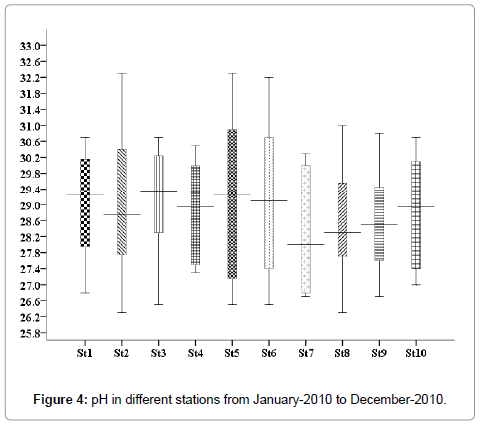
The minimum pH 7.6 was recorded in the month November (stations 2, 5 and 8), and maximum was 8.3, recorded in the month of May (stations 2, 5 and 8) (Figure 4).
Dissolved Oxygen (mg/L)
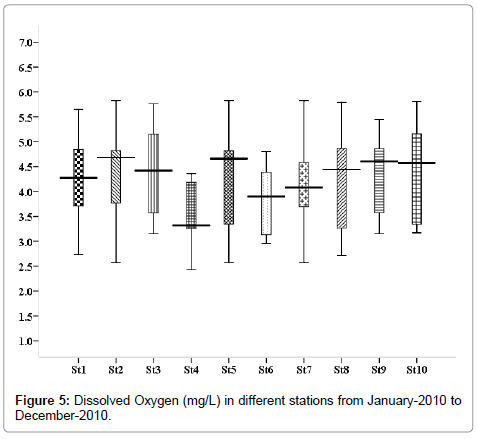
The minimum dissolved oxygen 2.58 mg/L was recorded in the month of May (stations 2, 5 and 7), and maximum was 5.83 mg/L, recorded in the month of November (stations 2, 5 and 8) (Figure 5).
Light extinction co-efficient (Mcm-1)
Light extinction co-efficient was recorded minimum 1.43 Mcm-1 during the summer season in April (stations 5, 6 and 8), and maximum 7.95 Mcm-1 during monsoon season in November (stations 5, 6 and 8) (Figure 6).
Turbidity (NTU)
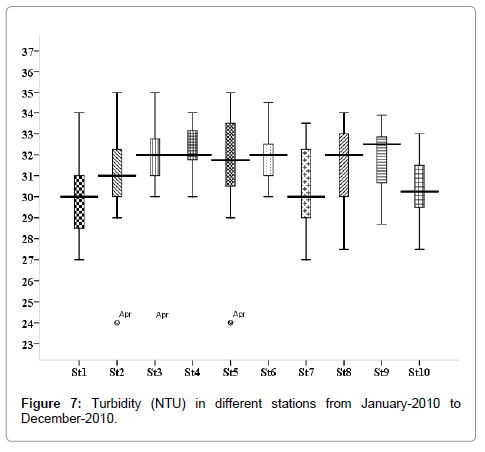
The minimum turbidity 24.0 NTU was recorded during the monsoon in April (stations 2, 3 and 5), and maximum 35.0 NTU was recorded during summer in December (stations 2, 3 and 5) (Figure 7). Outliers show to the extreme levels of the values.
Total suspended solids (mg/L)
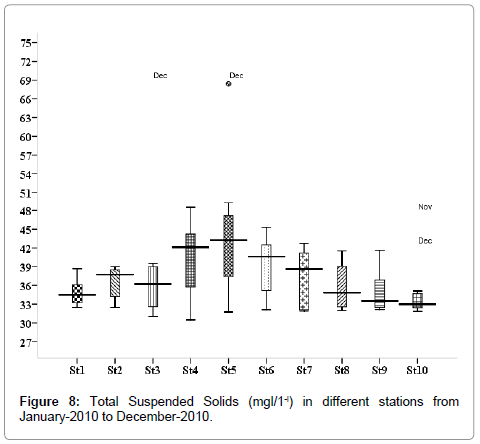
The total suspended solids were varied from 31.75 to 68.4 mg/L. Minimum was recorded during the post monsoon season in January (stations 2, 3 and 5), and maximum during the monsoon season in December (stations 2, 3 and 5) (Figure 8). Outliers show to the extreme levels of the values.
Biological oxygen demand (mg/L)
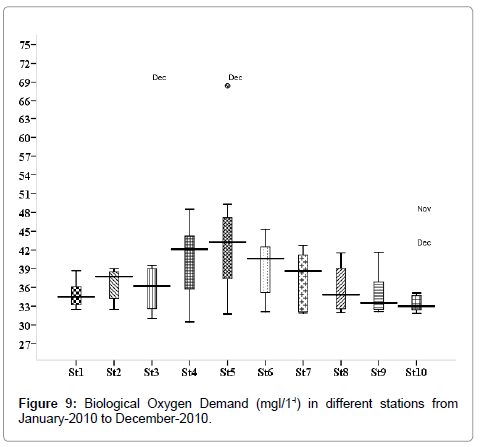
The BOD values were varied from 1.137 to 3.214 mg/L. Minimum was recorded during monsoon season in November (stations 2, 3 and 5), and maximum during April (stations 2, 3 and 5) (Figure 9). Outliers show to the extreme levels of the values.
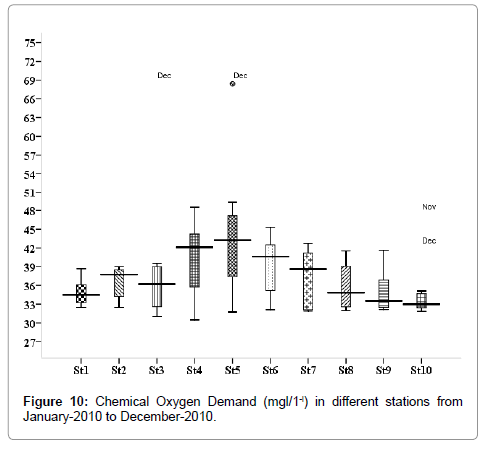
Chemical oxygen demand (mg/L)
The COD values were varied from 0.248 to 0.572 mg/L. Minimum was recorded during monsoon in December (stations 2, 3 and 5), and maximum during the summer season in June (stations 2, 3 & 5) (Figure 10). Outliers show to the extreme levels of the values.
Nutrients
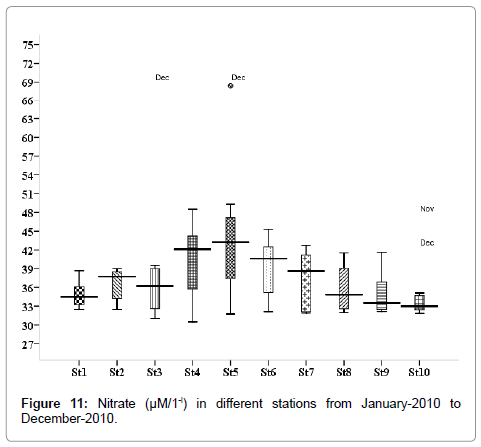
Nitrate (μM/1-l): Nitrate concentration was varied from 0.317 to 5.214 μM/1-l. Minimum was recorded during summer season in April (stations 2, 3 and 5), and maximum during monsoon season in November (stations 2, 3 and 5) (Figure 11). Outliers show to the extreme levels of the values.
Nitrite (μM/1-l)
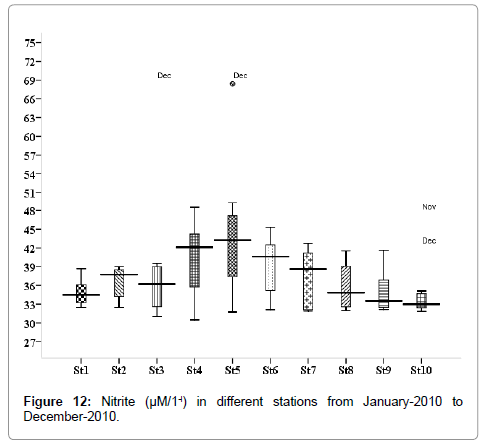
Nitrite concentration was varied from 0.281 to 3.572 μM/1-l. Minimum was recorded during May (stations 2, 3 and 5) and maximum during November (stations 2, 3 and 5) (Figure 12). Outliers show to the extreme levels of the values.
Ammonia (μM/1-l)
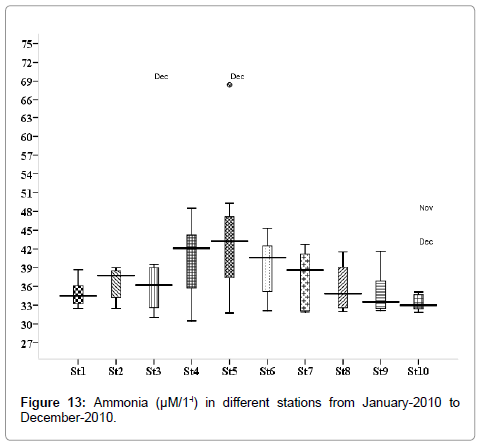
The ammonia concentration was varied from 0.845 to 3.423 μM/1-l. Minimum was recorded during postmonsoon in March (stations 2, 3 and 5), and maximum during November (stations 2, 3 and 5) (Figure 13). Outliers show to the extreme levels of the values.
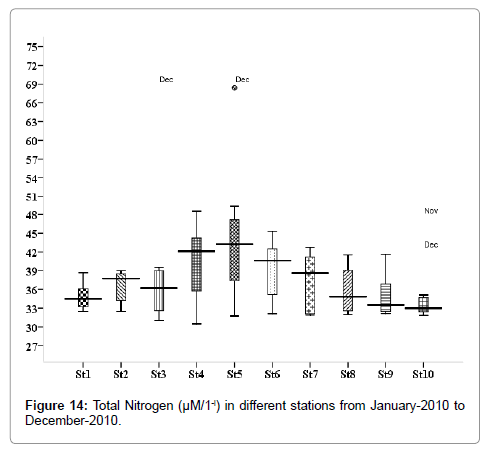
Total Nitrogen (μM/1-l)
The total nitrogen level was ranged from 5.217 to 25.32 μM/1-l. Minimum was recorded in August (stations 2, 3 and 5), and maximum in November (stations 2, 3 and 5) (Figure 14). Outliers show to the extreme levels of the values.
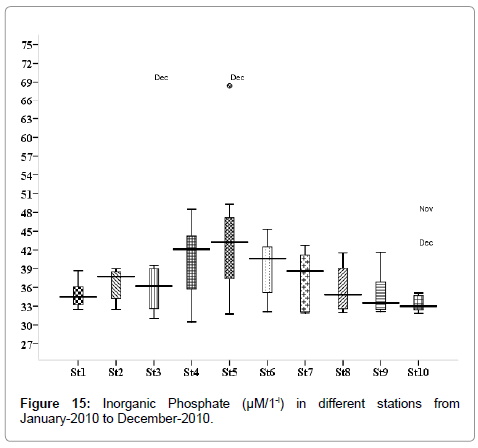
Inorganic phosphate (μM/1-l)
The phosphate concentration was recorded minimum 0.259 μM/1-l during the post monsoon season in January (stations 4, 7 and 10), and maximum 4.96 μM/1-l during monsoon season in November (stations 2, 3 and 6) (Figure 15). Outliers show to the extreme levels of the values.
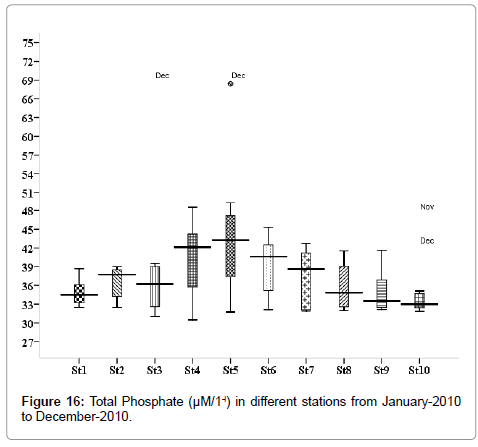
Total Phosphate (μM/1-l)
The total phosphate level was ranged from 0.312 to 2.69 μM/1-l. Minimum was recorded in May (stations 2, 3, 5 and 9), and maximum in November (stations 2, 3, 5 and 9) (Figure 16). Outliers show to the extreme levels of the values.
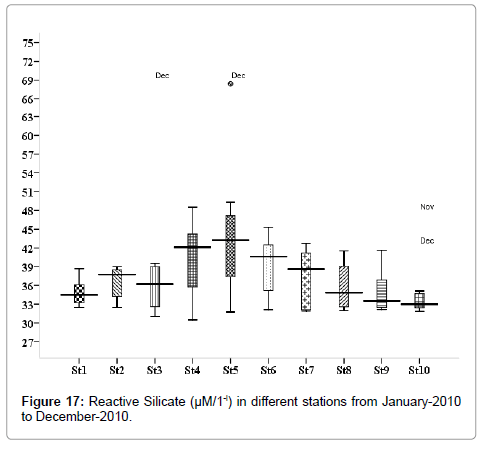
Reactive silicate (μM/1-l)
Reactive silicate concentration was varied from 1.173 to 3. 021 μM/1-l. Minimum was recorded during post monsoon in March (stations 1, 3 and 6), and maximum during monsoon season in December (stations 1, 3 and 6) (Figure 17). Outliers show to the extreme levels of the values.
Discussion
Climate change is an important factor in determining the past and future distributions of crab biodiversity [12-15]. Crustaceans life patterns are strongly related to environmental factors [16,17]. The eutrophication is also spoiling the biodiversity [18]. Physical and chemical factors are highly affected by crustacean’s inhabitants. This study is agreement with earlier studies [19,20]. In general, the organic waste dump caused environmental stress in coastal waters, which resulted to low landing of important crustacean fisheries, and affect the diversity of decapod crabs [21-23]. The physico-chemical parameters are vital ecological factors, as it directly affects oxygen consumption, metabolism, growth, moulting, hormones and survival of crustaceans [24,25].
Rainfall is one of the important factors, which affect the distribution of aquatic animals. The substances present in the air are affected, and also toxic gases and chemicals dissolved so far, entrapped in rain activities. The mangroves, seagrass, salt marshes and coral reef also contaminated due to raining activities [26,27]. Especially where the large freshwater rivers enter the sea, turbid waters are thick with sediment during the annual monsoon season. Huge volumes of water carry huge volumes of phosphate loaded mud, especially off agricultural land, by increasing the concentrations of such substance as nutrients. This could be a major problem for the seagrass and coral reef associated decapods. It makes a great difference of temperature, salinity and turbidity as important factors associated with crustacean’s abundance [28].
In the present study, summer peaks and monsoonal troughs in air and surface water temperatures were observed by several workers from southeast coast of India [29,30]. Tides controlled changes in temperature are distinct during monsoon months, but during other months, heating of the surface water by solar radiation greatly over shadowed the small changes in temperature, such as those induced by tides. The temperature spread of the spring may be the result of the influx of heat from the sun and atmosphere. It is a limiting factor in the aquatic environment. It will affect the metabolic activities, growth, oxygen consumption, reproduction, moulting, survival, distribution and migratory behaviours of crustaceans [31]. The temperature increased blood cell numbers [32], affects blood clotting times [33] and also the phagocytosis [34], affects the antibacterial activity by haemocytes [35], reduction of metabolic rate [36], and change in osmotic pressure of the haemolymph [37]. It has been direct effect on other environmental parameters, such as salinity and oxygenation of the water. The effects of rain on the physiology of aquatic organisms are discussed [38,39] in Penaeus notalis [40], P. indicus [41], Macrobrachium olfersii [42], and in gammarid, Echinogammarus berrilloni [43].
The salinity is an ecological master factor in the distribution of living organisms, likely to influence decapod crabs distribution and production of the coastal ecosystems [44]. The salinity was found to be high during summer season and low during the monsoon season at the stations [45]. The spectral distribution clearly shows that the premonsoon and summer as the season of abundance and minimum catch, and also no catch during monsoon and spring. As a direct relationship between the trawl catches and salinity, temperature as well as plankters, and an inverse relationship between the rainfall and trawl catches. This is agreement with earlier studies by Sudarsan [46], John Samuel et al. [47] and Varadharajan et al. [48]. The monsoon is the period of spawning of decapod crabs, and the spawning activity is related to the intensity of rainfall. The lower temperature and salinity conditions prevailing throughout the period may be the causative factors of spawning [49-51]. Even in the same position, the size at maturity of individual species of the decapod crabs may vary because the moult occurs over a wide range of size. The fast moulting may possible be fast for a considerable amount of time, when the breeding activity is high [52,53].
The pH is another important parameter affecting crab diversity and distribution in an ecosystem. The uptake of CO2 by the photosynthesizing organisms, especially phytoplankton from the sea, could have increased the pH levels. It can be due to the influence of seawater penetration and high biological activity [54], and photosynthetic activity [55]. It was also quite low during floods in the peak monsoon season, reduction of salinity and temperature, and decomposition of organic matter [56]. The alkaline pH was found to be associated with more number of crab species. However, with increasing pH, the number of species has been reported to decrease [54]. In decapods, pH influences the metabolism, physiology and maturation process [57].
One of the most important abiotic factors influencing young stages, such as zoea and megalopa in aquatic ecosystem, is the dissolved oxygen [58]. This parameter is more critical because it shows whether there is sufficient oxygen in the water for marine life to survive. Pollution is manifested in the low dissolved oxygen levels and in high nutrient levels in these waters, which can lead to an imbalance of crustacean’s communities through the food web. Do concentrations clearly influence the behaviour of decapods [59,60], and life strategies on the basis of oxygen consumption and energy content [61]. Many previous studies reported that oxygen deficiency and stress condition of crustaceans [2,62]. In summer season, dissolved oxygen decreased due to increased temperature and salinity of water [63], this is attributed to the lesser input of freshwater into the study areas [64]. The current and its associated transport of oxygen and food materials strongly influence the growth of decapod species. Oxygen consumption has been reported in several authors in many species of crustaceans [65,66]. The respiration rates influence the metabolism in crustaceans [67-69], and anaerobic metabolism [67,70], will reduce growth and moulting frequency [71], and cause mortality [72], reduction of metabolic rate [36], and change in osmotic pressure of the haemolymph [37].
Light extinction co-efficient at sampling area was high during the monsoon season due to the monsoonal rains, coupled with low intensity of solar radiation and higher concentration of dissolved organic matter and suspended sediments, which resulted in increased turbulence in the water. The post monsoon season at the sampling area due to the removal of suspended materials from the water column and cessation of freshwater flow, reduces the abiogenic turbidity [73]. The marine invertebrates, light from a significant external signal [74] to control various reproductive activities [75]. The initiation and synchronization of spawning, gonad maturation and sex determination are lightdependent reproductive activities and appear to be mediated through photo-neuroendocrine pathways [76]. The extension of photoperiod lengthens the period of reproduction and delays the moult [77]. In decapod crustaceans such as Pachygrapsus marmoratus [78] and Palaemonetes pugio [79], the administration of longer photoperiod accelerates reproduction. The above mentioned examples clearly suggest the role of day length on the initiation of reproductive processes in lower, as well as higher crustaceans.
Surface water temperatures increased and decreased generally day by day in the study periods. The temperatures in the low tide were generally higher than those in high tide. The variation of the turbidity in the sea may be fairly complicated in the near shore region. Since, the high turbidity reduces the growth of phytoplankton, seaweeds and zooplankton; so naturally, numerical density and biomass of decapods species also reduced [80]. The meteorological conditions, especially the strong wind, affect changes of the turbidity. High values were associated with heavy freshwater flow and turbidity during the northeast season. Besides, this visibility as well was poor due to the cloudy weather, towards the end of December. Soil conditions, organic matter, plankters and other minute organisms cause turbidity in water, recognized as a valuable limiting factor in the crustacean’s productivity of water bodies [81]. So, the provisional changes are mostly observed and sensitive sites almost immediately, leaving the polluted area [3]. The relation between the fishing conditions and oceanographical conditions, especially the turbidity was little understood, because of the unfavorable meteorological conditions.
The total suspended solids degrade optical water quality by reducing water clarity and decreasing light available to support photosynthesis [81]. TSS levels and fluctuations influence aquatic life, from phytoplankton to crustaceans. It is especially when the individual particles are small; carry many substances that are harmful or toxic. As a result, suspended particles are often the primary carrier of these pollutants to coastal zones of oceans where they settle. In coastal zones, these fine particles are food source for filter feeders, which are part of the food chain, leading to biomagnification of chemical pollutants in crustaceans and ultimately, in man. In intertidal area, however, deposition of fine particles effectively removes pollutants from the overlying water by burying them in the bottom sediments of the coastal zones. In coastal areas where erosion is a serious problem, suspended solids can blanket the coastal bed, thereby, destroying crustacean’s habitat [82].
The low BOD values recorded during the monsoon season in the sampling areas indicated effective assimilation of organic load. Biochemical oxygen demand is the amount of oxygen utilized by microorganisms to stabilize the organic matter [64]. This process can severely reduce the available oxygen, so that crustaceans and other aquatic life are suffocated. In crustaceans, the oxygen uptake of Pachygrapus crassipes and Gecarcinus lateralis was found to rise slowly from the intermoult, until few days after moult. The oxygen consumption of C. sapidus from proecdysis to postecdysis was studied by Elizabeth et al. [83]. Taylor [84] reported the respiratory responses of C. meanus to changes in environmental salinity. Effect of temperature, salinity on oxygen consumption in a freshwater population of Paleamonetes antennarius was revealed by Giuseppe [85]. Davenport and Wong [86] have studied the behaviroural responses of S. serrata to salinity and low oxygen tension.
The COD is a measure of the oxygen equivalent of the organic matter content of water that is susceptible to oxidation by a strong chemical oxidant. Maximum COD values were observed during summer seasons because of decrease in land wastes inflow, so far increases in temperature, salinity and plankters productivity and oxygen utilization of microbes involved in decomposition activities, and also due to the cumulative effect of higher wind velocity [54,87]. Minimum values of COD was observed during the monsoon season because of the presence of heavy river run off, increased mixing of land wastes into the coast and decreased biological activity because of decreased temperature and salinity. Thus, COD is a reliable parameter for judging the extent of pollution in water [82]. The COD of water increases with increasing concentration of organic matter [54].
High concentration of nitrate observed during the monsoon season might be due to the heavy rainfall and wastes [88]. The minimum concentration of nitrate observed during the summer season could be due to its utilization by phytoplankton, as evidenced by their high population density and also decreased freshwater flow during this period [30]. The marine systems are generally nitrogen limited, excessive nitrogen inputs can result in water quality degradation due to toxic algal blooms, oxygen deficiency, habitat loss, decreases in biodiversity and fishery losses.
The higher nitrite values recorded during monsoon season in the month of November could be due to the increased planktonic excretion, oxidation of ammonia and reduction of nitrate, by recycling of nitrogen, and also due to bacterial decomposition of plankton detritus present in the environment [89]. Further, the denitrification and air sea interaction exchange of chemicals are also responsible for this increased value [90]. The low nitrite value recorded during summer season may be due to less freshwater inflow and high salinity [91]. Maximum nitrite values recorded in monsoon season could be mainly due to the organic materials received from the catchments areas during the receding or outgoing tide [54,91]. Further, excretion of phytoplankton, reduction of nitrate and oxidation of ammonia could all contribute together or individually to increase the concentration of nitrite in the environment [92]. The nitrites are probably the most important environmental variable, because it directly affects the behavior, influencing growth, reproduction, metabolic activities, and abnormal conditions of crustaceans inhabitants.
Algae blooms cloud the water, blocking the light from reaching important underwater grasses that provide food and habitat for zoea to adult crustaceans. Changing the type of nitrogen entering the water from nitrate to ammonia may also cause a fundamental change in the algae community, the building block for the aquatic food web. Species that best accumulate ammonia may be different from those that have thrived on nitrate [30]. Algae fueled by too many nutrients are the largest water quality problem in the environment. The blooms provide food and shade, prevent the growth of undesirable benthic algae, reduce toxic ammonia concentrations and increase oxygen levels. Ammonia is toxic to aquatic life, which affects crustaceans in various ways, such as food into the energy, nutrients and proteins they use for survival and growth, and also cause impairment in numerous organs [93]. Lethal and sub-lethal effects of ammonia on crustaceans, with respect to metabolism and osmoregulation were studied by Chen and Lei [94]. Higher concentration of ammonia was observed during the monsoon season in all sampling stations, but reported in higher values in few sites (2, 3 and 5), particularly in the month of November. Lower concentration of ammonia was observed during the postmonsoon season in all sampling stations, at the same time reported in lower values in few sites (2, 3 and 5), mainly in the month of March. The higher concentration could be partially due to the death and subsequent decomposition of phytoplankton, and also due to the excretion of ammonia by plankton as opined by Segar and Hariharan [95].
The main cause of eutrophication involves the enrichment of water by excess nutrients. It can cause serious problems in the coastal zone through disturbance of ecological balances and fisheries, ultimately interfering with recreational activities, and also quality of marine life [96]. Due to combination of processes affecting the nitrogen cycle in water, the reduction of nitrogen from agricultural lands to coastal ecosystem is observed. It has important indirect effects, such as sea grasses provide food and shelter for crustaceans cause many diseases. In the present study, total nitrogen in water was high during the monsoon season, especially in the month of November. Lower concentration was observed in the month of August. The higher concentration of nitrogen is due to release from the decay of a large number of phytoplankton [97].
High concentration of phosphate was recorded in the present study during monsoon season, might have resulted from the regeneration of phosphate from the bottom muds, and subsequent release of the same in water column by turbulence and mixing caused by heavy winds prevailing during rainy season. Low concentration of phosphate was observed during the post monsoonal season due to the decreased land drainage, sewage and fertilizer disposal from the agricultural lands. As the water masses are without stratification throughout the year, and are in constant contact with the bottom, the regeneration of phosphate taking place at the bottom is constantly utilised by the phytoplankton. The seasonal variations in the phosphate content of the coastal waters have been conducted by Marichamy and Siraimeetan [98] at Madras, Jayaraman [99], in Gulf of Mannar and Palk Bay, George [100] and Subrahmanyan [101] at Calicut by Reddy et al. [102] for the shelf waters of the Arabian Sea, Seshappa and Jayaraman [103] have studied the phosphates in the mud banks at Calicut and Qasim [104] in the cochin backwaters.
The reactive silicate was maximum in the monsoon season, mainly in the month of December, may be due to heavy inflow of monsoonal freshwater derived from land drainage carrying reactive silicate, leached out from rocks. Further, due to the turbulent nature of water, the reactive silicate from the bottom sediment might have been exchanged with overlying water [105]. In addition to phytoplankton uptake, some other processes like absorption and co-precipitation of soluble silicon might also govern the distribution of dissolved reactive silicate in the environment [90]. The low postmonsoon values could also be attributed to uptake of reactive silicates by phytoplankton for their biological activity [106].
The pollution is due to many pathogens, as well as toxic chemicals can exert harmful effect on crustaceans, and also the health of consumers [107]. The contaminated food, sediment, suspended particles as well as water [108,109], contribute to the bioaccumulation of these compounds in crustaceans. Crustaceans have been unlocking vascular systems, in which many haemocytes generously flow in haemolymph [110,111]. Circulating haemocytes of the immune, functions against parasites and microbes [112]. Since, the moult cycle influences the status of a number of physiological processes, and since, an animal’s physiology influences its behavior and its interaction with its environment also the affected haemocyte antibacterial activity of decreased immune mechanism of decapods [113,114].
Crabs are opportunistic omnivores, eating on a variety of foods, with a preference for plants and animal food, in general. Many crabs are not bottom dwellers. These are the active swimmers, living near the surface, feeding on plankton. The abundance of invertebrate that are known as major copepod grazers, such as chaetognaths, ctenophores and medusae, as suggested by Roff et al. [115] and Mills [116]. Availability plants materials are one of the important factors determining the special composition and diversity of crustaceans [117,118]. The mangrove, seagrass beds and salt marshes are acting as a nursery ground, which provide feed for zoea, megalopa, adult and all stages of the decapod crabs. Zooplankton communities in coastal area such as periphyton, along with protozoans, bacteria and detritus, can serve as an indirect food source for crustacean’s young stages to adult. Utilising the high level of nutrients available in the surface waters, the chlorophyll concentration in diatoms proliferate and occur in high abundance [119,120]. This study is agreement with earlier studies [13,121].
In a coastal ecosystem, zooplankton forms an important link in the food chain, from primary to tertiary level leading to the production of crustacean’s fishery. It has been well established that potentials of pelagic crustaceans, either directly or indirectly, depend on zooplankton [122]. By asset of sheer profusion and intermediatary role between phytoplankton and crustaceans, they are considered as the chief index of utilization of aquatic biotope at the secondary trophic level. The herbivorous zooplanktons are efficient grazers of the phytoplankton, and have been referred to as living machines transforming plant material into animal tissue. Hence, they play an important role as the intermediaries for nutrients and energy transfer between primary and tertiary trophic large density, shorter life span, drifting nature, high group and species diversity levels [123]. Due to their and different tolerance to the stress, they are being used as the indicator organisms for the physical, chemical and biological processes in the aquatic ecosystem [124]. Although most of the species of plankters are helpful in fisheries, a few are detrimental to the fishery potential. The copepods have been considered as being primarily major grazers on phytoplankton in most marine ecosystems [125]. It has been grazers of phytoplankton, but also as being an important copepod prey [126]. Certain zooplankton predators, such as decapod larvae, arrow worms and the copepods may voraciously feed on megalopa, decimating the adult crab’s population. The dominant grazers of phytoplankton, copepods, in turn, function as prey for crustaceans also provided in energy and support developmental stages [117], and are natural feed on crustaceans [127]. This study is in agreement with earlier studies [128,129]. In the present study, physico-chemical parameters showed exceptional values in some locations, and also these could be compared to the effect of decapod crab diversity for different manner in this coastal environment. Marine crustaceans are under the influence of numerous environmental factors. The awareness needed in belongings of over exploitation and pollution is increasingly obvious and serious, as for loss of food species, microbial diseases of marine decapods, contamination of edible crustaceans. However, in marine crustaceans, there is a scarcity of data to support the assumption that environmental changes induce a modification of the pollution, leading to an enhanced susceptibility to infectious disease agents.
References
- Uthoff D (1996) From traditional use to total destruction forms and extent of economic utilization in the Southeast Asian mangroves. Nat Res Dev 43: 58-97.
- DelValls TA, Conradi M, Garcia-Adiego E, Forja JM, Gomez-Parra A (1998) Analysis of macrobenthic community structure in relation to different environmental sources of contamination in two littoral ecosystems from the Gulf of Cadiz (SW Spain). Hydrobiologia 385: 59-70.
- Bat L, Akbulut M, Sezgin M, Culha M (2001) Effects of Sewage Pollution the Structure of the Community of Ulva lactuca, Enteremorpha linza and Rocky Macrofauna in Disliman of Sinop. Turk J Biol 25: 93-102.
- Guerra-Garcia JM, Garcia-Gomez JC (2004) Crustacean assemblages and sediment pollution in an exceptional case study: A harbour with two opposing entrances. Crustaceana77: 353-370.
- Sindermann CJ (1979)Pollution-associated diseases and abnormalities of fish and shellfish: a review. Fish Bull 76: 717-749.
- Lapointe BE, Barile PJ, Matzie WR (2004) Anthropogenic nutrient enrichment of seagrass and coral reef communities in the lower Florida Keys: Discrimination of local versus regional nitrogen sources. J Exp Mar Biol Ecol308: 23-58
- IMA (2006) Development of a National Programme of Action (NPA) for the protection of the marine environment from land-based sources and activities. Background paper by The Institute of Marine Affairs of Trinidad and Tobago.
- Bockstael NE, Hanemann WM, Kling CL (1987) Estimating the value of water quality improvements in a recreational demand framework. Water Resour Res23: 951-960.
- Sargaonkar A, Deshpande V (2003) Development of an overall index of pollution for surface water based on a general classification scheme in Indian context. Environ Monit Assess 89: 43-67.
- Poole HH, Atkins WRG (1929) Photoelectric measurements of submarine illumination throughout the year. J Mar Biolog AssocUK 16: 297-324.
- Strickland JDH, Parsons TR (1972) A practical hand book of seawater analysis. (2nd edition), Bulletin (Fisheries Research Board of Canada), Ottawa, Fisheries Research Board of Canada.
- Vernberg FJ, Vernberg WB (1970) Lethal limits and the zoogeography of the faunal assemblages of coastal Carolina waters. Mar Biol 6: 26-32.
- Peterson BJ, Howarth RW (1987) Sulfur, carbon, and nitrogen isotopes used to trace organic matter flow in the salt-marsh estuaries of Sapelo Island, Georgia. Limnol Oceanogr 32: 1195-1213.
- Root TL, Price JT, Hall KR, Schneider SH, Rosenzweig C, et al. (2003) Fingerprints of global warming on wild animals and plants. Nature 421: 57-60.
- Rosenzweig C, Karoly D, Vicarelli M, Neofotis P, Wu Q, et al. (2008) Attributing Physical and Biological Impacts to Anthropogenic Climate Change. Nature 453: 353-357.
- Macpherson E (2002) Large-scale species-richness gradients in the Atlantic Ocean. Proc Biol Sci 269: 1715-1720.
- Hiddink JG, Ter Hofstede R (2008) Climate induced increases in species richness of marine fishes. Glob Chang Biol 14: 453-460.
- Elmanama AA, Afifi S, Bahr S (2006) Seasonal and spatial variation in the monitoring parameters of Gaza Beach during 2002-2003. Environ Res 101: 25-33.
- Collins VG (1983) The distribution and Ecology of Bacteria in freshwater. Proceedings Soil Water Treatment and Examination 12: 40-73.
- Mukhtar MD, Deeni YY (1998) Microbiological and Physicochemical. Studies on Salata river, South-Central Kano Metropolis, 9th/10th Annual conferences, Proceedings: Nigerian Ass Aquat Sci 241-250.
- Wyatt T, Yolarda P (1992) Harmful algal bloom: UNESCO, An IOC Newsletter on topic Algae and Algal bloom 62: 1-8.
- Appasamy P, Lundqvist J (1993) Water supply and wastes disposal strategies for Madras. Ambio 22: 442-448.
- Lemly AD (1996) Wastewater discharges may be most hazardous to fish during winter. Environ Pollut 93: 169-174.
- Chen S, Wu J, Huner JV, Malone RF (1995) Effects of temperature upon ablation-to-molt interval and mortality of red swamp crawfish (Procambarus clarkii) subjected to bilateral eyestalk ablation. Aquaculture 138: 191-204.
- Medesani DA, López Greco LS, Rodríguez EM (2001) Effects of cadmium and copper on hormonal regulation of glycemia by the eyestalks in the crab Chasmagnathus granulata. Bull Environ Contam Toxicol 66: 71-76.
- Lipp EK, Farrah SA, Rose JB (2001) Assessment and impact of microbial fecal pollution and human enteric pathogens in a Coastal Community. Mar Pollut Bull 42: 286-293.
- Boehm AB, Grant SB, Kim JH, Mowbray SL, McGee CD, et al. (2002) Decadal and shorter period variability of surf zone water quality at Huntington Beach, California. Environ Sci Technol36: 3885-3892.
- Ryther JH, Hall JR, Pease AK, Bakun A, Jones MM (1966) Primary organic production in relation to the chemistry and hydrography of the western Indian Ocean. Limnol Oceanogr 11: 371-380.
- Prabha Devi L (1986) Environmental inventory of tidal and gradient zones of Coleroon estuary, southeast coast of India, Ph.D. Thesis, Annamalai University 241.
- Vasantha K (1989) Studies on hydrobiology and decomposition of macrophytes in Portonovo marine environment Southeast coast of India. Ph.D. Thesis, Annamalai University, India 252.
- Le Moullac G, Haffner P (2000) Environmental factors affecting immune responses in Crustacea. Aquaculture 191: 121-131.
- Truscott R, White KN (1990) The influence of metal and temperature stress on the immune system of crabs. Funct Ecol 4: 455-461.
- Dean JM, Vernberg FJ (1966) Hypothermia and blood of crabs. Comp Biochem Physiol17: 19-22.
- Paterson WD, Stewart JE (1974) In vitro phagocytosis by hemocytes of the American lobster (Homarus americanus). Journal of the Fisheries Research Board of Canada31: 1051-1056.
- Chisholm JRS, Smith VJ (1994) Variation of antibacterial activity in the haemocytes of the shore crab, Carcinus maenas, with temperature. J Mar Biolog Assoc U.K. 74: 979-982.
- Hill AD, Taylor AC, Strang RHC (1991) Physiological and metabolic responses of the shore crab Carcinus maenas (L.) during environmental anoxia and subsequent recovery. J Exp Mar Biol Ecol 150: 31-50.
- Charmantier G, Soyez C, Aquacop (1994) Effect of molt stage and hypoxia on osmoregulatory capacity in the peneid shrimp Penaeus vannamei. J Exp Mar Biol Ecol 178: 233-246.
- Prosser CL, Brown FA (1961) Comp Ani Physiol. (2nd Ed.), W.B. Saunders Co., Philadelphia, USA.
- Kinne O (1970) Environmental factors. Part I (Ed), Wiley Interscience, London.
- Ramos Trujillo L, Oliva Suarez M (1984) Energetic metabolism of juveniles of pink shrimp Penaeus notialis. Rev Invest Mar5: 35-36.
- Kutty MN, Murugapoopathy G, Krishnan TS (1971) Influence of salinity and temperature on the oxygen consumption in young juveniles of Indian prawn Penaeus indicus. Mar Biol 11: 125-131.
- McNamara JC, Moreira GS, Moreira PS (1983) The effect of salinity on respiratory metabolism, survival and moulting in the first zoea of Macrobrachium amazonicum (Heller) (Crustacea, Palaemonidae). Hydrobiologia 101: 239-242.
- Ciavatti G, Vincent M (1982) Comparative study of the respiratory metabolism of two populations of Gammaridae: Gammarus pulex and Echinogammarus herilloni. Ann Stu Biol Bessee-en-chandesse 16: 158-170.
- Chandra Mohan P, Sreenivas N (1998) Diel variations in zooplankton populations in mangrove ecosystem at Gaderu canal, Southeast coast of India. Indian J Mar Sci 27: 486-488.
- Gowda G, Gupta TRC, Rajesh KM, Gowda H, Lingadhal C, et al. (2001) Distribution of phytoplankton pigment in the Nethravathi estuary. Indian J Fish 49: 267-273.
- Sudarsan D (1985) Results of exploratory survey around the Andaman Islands. Bulletin of the Exploratory Fisheries Project 7: 1-43.
- John Samuel N, Thirunavukkarasu N, Soundarapandian P, Shanmugam A, Kannupandi T (2004) Fishery potential of commercially important portunid crabs along Parangipettai coast. In: Proceedings of Ocean Life Food & Medicine Expo 165-173.
- Varadharajan D, Soundarapandian P, Dinakaran GK, Vijakumar G (2009) Crab Fishery Resources from Arukkattuthurai to Aiyammpattinam, South East Coast of India. Curr Res J Biol Sci 1: 118-122.
- Menon MK (1953) A note on the bionomics and fishery of the swimming crab Neptunus sanguinolenlus (Herbst) on the Malabar Coast. Journal of the Zoological Society of India 4: 177-184.
- Prasad RR, Thampi PRS (1953) Contribution to the biology of the blue swimming crab, Neptunus pelagicus (Linnaeus), with a note on the zoea of Thalamita crenata Latreille. Journal of the Bombay Natural History Society51: 674-689.
- Chhapgar BF (1956) On the breeding habits and larval stages of some crabs. Rec Indian Mus54: 33-52.
- Okafor FC (1988) Rural development and the Environment: Degradation Versus protection. In: Environmental Issues and Management in Nigeria Development, P. O. Sada and F.O. Oemerho (Eds.), Evans Brothers (Nigeria Publishers) Limited, Ibadan 150-163.
- Lawal-Are AO, Kusemiju K (2000) Size composition, growth pattern and feeding habits of the blue crab, Callinectes amnicola (De Rocheburne) in the Badagry Lagoon, Nigeria. J Sci Res Dev 5: 169-176.
- Das J, Das SN, Sahoo RK (1997) Semidiurnal variation of some physico-chemical parameters in the Mahanadi estuary, East coast of India. Ind J Mar Sci 26: 323-326.
- Subramanian B, Mahadevan A (1999) Seasonal and diurnal variation of hydrobiological characters of coastal water of Chennai (Madras), Bay of Bengal. Indian J Mar Sci 28: 345-415.
- Zhingde MD, Nair RV, Govindan K, Sabnis MM (1988) Marine environmental impact assessment of proposed tidal power development in the Gulf of Kutch. Proc Symp on tidalpower plant development in the Gulf of Kutch, Central Electricity Authority, New Delhi 205-208.
- Muthu MS, Laxminarayana A (1977) Induced maturation and spawning of Indian penaeid prawns. Indian Journal of Fisheries24.
- Das AK (2000) Limno-Chemistry of some andhra pradesh reservoirs. Journal of the Inland Fisheries Society of India 32.
- Riedel B, ZuschinM, HaselmairA, Stachowitsch M(2008) Oxygen depletion under glass: Behavioural responses of benthic macrofauna to induced anoxia in the Northern Adriatic. J Exp Mar Biol Ecol367:17-27.
- Haselmair A, Stachowitsch M, Zuschin M, Riedel B (2010) Behaviour and mortality of benthic crustaceans in response to experimentally induced hypoxia and anoxia in situ. Mar Ecol Prog Ser 414: 195-208.
- Company JB, Sarda F (1998) Metabolic rates and energy content of deep-sea benthic decapod crustaceans in the western Mediterranean Sea. Deep Sea Res Part I Oceanogr Res Pap 45: 1861-1880.
- Pearson TH, Rosenberg R (1978) Macro benthic succession in relation to organic enrichment and pollution of the marine environment. Oceanogr Mar Biol Ann Rev 16: 229-311.
- Naz M, Turkmen M (2004) Phytoplankton Biomass and Species Composition of Lake Golbasi (Hatay-Turkey). Turk J Biol 29: 49-56.
- Bijoy Nandan S, Abdul Azis PK (1990) Studies on BOD5 and dissolved oxygen in the Kadinamkulam Kayal, Southern Kerala. Mahasagar 23: 95-101.
- Sumpton WD, Smith GS (1990) Effect of temperature on the emergence, activity and feedingof male and female sand crabs (Portunus pelagicus). Australian Journal of Marine and Freshwater Research 41: 545-550.
- Kunzmann A, Schmid M, Yuwono E (2007) Routine respiration and activity of the Indonesian mangrove crab Scylla serrata (Forskal, 1775), (Decapoda, Brachyura). Crustaceana 80: 77-95.
- Bridges CR, Brand AR (1980) The effect of hypoxia on oxygen consumption and blood lactate levels of some marine crustacea. Comp Biochem Physiol A Physiol 65: 399-409.
- Childress JJ, Cowles DL, Favuzzi JA, Mickel TJ (1990) Metabolic rates of benthic deep-sea decapod crustaceans decline with increasing depth primarily due to the decline in temperature. Deep Sea Res A 37: 929-949.
- Henry RP (1994) Morphological, behavioral and physiological characterization of bimodal breathing crustaceans. Amer Zool 34: 205-215.
- Johnson IT (1985) Studies on some responses of Carcinus maenas (L.) and other brachyurans to hypoxia and aerial exposure.
- Allan GL, Maguire GB (1991) Lethal levels of low dissolved oxygen and effects of short-term oxygen stress on subsequent growth of juvenile Penaeus monodon. Aquaculture 94: 27-37.
- Madenjian CP, Rogers GL, Fast AW (1987) Predicting night time dissolved oxygen loss in prawn ponds of Hawaii: Part I. Evaluation of traditional methods. Aquac Eng 6: 191-208.
- Jegadeesan P (1986) Studies on environmental inventory of the marine zone of Coleroon estuary and inshore waters of Pazhaiyaru, southeast coast of India, Ph. D Thesis Annamalai University, India 277.
- Pittendrigh CS (1981) Circadian organization and the photoperiodic phenomena. In: B K Follett (Ed.) Biological Clocks in Reproductive Cycles, Bristol: John Wright 1-35.
- Segal E (1970) Light invertebrates. In: Kinne O (ed.), Marine ecology, Environmental factors, Part l Wiley London l: 59-211.
- Scharrer E (1964) Photo-neuroendocrine systems general concepts. Ann N Y Acad Sci117: 13-22.
- Mocquard JP, Besse G, Juchault P, Legrand JJ, Martin G, et al. (1976) Dur6e de la pgriode de reproduction chez les femelles de l'oniscoide Porcellio dilatatus Brandt, suivant les conditions delevage: Temperature, photoperibde et groupement. Vie Milieu 26: 51-76.
- Pradeille-Rouquette M (1976) Étude de la fonction de reproduction chez les femelles du crabe Pachygrapsus marmora (F.) et de différents facteurs qui lui sont liés (1) = Study of the reproduction of female Pachygrapsus marmoratus (F.) and of different linked factors (1). Cah Biol Mar17: 387.
- Little G (1968) Induced winter breeding and larval development in the shrimp, Palaemonetes Pugio Holthuis (Caridea, Palaemonidae). Crustaceana 2: 19-26.
- Miner JG, Stein RA (1996) Detection of predators and habitat choice by small bluegills: effects of turbidity and alternative prey. Trans Am Fish Soc 125: 97-103.
- Kishore K, Joshi BD, Deepali K (2005) Physicochemical characteristics of pond water at Kanpur village in Bareilly district (UP). Him J Environ Zool 19: 89-92.
- Karlsson PE, Uddling J, Braun S, Broadmeadow M, Elvirae S, et al. (2004) New critical levels for ozone effects on young trees based on AOT40 and simulated cumulative leaf uptake of ozone. Atmos Environ 38: 2283-2294.
- Elizabeth GL, Paul AH (1976) Oxygen consumption of the blue crab, Callinectes sapidus rathbun, from proecdysis to postecdysis. Comp Biochem Physiol A Physiol 54: 55–60.
- Taylor AC (1977) The respiratory responses of Carcinus maenas (L.) to changes in environmental salinity. J Exp Mar Biol Ecol 29: 197-210.
- Giuseppe JDV (1987) Salinity responses in brackish water populations of the freshwater shrimp Palaemonetes antennarius—I. Oxygen consumption. Comp Biochem Physiol A Physiol 87: 471-478.
- Davenport J, Wong TM (1987) Responses of adult mud crabs (Scylla serrata) (Forskal) to salinity and low oxygen tension. Comp Biochem Physiol A Physiol86: 43-47.
- Mitra A, Patra KC, Panigrahy RC (1990) Ecology of Planktonic copepods in the Madarmani creek of West Bengal, India. Indian J Mar Sci 19: 278-281.
- Anbazhagan P (1988) Hydrobiology and benthic ecology of Kodiakkarai coastal sanctuary (Southeast coast of India). Ph.D. Thesis, Annamalai University, India 208.
- Jayaprakash M, Srinivasalu S, Jonathan MP, Mohan VR (2005) A baseline study of physico-chemical parameters and trace metals in waters of Ennore Creek, Chennai, India. Mar Pollut Bull 50: 583-589.
- Choudhury SB, Panigrahy RC (1991) Seasonal distribution and behavior of nutrients in the creek and coastal waters of Gopalpur, East coast of India: Mahasagar 24: 81-88.
- Murugan A, Ayyakkannu K (1991) Ecology of Uppanar backwater, Cuddalore: 1. Physico-chemical parameters. Mahasagar 24: 31-38.
- Dahanayaka DDGL, Jayamanne SC, Jinadasa SUP (2007) Hydrobiological aspects of Palk Bay and Palk Strait area. J Nat Aquat Resour Res Dev Agency 38: 33-44.
- Colt JE, Armstrong DA (1979) Nitrogen toxicity to fish, crustaceans and molluscs. Bio-Engineering Symposium, Fish Culture Section of the American Fisheries Society, Traverse City, Michigan.
- Chen JC, Lei SC (1990) Toxicities of ammonia and nitrite to Penaeus monodon Juveniles. J World Aquac Soc 21: 300-306.
- Segar K, Hariharan V (1989) Seasonal distribution of nitrate, nitrite, ammonia and plankton in effluent discharge area of Mangalore, west coast of India. Indian J Mar Sci 18: 170-173.
- Vinayachandran PN, Mathew S (2003) Phytoplankton bloom in the Bay of Bengal during the northeast monsoon and its intensification by cyclones. Geophys Res Lett 30.
- Edward JKP, Ayyakkannu K (1991) Studies on the ecology of plankton community of Kollidam estuary, Southeast coast of India: 1. Phytoplankton,. Mahasagar 24: 89-97.
- Marichamy R, Siraimeetan P (1979) Hydrobiological Studies in the Madras coastal waters of Tuticorin, Gulf of Mannar. Journal of the Marine Biological Association of India 21: 67-76.
- Jayaraman R (1954) Seasonal variations in salinity, dissolved oxygen and nutrient salts in the inshore waters of the Gulf of Mannar and Palk Bay near Mandapam (S. India). Indian Journal of Fisheries1: 345-364.
- George PC (1953) The marine plankton of the coastal waters of Calicut with observations on the hydrological conditions. Journal of the Zoological Society of India 5: 76-107.
- Subrahmanyan R (1959) Studies on the plankton of the West Coast of India. Proceedings of the Indian Academy of Sciences. Section B50: 189-252.
- Reddy C, Gangadhara V, Sankaranarayanan VN (1968) Distribution of nutrients in the shelf waters of the Arabian Sea along the west coast of India. Bull Natn Inst SciIndia 38: 206-220.
- Seshappa O, Jayaraman R (1956) Observations on the composition of bottom muds in relation to the phosphate cycle in the inshore waters of the Malabar Coast. Proceedings of the Indian Academy of Sciences43: 288-301.
- Qasim SZ (1969) Some problems related to the food chain in a tropical estuary. ed J H Steele (Edinburgh: Oliver & Boyd), 45-51.
- Rajasegar M (2003) Physico-chemical characteristic of the Vellar estuary in relation to shrimp farming. J Environ Biol 24: 95-101.
- Qasim SZ (1980) Adaptations in phytoplankton to changing conditions in tropical estuaries. Mahasagar13: 117-124.
- Philips S, Laanbroek HJ, Verstraete W (2002) Origin causes and effects of increased nitrite concentrations in aquatic environments. Rev. Environ. Sci. Biotechnol 1: 115-141.
- Abrams PA, Roth J (1994) The responses of unstable food chains to enrichment. Evol Ecol 8: 150-171.
- Berard A, Pelte T, Druart JC (1999) Seasonal variations in the sensitivity of Lake Geneva phytoplankton community structure to atrazine. Arch Hydrobiol 145: 277-295.
- Soderhall K, Smith VJ (1983) Separation of the haemocyte populations of Carcinus maenas and other marine decapods, and prophenoloxidase distribution. Dev Comp Immunol 7: 229-239.
- Destoumieux D, Bulet P, Loew D, Dorsselaer AV, Rodriguez J, et al. (1997) Penaeidins, a new family of antimicrobial peptides isolated from the shrimp Penaeus vannamei (Decapoda). J Biol Chem 272: 28398-28406.
- Bauchau AG (1981) Crustaceans, Invertebrate BloodCell vol 2. In: N.A. Ratcliffe, A.F. Rowley, Editors Academic Press, New York 386–420.
- Chisholm JRS, Smith VJ (1992) Antibacterial activity in the haemocytes of the shore crab, Carcinus maenas. J Mar Biol Assoc UK 72: 529-542.
- Haug T, Kjuul AK, Stensvåg K, Sandsdalen E, Styrvold OB (2002) Antibacterial activity in four marine crustacean decapods. Fish Shell Immunol 12: 371-385.
- Roff JC, Turner JT, Webber MK, Hopcroft RR (1995) Bacterivory by tropical copepod nauplii: extent and possible significance. Aquat Microb Ecol 9: 165-175.
- Mills CE (1995) Medusae, siphonophores and ctenophores as planktivorous predators in changing global ecosystems. Ices J Mar Sci 52: 575-581.
- Epifanio CE (1995) Transport of blue crab (Callinectes sapidus) larvae in the waters off Mid-Atlantic States. Bull Mar Sci 57: 713-725.
- Dittel AI, Epifanio CE, Cifuentes LA, Kirchman DL (1997) Carbon and nitrogen sources for shrimp postlarvae fed natural diets from a tropical mangrove system. Estuar Coast Shelf Sci 45: 629-637.
- Madhupratap M, Nair SRS, Haridas P, Padmavati G (1990) Response of zooplankton to physical changes in the environment: coastal upwelling along the central west coast of India. Journal of Coastal Research 6: 413-426.
- Sawant SS, Madhupratap M (1996) Seasonality and composition of phytoplanlton in the Arabian Sea. Curr Sci 71: 869-873.
- Stribling JM, Cornwell JC (1997) Identification of important primary producers in a Chesapeake Bay tidal creek system using stable isotopes of carbon and sulfur. Estuaries 20: 77-85.
- Butterfield NJ (2001) Ecology and evolution of Cambrian plankton. In the ecology of the Cambrian radiation. (eds A. Y. Zhuravlev & R. Riding), 200–216
- Robertson AI, Alongi DM, Boto KG (1992) Food chains and carbon fluxes. Coastal and Estuarine Studies 41: 293-326.
- Gajbhiye SN (2002) Zooplankton–Study methods, importance and significant observations. Proceedings of the National Seminar on Creeks, Estuaries and Mangroves-Pollution and Conservation 21-27.
- Shanks AL, McCulloch A, Miller J (2003) Topographically generated fronts, very nearshore oceanography and the distribution of larval invertebrates and holoplankters. J PlanktonRes 25: 1251-1277.
- Calvert M, Adsett K, Simpson J (2000) Land Use Mapping of the Fitzroy Catchment: Fitzroy Catchment Implementation Project: Final Report. Department of Natural Resources.
- McVey JP (1993) CRC Hand Book of Mariculture.Vol 1 Crustacean Aquaculture. (2nd edition), CRC Press.
- Steidinger KA, Walker LM (1984) Marine Plankton Life Cycle Strategies. Boca Raton, Fla, CRC Press.
- Trussell GC, Smith LD (2000) Induced defenses in response to an invading crab predator: an explanation for historical and geographic phenotypic change. Proc Nat Acad Sci 97: 2123-2127.
Relevant Topics
- Algal Blooms
- Blue Carbon Sequestration
- Brackish Water
- Catfish
- Coral Bleaching
- Coral Reefs
- Deep Sea Fish
- Deep Sea Mining
- Ichthyoplankton
- Mangrove Ecosystem
- Marine Engineering
- Marine Fisheries
- Marine Mammal Research
- Marine Microbiome Analysis
- Marine Pollution
- Marine Reptiles
- Marine Science
- Ocean Currents
- Photoendosymbiosis
- Reef Biology
- Sea Food
- Sea Grass
- Sea Transportation
- Seaweed
Recommended Journals
Article Tools
Article Usage
- Total views: 18020
- [From(publication date):
June-2013 - Mar 31, 2025] - Breakdown by view type
- HTML page views : 12899
- PDF downloads : 5121

