Research Article Open Access
Effect of 17 a-Methyl Testosterone on Haematology and Histology of Liver and Heart of Oreochromis andersonii (Castelnau, 1861)
Kefi AS1*, Kang’ombe J11, Kassam D1 and Katongo C2
1Lilongwe University of Agriculture and Natural Resources, Bunda Campus, P.O. Box 219, Lilongwe, Malawi
2University of Zambia, Department of Biological Sciences, P. O. Box 32379, Lusaka, Zambia
- Corresponding Author:
- Kefi AS
Lilongwe University of Agriculture and Natural Resources
Bunda Campus, P.O. Box 219, Lilongwe, Malawi
E-mail: askefi@yahoo.com
Received Date: August 02, 2013; Accepted Date: August 27, 2013; Published Date: August 30, 2013
Citation: Kefi AS, Kang’ombe J, Kassam D, Katongo C (2013) Effect of 17 α-Methyl Testosterone on Haematology and Histology of Liver and Heart of Oreochromis andersonii (Castelnau, 1861). J Marine Sci Res Dev 3:130. doi: 10.4172/2155-9910.1000130
Copyright: © 2013 Kefi AS, et al. This is an open-access article distributed under the terms of the Creative Commons Attribution License, which permits unrestricted use, distribution, and reproduction in any medium, provided the original author and source are credited.
Visit for more related articles at Journal of Marine Science: Research & Development
Abstract
The aim of the study was to investigate the effect of 17 α-methyl testosterone (MT) on haematology and histology of liver and heart of Oreochromis andersonii subjected to varying levels of MT. Three different doses (40, 60 and 90 mgMT/kg feed) of MT were administered to O. andersonii. Final mean weight (g), gonadosomatic, cardiosomatic and hepatosomatic indices did not differ (P>0.05) among the treatments. Similarly, survival of the O. andersonii in all the treatments did not differ (P>0.05) significantly. Of the haematological and blood chemistry parameters determined, only haemoglobin (Hb), red blood cells (RBC), haematocrit and uric acid were significantly different (P<0.05), among the treatments with the control group having the highest of the latter two parameters. Haemoglobin (r=-0.743; P<0.05) and Red Blood Cells (RBC) (r=-0.726; P<0.05) showed significant association with MT levels. All the treatments did not show any histopathological differences in the liver and heart. However, all the liver samples showed haemosidrein (HE) and extra–hepatic pancreas (EH), while the heart exhibited the vacuolar degeneration (VD). The length–weight relationship coefficient differed (P<0.05) among the treatments with the fish fed with 40 mgMT/kg having the highest slope (2.642), although it only differed (P<0.05) with that of 90 mgMT/kg (1.547), which exhibited the worst condition. The study shows that the oral administration of MT for a short period of up to thirty (30) days does not affect the physiology of O. andersonii. Furthermore, the safety of MT to O. andersonii is, therefore, proved under the conditions of the current experiment. However, there are signs of condition deterioration in high levels of MT.
Keywords
17 α-methyl testosterone; Liver; Heart; Histology; Haematology; Safety
Introduction
The androgen, 17α-Methyltestosterone (MT), an anabolic steroid, is being widely used in the production of all male population in aquaculture, especially the Oreochromis spp due to their precocious sexual maturity and a high reproductive efficacy, resulting in overpopulation in ponds [1]. The general practice involves oral administration of MT through feed for the first twenty one days of life immediately after yolk absorption. However, its use has received a lot of resistance from both the consumers and ecologists, as its impact on both humans and environment still remain unclear. In fact, such synthetic hormones remain prohibited in some countries [2]. Although there is evidence of inducing sex inversion in Tilapia in waters that are not directly applied with the hormone, its effect on water pollution is not well understood [3]. Furthermore, its impact on fish physiology has not been fully appreciated. Phelps and Popma [4] speculated that the utilisation of MT may produce some secondary effects. Furthermore, consumers are sceptical on foods that are produced with the application of hormones.
Haematological and blood chemistry characteristics have been widely used in clinical diagnosis of human and domestic animals [5,6]. They have been described to be indispensable parameters in evaluating physiological status of the fish [7]. These indices can further be used to detect stress condition, such as exposure to pollutants, hypoxia, transportation, anaesthetic and acclimation [8]. Blood is sensitive to environmental pollutants [9], and can reveal conditions within the body of the fish long before there is any visible sign of disease [10,8]. In fact they have been frequently been used as indicators of stress in sturgeons [11-13]. This is because haematological parameters are closely related to the response of the animal to the environment, an indication that the environment in which the fish lives can exert some influence on the blood parameters [8,14]. However, haematological parameters vary with age, sex, activity of the fish and environment [13]. Furthermore, blood chemistry may indicate the health status of the fish [6], destined for consumption as the utilisation of MT expands. Therefore, the health of the fish may be used as a proxy in determining the safety of the product. Although haematological and plasma parameters are a useful tool in fish physiology, literature in this area has been isolated, and where available is usually incomplete [15]. To the best of our knowledge, there has been no published literature on the haematology of O. andersonii.
There has been wide spread use of MT in the seed production of Oreochromis species despite inadequate information about the impact of the androgen on fish physiology. Although it has been established that plasma testosterone is excreted and metabolised quickly [16,17] its long term impact on the pathology of liver and heart remain unclear. There are no published papers on the blood parameters of O. andersonii subjected to sex steroids in particular MT. Although MT is administered to fry for sex reversal purposes, the experiment centred on adult fish where blood, liver and heart could be extracted easily. This study evaluated the blood parameters of O. andersonii subjected to varying levels of MT. Histological analysis of the heart and liver was conducted too. The histology of heart was included since it is the organ responsible for pumping blood.
The results of this study will help in establishing the health status of O. andersonii fed with MT incorporated feed. Furthermore, the results will establish the reference values of haematological and plasma chemistry of O. andersonii.
Materials and Methods
The study was conducted at National Aquaculture Research and Development Centre (NARDC), Kitwe, Zambia for 30 days. Sixty four (64) Oreochromis andersonii (females=115 ± 14.228 g and males=194.100 ± 25.909 g; mean ± SD) were evenly allocated to four different hapas (1 ± 1± 1 m) installed in outdoor concrete tanks (10 ± 5± 0.7 m), with water up to the depth of 40 cm, leaving 30 cm freeboard to avoid the spilling of water since they were receiving the feed containing the hormone. In addition, the outlet pipes were sealed with plastics. All hapas had equal numbers of females and males.
Isonitrogenous (30%) and isocaloric (4.02 kcal/g) diet was prepared using WinFeed 2.8 package after proximate analyses of ingredients (soyabean=56% cake, maize bran=36%, soyaGold oil=5.9%, vitamin premix=1% and d- calcium phosphate=1%). Three levels of MT (Aquaculture Solutions Limited, South Africa) of 40 mg/kg (T1), 60 mg/kg (T2) and 90 mg/kg (T3) were included in the feed as treatments and hormone free feed as a control (C). The doses were chosen based on several authors [4,18,19] studies on the utilisation of MT in sex reversal. The MT was dissolved in 95% ethanol at the concentration of 15 ml/kg of feed [20]. The feed and hormone were then mixed in the dish, until a homogeneous sample was achieved. The feed was then dried under direct sunlight for three hours to allow for the evaporation of the ethanol, before they were taken on the pelleting machine (BSW 330) attached with 3.2 mm die. The pellets were then taken outside on racks for sun drying, before storing in a chiller (Sanyo medicool) at 8°C till used. Fish were provided for 30 days with the prepared feed twice a day (10:00 and 15:00 hrs) daily, except Sundays calculated at 5% live body weight. Survival was monitored although the dead ones were not replaced.
On the 30th day, twelve fish from each treatment were carefully caught and anaesthetised in crude clove (5 g/l of deionised water), before they were weighed and measured. The fish were then wiped off water using a hand towel, before their left gills punctured across with the blade. The fish were then tilted with the gill portion facing the vacutainer (purple top), collecting the oozing blood. Six samples from each treatment were bled and 2 ml blood collected from each fish and put in a separate vacutainer with an anticoagulant dipotassium ethylenediamine tetraacetic acid (EDTA) for haematological analysis. The vacutainers were immediately put on ice cubes before taken to the laboratory. The parameters determined included White Blood Cells (WBC), Lymphocytes (LYM), Monocytes (MON), Granucytes (GRA), Red Blood Cells (RBC), Haemoglobin (Hb), Haematocrit (Ht), Mean Corpuscular Volume (MCV), Mean Corpuscular Volume Haemoglobin (MCH), Mean Corpuscular Volume Haemoglobin Concentration (MCHC), Red Blood Cell Distribution Width (RBCDW), Platelets (PLT), Mean Platelets Volume (MPV), Platecrit (PCT) and Platelets Distribution Width (PDW). In the laboratory, the blood was mixed on a roller mixer and analysed on an ABX Micros 60 Cs. A similar procedure was conducted for plasma chemistry although the blood was put in BD vacutainers and was not put on ice. In the laboratory, the samples were analysed on an automated chemistry analyser (Olympus AU 400), using the standard procedures. Blood chemistry parameters determined included urea, creatinine, uric acid, total birirubin, lactate dehydrogenase (LDH), total protein, cholesterol, triglycerides and globulins. However, globulins were calculated from the difference between total protein and albumin values [6].
Selected water quality parameters (dissolved oxygen, water temperature and electrical conductivity) were collected three times a week using YSI professional plus water checker.
The liver and heart were then recovered from the fish and preserved in 10% formalin for histological analysis, before they were weighed on Citizen analytical balance for hepatosomatic (HSI) (weight of liver (g)/ weight of fish (g)), gonadosomatic indices (GSI) (weight of gonad (g)/ weight of fish (g)) and cardiosomatic indices (CSI) (weight of heart (g)/ weight of fish (g)) claculation. They were embedded in paraffin wax after dehydration in series of methanol (70, 80, 90 and 100%), and sectioned in 3 μm, and then stained with Haematoxylin and Eosin (H&E), before they were mounted on slides with DPX mountant. The slides were then examined on the Olympus microscope (400X power), and a picture taken with Kodak camera.
Data Analysis
General Linear Model (univariate analysis procedure) was performed to determine the differences in the blood parameters among treatment (MT) means which were deemed significant at P<0.05. Differences were separated by Duncan’s Multiple Range Test (DMRT) [21]. Before analysis, parametric data were tested for normality using Shapiro-Wilk test and the homogeneity of variance using Levene’s test for Equality of Variances. Partial correlation analysis was performed to describe the strength and direction of MT levels and blood parameters, but controlling for fish size. Cross tabulations and Chi-square tests were used to examine significant differences (P<0.05) in mortality among the treatments (MT levels).
To determine the condition factor, the length component was obtained by calculating from the length-weight relationship of w=aLb, but linearised into logW=loga+blogL [22], to obtain the allometric size-length relationship with linearity confirmed by polynomial regression, where; a=intercept of the standard length and weight relationship, b=slope or exponent (ß) of the standard length and weight relationship, w=weight (g) and L=standard length (mm). Slopes (ß) between the treatments was calculated by running the linear regression of each treatment separately and resultant slopes used to calculate the Student’s t-test using the formula t=(ß1- ß2)/(Sß1-ß2), where Sß1-ß2=standard error of the difference between the two slopes= 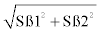 , where Sß1=standard error of slope 1 and Sß2=standard error of slope 2. Comparisons were then made between control and all the treatment (40, 60 and 90 mgMT/kg), 40 mgMT/kg with 60 mgMT/ kg and 90 mgMT/kg, and 60 mgMT/kg with 90 mgMT/kg. Any Z score or t that fell outside ± 1.96 and dfN1+N2-4 (P=0.025), respectively, was considered significant thus the pair was considered significant (P<0.05).
Results
The final mean weight (g), HSI (%), GSI (%) and mortality (%) did not differ significantly (P>0.05) among the treatments (Table 1). However, GSI was highest in fish fed with 40 mgMT/kg followed by the 90 mgMT/kg fed fish. The highest survival rate was observed in 60 mgMT/kg followed by 40 mgMT/kg treatment.
| Parameter | Treatment | |||
|---|---|---|---|---|
| 0 (Control) | 40 mgMT/kg | 60 mgMT/kg | 90 mgMT/kg | |
| Initial mean weight (g) | 180.382 ± 7.132 | 200.294 ± 11.395 | 199.912 ± 10.669 | 187.559 ± 8.976 |
| Final mean weight (g) | 184.167 ± 16.605 | 227.692 ± 15.954 | 221.364 ± 17.343 | 200.624 ± 20.337 |
| HIS | 0.231 ± 0.028 | 0.147 ± 0.027 | 0.161 ± 0.029 | 0.149 ± 0.034 |
| GSI | 0.558 ± 0.182 | 0.918 ± 0.175 | 0.389 ± 0.190 | 0.560 ± 0.223 |
| Mortality (%) | 32.8 | 21.3 | 19.7 | 26.2 |
Table 1: Growth, GSI and HSI of O. andersonii subjected to different levels of MT.
There were no significant differences (P>0.05) observed in all blood parameters measured, except RBC, Hb and Ht. Haemoglobin in the control fish was found to be significantly higher (P<0.05) than in the fish fed with 40 and 60 mgMT/kg, but not significantly different (P>0.05) from the fish fed with 90 mgMT/kg. Haematocrit for the control fish was significantly higher (P<0.05) than fish given the MT. However, with the exception of PLT, PCT and PDW, the control seemed to have a higher value of the haematological indices than those treated with MT (Table 2). Similarly, partial correlation, controlling for fish size between the amount of MT and blood parameters showed negative relationships between MT and haematological parameters, with high levels of MT associated with low levels of blood indices. However, only Hb (r=-0.743; P<0.05) and RBC (r=-0.726; P<0.05) showed significant association with MT levels with high levels of MT associated with low values for Hb and RBC (Table 3).
| 0 mgMT/kg | 40 mgMT/kg | 60 mgMT/kg | 90 mgMT/kg | ||
|---|---|---|---|---|---|
| Parameter | Statistic | ||||
| WBC (103µl-1) | Mean ± SE | 145.6 ± 10.830 | 80.700 ± 12.890 | 61.867 ± 24.618 | 94.567 ± 37.582 |
| Minimum | 125.6 | 55.0 | 15.3 | 30.9 | |
| Maximum | 162.8 | 95.3 | 99.0 | 161.0 | |
| • LYM (103µl-1) | Mean ± SE | 142.867 ± 10.038 | 79.00 ± 12.864 | 60.6 ± 24.23 | 90.033 ± 34.209 |
| Minimum | 124.2 | 53.3 | 14.7 | 30.5 | |
| Maximum | 158.6 | 92.9 | 96.9 | 149.0 | |
| • MON (103µl-1) | Mean ± SE | 1.667 ± 0.521 | 0.967 ± 0.348 | 0.7 ± 0.321 | 1.633 ± 1.058 |
| Minimum | 0.8 | 0.4 | 0.2 | 0.2 | |
| Maximum | 2.6 | 1.6 | 1.3 | 3.7 | |
| • GRA (103µl-1) | Mean ± SE | 1.067 ± 0.291 | 0.733 ± 0.067 | 0.567 ± 0.12 | 0.9 ± 0.7 |
| Minimum | 0.1 | 0.6 | 0.2 | 0.2 | |
| Maximum | 1.6 | 0.8 | 0.8 | 2.3 | |
| • LYM (%) | Mean ± SE | 98.2 ± 0.436 | 97.867 ± 0.649 | 97.6 ± 0.625 | 96.733 ± 2.067 |
| Minimum | 97.4 | 96.90 | 96.4 | 92.6 | |
| Maximum | 98.9 | 99.1 | 98.5 | 98.9 | |
| • MON (%) | Mean ± SE | 1.167 ± 0.291 | 1.367 ± 0.384 | 1.400 ± 0.289 | 2.167 ± 1.272 |
| Minimum | 0.7 | 0.6 | 0.9 | 0.70 | |
| Maximum | 1.70 | 1.80 | 1.90 | 4.70 | |
| • GRA (%) | Mean ± SE | 0.633 ± 0.145 | 0.767 ± 0.291 | 1.0 ± 0.352 | 1.1 ± 0.802 |
| Minimum | 0.4 | 0.3 | 0.6 | 0.2 | |
| Maximum | 0.9 | 1.3 | 1.7 | 2.7 | |
| RBC (106µl-1) | Mean ± SE | 1.307 ± 0.344b | 0.747 ± 0.124a | 0.627 ± 0.145a | 0.763 ± 0.187a |
| Minimum | 0.62 | 0.53 | 0.34 | 0.49 | |
| Maximum | 1.7 | 0.96 | 0.81 | 1.12 | |
| Hb (g/dL) | Mean ± SE | 7.067 ± 0.696b | 4.333 ± 0.633a | 3.567 ± 0.524a | 5.033 ± 1.071ab |
| Minimum | 5.8 | 3.1 | 2.6 | 3.1 | |
| Maximum | 8.2 | 5.2 | 4.4 | 6.8 | |
| Ht (%) | Mean ± SE | 15.633 ± 5.005b | 7.067 ± 1.23a | 8.033 ± 2.805a | 7.867 ± 0.606a |
| Minimum | 8.3 | 5.1 | 2.8 | 6.8 | |
| Maximum | 25.2 | 9.3 | 12.4 | 8.9 | |
| MCV (µm3) | Mean ± SE | 299.333 ± 16.667 | 169.0 ± 60.008 | 121.667 ± 25.221 | 227.333 ± 45.038 |
| Minimum | 266.0 | 96.0 | 85.0 | 138.0 | |
| Maximum | 316.0 | 288.0 | 170.0 | 282.0 | |
| MCH (pg) | Mean ± SE | 94.133 ± 2.083 | 77.433 ± 17.013 | 60.9667 ± 8.207 | 85.567 ± 11.712 |
| Minimum | 90.4 | 58.70 | 51.4 | 62.7 | |
| Maximum | 97.60 | 111.4 | 77.3 | 101.4 | |
| MCHC (p/dL) | Mean ± SE | 63.267 ± 3.994 | 63.100 ± 7.835 | 56.867 ± 17.982 | 62.700 ± 9.322 |
| Minimum | 57.2 | 50.4 | 30.2 | 45.3 | |
| Maximum | 70.8 | 77.4 | 91.1 | 77.2 | |
| RBCDW (%) | Mean ± SE | 29.3 ± 8.55 | 27.933 ± 6.233 | 25.167 ± 4.446 | 11.9 ± 0.902 |
| Minimum | 14.8 | 16.4 | 17.4 | 10.9 | |
| Maximum | 44.4 | 37.8 | 32.8 | 13.7 | |
| PLT (103µl-1) | Mean ± SE | 64.0 ± 21.166 | 50.058 ± 25.267 | 92.667 ± 19.402 | 35.0 ± 13.0 |
| Minimum | 32.0 | 174.0 | 56.0 | 22.0 | |
| Maximum | 104.0 | 82.0 | 122.0 | 48.0 | |
| MPV(µm3) | Mean ± SE | 12.000 ± 1.000 | 11.500 ± 1.735 | 6.5 ± 0.361 | 9.5 ± 3.1 |
| Minimum | 11.0 | 8.1 | 6.0 | 6.4 | |
| Maximum | 164.0 | 13.8 | 7.2 | 12.6 | |
| PCT (pg) | Mean ± SE | 0.032 ± 0.007 | 0.101 ± 0.060 | 0.061 ± 0.014 | 0.015 ± 0.001 |
| Minimum | 0.018 | 0.028 | 0.033 | 0.014 | |
| Maximum | 0.048 | 0.219 | 0.077 | 0.015 | |
| PDW (p/dL) | Mean ± SE | 9.3 ± 3.073 | 12.3 ± 3.623 | 6.2+0.635 | 7.0 ± 0.1 |
| Minimum | 5.6 | 5.2 | 5.1 | 6.9 | |
| Maximum | 15.4 | 17.1 | 7.3 | 7.1 | |
Table 2: Haematological characteristics of O. andersonii males subjected to different MT levels.
| WBC (mm3) | RBC (mm3) | Hb (g/dL) | Ht (%) | MCV (um3) | MCH (pg) | MCHC (p/dL) | RBCDW (%) | PLT (mm3) | MPV (um3) | PCT (%) | PDW (%) | |
|---|---|---|---|---|---|---|---|---|---|---|---|---|
| (r) | -0.693 | -0.726 | -0.743 | -0.461 | -0.669 | -0.606 | -0.196 | -0.434 | -0.006 | -0.360 | -0.049 | -0.318 |
| (P) | 0.057 | 0.041 | 0.035 | 0.250 | 0.069 | 0.111 | 0.642 | 0.282 | 0.988 | 0.382 | 0.907 | 0.442 |
Table 3: Partial correlation of Haematologicalparameters of O. andersonii with MT levels.
Plasma chemistry values for O. andersonii subjected to MT treatments were not significant (P>0.05), with an exception of blood urea (Table 4). However, negative total bilirubin values were observed in all the treatments, although only one fish subjected to 90 mgMT/kg recorded a positive value (0.1 μmolL-1). Blood urea in 40 mgMT/kg was significantly different (P<0.05) from the other MT treated fish.
| 0 mgMT/kg | 40 mgMT/kg | 60 mgMT/kg | 90 mgMT/kg | ||
|---|---|---|---|---|---|
| Parameter | Statistic | ||||
| Urea (mmolL-1) | Mean ± SE | 0.638 ± 0.047a | 0.923 ± 0.042b | 0.617 ± 0.060a | 0.617 ± 0.042a |
| Minimum | 0.530 | 0.720 | 0.510 | 0.470 | |
| Maximum | 0.820 | 1.040 | 0.760 | 0.690 | |
| Creatinine(µmolL-1) | Mean ± SE | 19.750 ± 3.977 | 29.333 ± 3.558 | 27.333 ± 5.031 | 22.833 ± 3.558 |
| Minimum | 0.000 | 22.000 | 23.000 | 19.000 | |
| Maximum | 32.000 | 53.000 | 30.000 | 30.000 | |
| Albumin (gL-1) | Mean ± SE | 9.975 ± 0.484 | 10.133 ± 0.433 | 10.150 ± 0.613 | 9.650 ± 0.433 |
| Minimum | 8.600 | 8.500 | 9.900 | 8.600 | |
| Maximum | 11.400 | 12.200 | 16.400 | 10.900 | |
| Total Bilirubin (µmolL-1) | Mean ± SE | -1.867 ± 1.618 | -5.083 ± 1.447 | -2.733 ± 2.046 | -1.083 ± 1.447 |
| Minimum | -6.10 | -12.600 | -7.700 | -2.200 | |
| Maximum | -0.60 | -1.000 | -0.400 | 0.100 | |
| LDH (µL-1) | Mean ± SE | 449.833 ± 82.549 | 561.167 ± 73.834 | 433.000 ± 104.417 | 379.667 ± 73.834 |
| Minimum | 178.000 | 311.000 | 299.000 | 218.000 | |
| Maximum | 881.000 | 840.000 | 534.000 | 681 | |
| Total protein (gL-1) | Mean ± SE | 26.050 ± 1.399 | 26.350 ± 1.251 | 30.317 ± 1.770 | 27.733 ± 1.251 |
| Minimum | 21.900 | 21.000 | 27.700 | 26.100 | |
| Maximum | 31.500 | 33.1000 | 31.900 | 31.200 | |
| Cholesterol (mmolL-1) | Mean ± SE | 3.225 ± 0.359 | 3.283 ± 0.321 | 3.383 ± 0.454 | 3.100 ± 0.321 |
| Minimum | 1.900 | 1.700 | 2.400 | 2.500 | |
| Maximum | 4.600 | 5.100 | 3.900 | 4.600 | |
| Triglycerides (mmolL-1) | Mean ± SE | 0.993 ± 0.182 | 0.790 ± 0.163 | 0.778 ± 0.230 | 0.807 ± 0.163 |
| Minimum | 0.450 | 0.410 | 0.460 | 0.420 | |
| Maximum | 1.550 | 1.380 | 1.080 | 1.200 | |
| Uric acid (µmolL-1) | Mean ± SE | 45.200 ± 7.211 | 33.900 ± 4.590 | 12.725 ± 2.130 | 44.683 ± 22.733 |
| Minimum | 25.500 | 20.70 | 6.90 | 9.10 | |
| Maximum | 62.800 | 49.10 | 16.10 | 152.50 | |
| Globulins (gL-1)) | Mean ± SE | 16.160 ± 1.262 | 16.217 ± 1.383 | 19.300 ± 1.023 | 18.083 ± 0.531 |
| Minimum | 12.300 | 10.800 | 16.900 | 16.600 | |
| Maximum | 20.100 | 20.900 | 21.900 | 20.400 | |
Table 4: Plasma chemistry for O. andersonii subjected to different MT levels.
There were no histopathological differences observed in the heart of MT treated fish and the control. However, they showed vacuolar degeneration (VD), which is the formation of nonlipid vacuoles in cytoplasm due to accumulation of water by cloudy swelling (Figure 1). Similarly, the liver of O. andersonii showed brown granules of haemosidrein (HE) and extra-hepatic pancreas (EH) in both the MT treated and control fish (Figure 2).

Figure 1: Histological pictures of O. andersonii heart treated in 0 mg/kg MT (a) 40 mg/kg MT (b) 60 mg/kg MT (c) and 90 mg/kg MT (d).

Figure 2: Histological pictures of O. andersonii liver treated in 0 mgMT/kg (a), 40 mgMT/kg (b), 60 mgMT/kg (c) and 90 mgMT/kg (d).
The length-weight relationship coefficient differed among the treatments with the fish fed 40 mgMT/kg having the highest slope (2.642), although it only differed with that of 90 mgMT/kg (1.547) (Table 5).
| Treatment | ß coefficient | Intercept (a) | r2 | R |
|---|---|---|---|---|
| 0 | 2. 354ab | 3.022 | 0.609 | 0.780 |
| 40 mgMT/Kg | 2.642ab | 3.653 | 0.742 | 0.861 |
| 60 mgMT/kg | 2.083b | 2.386 | 0.571 | 0.756 |
| 90 mgMT/kg | 1.547a | 1.205 | 0.821 | 0.906 |
Table 5: Regression parametersof the length-weight relationship.
Water temperature, electrical conductivity and dissolved oxygen did not differ (P>0.05) among the treatments (Table 6).
| Water parameter | Treatment | |||
|---|---|---|---|---|
| 0 mgMT/kg | 40 mgMT/kg | 60 mgMT/kg | 90 mgMT/kg | |
| Water Temperature (°C) | 26.655 ± 0.427 | 26.600 ± 0.446 | 26.509 ± 0.425 | 26.800 ± 0.427 |
| Electrical Conductivity (µmho/cm) | 108.600 ± 10.367 | 105.982 ± 9.708 | 105.491 ± 9.476 | 107.782 ± 10.058 |
| Dissolved Oxygen (mg/L) | 7.042 ± 0.364 | 7.024 ± 0.297 | 7.606 ± 0.456 | 7.274 ± 0.390 |
Table 6: Selected water quality parameters (mean ± SE).
Discussion
There were no significant differences (P>0.05) observed in the final mean weight of the fish among the treatments. However, this is contrary to what Kefi et al. [23] found. In their study, they found that the O. andersonii raised on 60 mgMT/kg feed had the highest final mean weight compared to the control, 40 mgMT/kg and 90 mgMT/kg. The variance would be attributed to the differences in the experimental period. In the current study, the experiment lasted for 30 days a period similar to the general MT administration period practiced in sex inversion or reversal, while Kefi et al. [23] observed the effect of MT on O. andersonii for 119 days, the duration similar to the growing period. Similarly, GSI and HSI did not differ (P>0.05) among treatments. Therefore, the period that is used in sex inversion must have been too short to impose any anabolic effect and affect reproductive and cardiosomatic indices.
According to Hrubec et al. [6] and El-Hawarry [24], although Tilapia are the second most frequently cultured fish species in the world, there are few reports of normal blood values. Blood parameters have proved to be valuable tools in providing information on metabolic disorders, deficiencies and chronic stress, before any clinical symptoms can appear [24]. Measurement of albumin, globulin and total protein in serum or plasma is of considerable diagnostic value in fish, as it relates to general nutritional status of the fish [25]. Lactate dehydrogenase (LDH) is an important enzyme in evaluating liver intoxication. It is known to occur in glycolysing cells and plays an important role in ammonia detoxification [26]. It is an enzyme that helps the fish that produces energy [27]. Creatinine and uric acid levels indicate the kidney function [28]. Cholesterol is a chemical compound that is naturally produced by the body, and is a combination of lipid (fat) and steroid. Cholesterol is a building block for cell membranes and for sex hormones like estrogen and testosterone. About 80% of the cholesterol is produced by the liver [27]. The values for total protein, globulins, albumin and cholesterol are within the ranges reported in Tilapia hybrid by Hrubec et al. [6]. Although the values of the cholesterol in the current experiment were lower than those reported by Chen et al. [29] in healthy O. niloticus, globulin and albumin were similar (P>0.05). Total protein was within the ranges of O. niloticus, Oreochromis aureus and the hybrid between O. niloticus and O. Aureus, although uric acid and creatinine were higher than those reported by El-Hawarry [24]. However, there were no significant differences (P>0.05) among the treatments, indicating that the liver protein metabolism and kidney function were similar in MT treated and the control O. andersonii. This was also confirmed by the histological analysis of liver, which did not show any pathological differences among the treatments. Deborah [30] did not find any deviation in the morphology of the liver between the untreated and treated channel catfish Ictalurus punctatus with MT.
Total bilirubin in the current study showed negative values indicating very low levels in the blood. This could be attributed to haemolysis of the blood during analysis, and therefore, cannot be compared to any other studies. However, no significant differences (P>0.05) were shown among the treatments, meaning that comparison can only be conducted among the treatments in the current experiment.
High dosages of exogenous male hormones are known to cause side effects, especially liver damage. However, lower levels have been established to offer various health benefits, including reduced risks from cardio-vascular disease and cancer [27]. If male hormones are administered to humans within physiological ranges, their side effects are kept to the minimum [31,27]. Hasheesh et al. [27] did not observe any significant differences (P>0.05) in the physiological parameters (plasma total protein, albumin, globulin, A/G ratio, total lipids, cholesterol, aspartate amino transferase (AST), alanine amino transferase (ALT) and LDH) between untreated and treated O. niloticus with MT at 30 and 60 mgMT/kg. This is consistent to the results of the current experiment that did not reveal any differences (P>0.05) among the treatments in the blood chemistry parameters. High blood urea concentration recorded in 40 mg/Kg feed is likely to be a sign of stress associated with the increase in the cortisol level [32]. However, the cause of stress in fish is unknown.
Several methods have been employed in assessing the condition of the fish. However, haematological parameters have been described to be reliable [33,34], as they indicate the nutritional status and overall health indication of the fish [34]. Although the control fish had higher values of WBC, MCV, MPV, MCHC and RBCDW than the treatments, there were no significant differences (P>0.05) among the treatments. The control fish had higher RBC than the MT fed fish, and this was significant (P<0.05). However, RBC and WBC were within the reference ranges provided by Hrubec et al. [6] for O. Niloticus, but lower than those found by Ighwela et al. [35]. However, both Hb and Ht were lower than those found by Adedeji and Adegbile [36] in Bagrid catfish (Chrysichthys nigrodigitatus) and African catfish (Clarias gariepinus). The control fish had significantly higher (P<0.05) RBC, Hb and Ht and within the reference ranges by Hrubec et al. [6]. The decrease in Ht and Hb by the fish given MT may signify condition deterioration as a result of androgen administration. The high number of WBC and lymphocytes in the control group may indicate adequate immune responses, since their amount has an implication in immune responses and the ability of fish to fight infection [36,37].
The histopathogy of fish heart has not received much attention in aquaculture research and scanty research is available. There were alteration of the fish heart in all the treatments and the control and these histopathological statuses were similar. Therefore, the changes cannot be attributed to MT, but probably to other factors. The changes in the fish heart were observed by Magar and Dube [38] on the heart of Channa punctus exposed to Malathion.
The liver plays a key role in the metabolism and biochemical transformations of pollutants from the environment, which inevitably reflects on its integrity by creating lesions and other histopathological alterations of the liver parenchyma or the bile duct [39,40]. There were no histopathological differences observed in the livers between the control and MT treated fish. However, brown granules of haemosidrein (HE) and extra-hepatic pancreas were observed in the liver tissue. The former indicate the destruction of blood, and is a step in the distergration of haemoglobin and the formation of bile pigment. Haemosidrein has higher presence of iron, and is considered as an iron overload disorder. We speculate that the presence of brown granules was caused by haemorrhage due to the inflammation of tissue, and cannot be attributed to the MT oral administration. This is because the rapid and continued destruction of RBC and breakdown of haemoglobin may have converted them into hemosiderin [41]. All the samples exhibited extra-hepatic pancreas a classical content of glycogen, which fills most of the cytoplasm. Extra-hepatic pancreas develops around the portal vein during ontogenesis.
Simple condition indices provide a useful assessment of the physiological well-being of fishes and provide an indirect means of evaluating ecological relations and the effects of various management strategies [42,43]. They are also a measure of the energy reserves of fishes, and their relationship with the environmental, maturity, feeding or parasitic conditions [44]. The slopes of the weight-length relationships were significant different (P<0.05) among the treatments. Furthermore, they were not close to the factor 3, showing that the fish in all the treatments exhibited allometric growth. However, the 90 mgMT/kg was in the worst condition, as it had the lowest slope value. The best condition, however, was shown in the control group followed by the 40 mgMT/kg feed treatment. The decline in growth exponent may indicate the deterioration of the physiological well-being of the fish as the MT levels increases.
The study shows that the oral administration of MT does not affect the physiology of O. Andersonii, as the haematology chemistry and histopathology of the liver and heart were similar to that of the control. The safety of MT to O. andersonii is therefore proved under the condition of the current experiment similar to the adopted sex reversal practices. However, they are signs of condition deterioration, as seen in the reduction of growth exponent and anaemic conditions in high levels of MT.
Acknowledgements
We are grateful to Regional Universities Forum for Capacity Building in Agriculture (RUFORUM) and International Development Research Centre (IDRC) for providing financial support towards the study. The Ministry of Agriculture and Livestock (MAL), Department of Fisheries (DOF), National Aquaculture Research and Development Centre and its staff are sincerely thanked for providing the experimental facilities, and for their priceless assistance in the study.
References
- Desprez D, Géraz E, Hoareau MC, Mélard C, Bosc P, et al. (2003) Production of a high percentage of male offspring with natural androgen, 11ß- hydroxyandrostenedione (11ßOHA4) in Florida red tilapia. Aquaculture 216: 55-65.
- Tave D (1993) Genetics for fish hatchery Managers. Springer, USA 436.
- Hulak M, Paroulek M, Simek P, Kocour M, Gela D, et al. (2008) Water polluted by 17a-methyltestosterone provides successful male sex inversion of common carp (Cyprinus carpio L) from gynogenetic offspring. J Appl Ichthyol 24: 707-710.
- Phelps RP, Popma TJ (2000) Sex reversal of tilapia. 34-59
- Soivio A, Oikari A (1976) Haematological effects of stress on a teleost, Esox lucius L. J Fish Biol8: 397-411.
- Hrubec TC, Cardinale JL, Smith SA (2000) Hematology and plasma chemistry reference intervals for cultured Tilapia (Oreochromis Hybrid). Vet Clin Pathol 29: 7-12.
- Vazquez GR, Guerrero GA (2007) Characterization of blood cells and haematological parameters in Cichlasoma dimerus (Teleostei, Perciformes). Tissue Cell 39: 151-160.
- Gabriel UU, Akinrotimi OA, Eseimokumo F (2011) Haematological responses of wild Nile Tilapia Oreochromis niloticus after acclimatisation to captivity. Jordan Journal of Biological Sciences 4: 225-230.
- Fernandes MN, Mazon AF (2003) Environmental pollution and fish gill morphology. In: Kapur BC (Ed.), Fish Adaptation Science Publication Enfield, USA.
- Savari A, Hedayati A, Safahieh A, Movahedinia A (2011) Characterisation of blood cells and haematological parameters of Yellowfin Sea Bream (Acanthopagrus latus) in some creeks of Persian Gulf. World J Zool 6: 26-32.
- Falahatkar B, Poursaeid S, Shakoorian M, Barton B (2009) Responses to handling and confinement stressors in juvenile great sturgeon Huso huso. J Fish Biol 75: 784-796.
- Zarejabad AM, Sudagar M, Pouralimotlagh S, Bastami KD (2009) Effects of rearing temperature on hematological and biochemical parameters of great sturgeon (Huso husoLinnaeus, 1758) juvenile. Comp Clin Pathol 19: 367-371.
- Hasanalipour A, Eagderi S, Poorbagher H, Bahmani M (2013) Effects of stocking density on Blood cortisol, glucose and cholesterol levels of immature Siberian Sturgeon (Acipenser baerri Brandt, 1869). Turk J Fish Aquat Sci13: 1-6.
- Kapila R, Kapila S, Basade Y (2000) Sex related haematological variations in Hamalaya golden mahseer, Tor putitora (Ham.). Ind J Fish 47.
- Summarwar S (2012) Comparative haematological studies of Clarius batrachus in Bisalpur reservoir and Pushkar Lake. Indian Journal of Fundamental and Applied Life Sciences 2: 230-233.
- Curtis LR, Diren FT, Hurley MD, Seimand WK, Tubb RA (1991) Disposition and elimination of 17 a - testosterone in Nile tilapia (Oreochromis niloticus). Aquaculture 99: 193-201.
- Ahmad MH, Shalaby AME, Khattab YAE, Abdel-Tawwab M (2002) Effects of 17 a–methyl testosterone on growth performance and some physiological changes of Nile tilapia fingerlings (Oreochromis niloticus L.). Egyptian Journal of Aquatic Biology and Fisheries 4: 295-311.
- Mateen A (2007) Effect of androgen on the sex reversal, growth and meat quality of Tilapia, Oreochromis niloticus.
- Celik I, Guner Y, Celik P (2011) Effect of orally-administered 17a-methyltestosterone at different doses on the sex reversal of the nile tilapia (Oreochromis niloticus, Linneaus 1758). J Anim Vet Adv 10: 853-857.
- Teichert-Coddington DR, Manning B, Eya J, Brock D (2000) Concentration of 17 a–methyl testosterone in hormone-treated feed: effects of analytical technique, fabrication and storage temperature. J World Aquac Soc 31: 42 -49.
- Duncan DB (1955) Multiple range and multiple F tests. Biometrics 11: 1-42.
- Pauly D, Prein M, Hopkins KD (1993) Multiple regression analysis of aquaculture experiments based on the ‘extended Gulland-and-Holt Plot’: Model derivation, data requirements and recommended procedures. ICLARM Studies and Reviews 13-23.
- Kefi AS, Kang’ombe J, Kassam D, Katongo C (2012) Growth, reproduction and sex ratios in Oreochromis andersonii (Castelnau, 1861) fed with varying levels of 17a-Methyl Testosterone. J Aquaculture Res Develop 3: 155.
- El-Hawarry W (2011) Biochemical and non-specific immune parameters of healthy nile tilapia (oreochromis niloticus), blue tilapia (Oreochromis aureus) and their interspecific hybrid (male O. aureus × female O. niloticus) maintained in semi-intensive culture system. Online Journal of Animal and Feed Research 2: 84-88.
- Schaperclaus W, Kulow H, Schreckenbach K (1992) Fish Disease. Balkema AA (Ed.), Rotterdam, Netherlands.
- Adham KA, Ibrahim HM, Hamed SS, Saleh RA (2002) Blood chemistry of the Nile Tilapia, Oreochromis niloticus (Linnaeus, 1757) under the impact of water pollution. Aquat Ecol 36: 549-557.
- Hasheesh WS, Marie MS, Abbas HH, Eshak MG, Zahran EA (2011) An evaluation of the effect of 17a-methyltestosterone hormone on some biochemical, molecular and histological changes in the liver of nile tilapia; Oreochromis niloticus. Life Sci J 8: 343-358.
- Abdel-Tawwab M, Wafeek M (2008) Response of Nile tilapia, Oreochromis niloticus (L.) to environmental cadmium toxicity during organic selenium supplementation. J World Aquaculture Soc 41: 106-114.
- Chen CY, Wooster GA, Getchell RG, Bower PA, Timmons MB (2003) Blood chemistry of healthy, nephrocalcinosis affected and ozone-treated tilapia in a recirculating system, with application of discriminant analysis. Aquaculture 218: 89-102.
- Deborah AS (1990) The effects of the synthetic steroid 17–alpha–methyl testosterone on the growth and organ morphology of the channel catfish (Ictalurus punctatus). Aquaculture 84: 81-93.
- Bhasin S, Bagatell CJ, Bremner WJ, Plymate SR, Tenover JL, et al. (1998) Issues in testosterone replacement in old men. J Clin Endocrinol Metab 83: 3435-3448.
- Borges A, Scotti LV, Siqueira DR, Jurinitz DF, Wasswemann GF (2007) Biochemical composition of seminal plasma and annualvariations in semen characteristics of jundia Rhamdia quelen (Quoy and Gaimard, Pimelodidae). Fish Physiol Biochem 31: 45-53.
- Katalay S, Pariak H (2004) The effects of pollution on haematological parameters of black goby in foca and aliaga bays. EU J Fish Aquatic Sci 21: 113-117.
- Akinrotini OA, Agokei EO, Aranyo AA (2012) Changes in blood parameters of Tilapia guineensis exposed to different salinity levels. J Environ Engg Technol 1: 4-12.
- Ighwela KA, Ahmed AA, Abol-Munafi AB (2012) Haematological changes in Tilapia (Oreochromis niloticus) fed with varying dietary maltose levels. World J Fish Mar Sci 4: 376-381.
- Adedeji OB, Adegbile AF (2011) Comparative haematological parameters of the bagrid catfish (Chrysichthys nigrodigitatus) and the African Catfish (Clarias gariepinus) from Asejire Dam inSouthwestern Nigeria. Journal of Applied Sciences Research 7: 1042-1046.
- Douglass JW, Jane KW (2010) Schalms Veterinary Haematology. John Wiley and Sons, Blackwell Publishing Ltd, USA.
- Magar RS, Dube KV (2013) Effect of sub lethal concentration of malathion on metabolic profiles and histological studies in heart tissue of Channa punctatus. J Environ Sci Toxicol Food Technol 2: 8-12.
- Roberts RJ, Ellis AE (1978) The anatomy and physiology of teleosts. In: Fish Pathol, (4th Edn), Robert RJ (Ed.), Wiley-Blackwell, Oxford, London, UK.
- Velkova-Jordanoska L, Kostoski G (2005) Histopathological analysis of liver in fish (Barbus meridionalis petenyi Heckel) in reserviour Trebenista. Natura Croatian 14: 147-153.
- Yacoub AM, Abdel Satar AM (2003) Heavy metals accumulation and macronutrients in the livers of some fish species of Bardawil lagoon and their histological changes. Egypt J Aquat Biol Fish 7: 403-422.
- Murphy BR, Wilis DW, Springer TA (1991) The relative weight index in fisheries management: Status and needs. Fisheries 16: 30-38.
- González C, Román E, Paz X (2006) Condition and feeding of american plaice (Hippoglossoides platessoides) in the North Atlantic with emphasis on the flemish cap. J Northw Atl Fish Sci 37: 87-102.
- Costopoulos CG, Fonds M (1989) Proximate body composition and energy content of plaice (Pleuronectes platessa) in relation to the condition factor. Netherlands J Sea Res 24: 45-55.
Relevant Topics
- Algal Blooms
- Blue Carbon Sequestration
- Brackish Water
- Catfish
- Coral Bleaching
- Coral Reefs
- Deep Sea Fish
- Deep Sea Mining
- Ichthyoplankton
- Mangrove Ecosystem
- Marine Engineering
- Marine Fisheries
- Marine Mammal Research
- Marine Microbiome Analysis
- Marine Pollution
- Marine Reptiles
- Marine Science
- Ocean Currents
- Photoendosymbiosis
- Reef Biology
- Sea Food
- Sea Grass
- Sea Transportation
- Seaweed
Recommended Journals
Article Tools
Article Usage
- Total views: 16419
- [From(publication date):
November-2013 - Jul 02, 2025] - Breakdown by view type
- HTML page views : 11639
- PDF downloads : 4780