Dual Mechanisms of Ethanol-Impaired Placentation: Experimental Mode
Received: 15-Apr-2013 / Accepted Date: 12-Jun-2013 / Published Date: 14-Jun-2013 DOI: 10.4172/2161-0681.1000142
Abstract
Background: One of the major adverse effects of maternal ethanol consumption is intrauterine growth restriction (IUGR). Previous studies demonstrated that ethanol-induced IUGR is mediated by impaired placentation. Chronic gestational ethanol exposure reduces trophoblastic cell motility and invasiveness through inhibition of insulin/IGF signaling leading to impaired vascular transformation at the implantation site. Furthermore, ethanol reduces the number of secondary giant cells that mediate vascular invasion in rat placenta. However, the degree to which ethanol inhibits progenitor cell survival and differentiation is not known.
Study Design: To determine the effects of ethanol exposure on trophoblastic cell resilience, pregnant Long Evans rats were fed isocaloric liquid diets containing 0% or 8.2% (v/v) ethanol. The diets were initiated at different embryonic days (E) corresponding to stem cell activation (E6), appearance of secondary trophoblast giant cells (E10), accumulation of glycogen cells (E14), and prior to (E15) and after (E16) trophoblast invasion of the implantation site. Pups were harvested on E19 to evaluate growth parameters. Placental tissue was used for histological, immunohistochemical, and molecular studies.
Results: Severity of fetal growth impairment correlated with early ethanol exposures (E6, E10). Vascular transformation was inhibited by ethanol with more profound effects in earlier exposure groups. Correspondingly, invasive trophoblastic cells and their precursor secondary giant cells were reduced in ethanol groups and degree of reduction was increased by earlier exposures. The mRNA expression levels of genes encoding stem cell, trophoblast giant cell, and invasive trophoblast were significantly reduced by ethanol in accordance with timing of their activity.
Conclusion: Gestational ethanol exposure impairs placentation by reducing progenitor cells and compromising trophoblast invasion.
Keywords: Fetal alcohol spectrum disorder; Placenta; Trophoblast differentiation; IUGR; Development
309892Introduction
Alcohol consumption during pregnancy induces a range of physical defects and cognitive, behavioral, and emotional disabilities that are collectively termed “Fetal Alcohol Spectrum Disorders” (FASD) [1]. Fetal Alcohol Syndrome (FAS) is the most severe form of FASD, and the leading preventable cause of birth defects and developmental disorders in the United States [2].
Intrauterine growth restriction (IUGR) is a key feature of FASD. Experimentally, gestational ethanol exposure mediates its adverse effects on fetal growth by: 1) impairing placentation, which is crucial for establishing the maternal-fetal interface needed for nutrient delivery and waste removal; 2) inducing oxidative stress, lipid peroxidation and DNA damage [3]. Previous studies focused on the adverse effects of ethanol on insulin/IGF signaling in relation to trophoblast cell motility and invasiveness, and linked these abnormalities to impairments in placentation, intrauterine growth restriction, and early pregnancy loss [4]. In addition, the adverse effects of ethanol were found to be mediated by inhibition of Aspartyl-Asparaginylß-Hydroxylase (AAH) [5]. AAH is aninsulin/IGF-responsive gene, whose hydroxylase activity regulates cell motility and invasion [6,7]. Furthermore, gestational exposure to ethanol reduced the number of secondary trophoblast giant cells [4] and altered trophoblast subtype-specific gene expression [3].
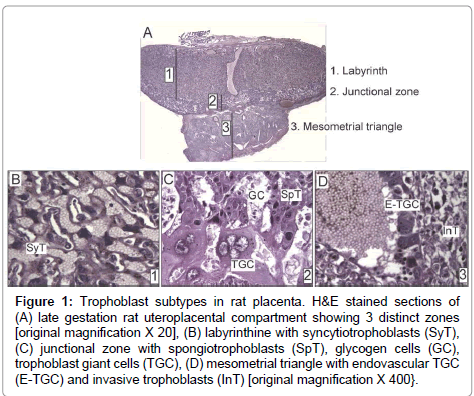
Trophoblast giant cells are the first specified cell type during mammalian development. Many genes that participate in trophoblast giant cell development and function are conserved among rodents and humans [8]. The trophectoderm layer of blastocyst, which is Cdx2- positive, is the precursor of all trophoblast subtypes (Supplementary Figure). The embryo develops from the inner cell mass, which differentially expresses Nanog, Oct4, and Sox2 [9]. Upon implantation, the portions of trophectoderm that are not in contact with the inner cell mass differentiate into primary trophoblast giant cells that surround the future parietal yolk sac. In contrast, the trophectoderm that is in direct contact with the inner cell mass retains its undifferentiated status and capacity to proliferate, and the cell population expands to form the extraembryonic ectoderm and ectoplacental cone [9]. Trophoblast stem cells provide the ectoplacental cone with progenitors that give rise to spongiotrophoblast and secondary trophoblast giant cells [9]. While in the progenitor phase, trophoblast stem cells express Mash2 and Tpbpa [10]. In rodents, by embryonic day (E) 8.5, trophoblast stem cell potential is lost with the attachment of chorion to the allantois. The latter process initiates formation of the labyrinth layer (Figure 1A) of the placenta where allantoic mesoderm gives rise to mesenchyme and blood vessels, and initiates branching morphogenesis to generate villi. Villi are lined by syncytiotrophoblast (Figure 1B), while labyrinth sinusoidal trophoblast giant cells line maternal blood sinusoids. The labyrinth regulates nutrient, waste and gas exchange between mother and fetus [11].
Figure 1: Trophoblast subtypes in rat placenta. H&E stained sections of (A) late gestation rat uteroplacental compartment showing 3 distinct zones [original magnification X 20], (B) labyrinthine with syncytiotrophoblasts (SyT), (C) junctional zone with spongiotrophoblasts (SpT), glycogen cells (GC), trophoblast giant cells (TGC), (D) mesometrial triangle with endovascular TGC (E-TGC) and invasive trophoblasts (InT) [original magnification X 400}.
The junctional zone (Figure 1A) between the labyrinth and decidua consists of spongiotrophoblasts, glycogen cells, and trophoblast giant cells (Figure 1C). Spongiotrophoblasts are the dominant source of prolactin family molecules [12]. Sometime after E12.5, glycogen trophoblasts appear within the spongiotrophoblast layer [13], and they express high levels of IGF-2 during the second half of gestation [9]. Secondary trophoblast giant cells that are in direct contact with decidua form the outermost layer of placenta and mediate vascular invasion. The temporal appearance of trophoblast subtypes has been described in mice [14]. Trophoblast invasion into decidua starts around midgestation when glycogen cells invade in a diffuse interstitial pattern, while endovascular trophoblast giant cells invade spiral arteries in the mesometrial triangle (Figure 1D), replacing the endothelium and promoting trophoblast-lined maternal blood spaces [9,13,15]. Their overall role is to regulate maternal artery remodeling and provide unrestricted blood flow into the placenta. As an experimental model, we use rats because of their hemochorial placentation and deep trophoblastic invasion similar to humans [16].
Ethanol alters the expression of genes that have key roles in regulating stem cell differentiation [17-20]. However, the effects of ethanol on trophoblast differentiation are largely unknown. The present study was designed to characterize effects of gestational ethanol exposure on trophoblastic differentiation by examining placental morphology and time-dependent shifts in maturation of trophoblasts.The latter was gauged bymeasuring mRNA levels of genes expressed in glycogen cells (Gjb3), trophoblast giant cells (Prl3b1), invasive trophoblasts (Prl2a1, Prl5a1, Mmp2), and progenitor cells (Tpbpa).
Materials and Methods
Timed pregnanciesto characterize the temporal appearance of trophoblast subtypes
Although the temporal appearance of trophoblast subtypes is well characterized for mice [9,14], the critical time points of placentation have not been established for rats. Female and male Long Evans rats were caged together, and the first detection of sperm in the vagina of a metestrous rat was designated as day 0 of pregnancy [21]. The rats were maintained on chow and placental tissue with underlying mesometrial triangle was harvested on eachembryonic day (E) fromE12 to E19.The specimens were immersion fixed in Histochoice for light microscopy.
Gestational ethanol exposure model
Pregnant Long Evans rats were pair-fed isocaloricliquid diets (BioServ, Frenchtown, NJ) containing 0% or 8.2 % (v/v) ethanol. The 8.2% (v/v) ethanol-containing diet typically produces blood alcohol concentrations of 51.1 ± 11.9 mM [22]. Based on the results of the normal mouse placentation studies[9,14] and the temporal appearance of trophoblast subtypes in the timed rat pregnancies, ethanol diets were initiated at different embryonic days corresponding to stem cell activation (E6), appearance of secondary trophoblast giant cells (E10), accumulation of glycogen cells (E14), and prior to (E15) and after (E16) trophoblast invasion into implantation site. Dams were monitored daily to ensure equivalent food consumption, and weighed weekly after E0. Fetuses and placentas were harvested for study on E19, because that point marks completion oftrophoblast cell invasion into decidua and spiral arteries [23]. Placental tissue with underlying mesometrial triangle was weighed, immersion fixed in Histochoice, and embedded in paraffin for histological sectioning [4]. Alternatively, placenta was separated from mesometrial triangle [4] and both tissue compartments were snap frozen in a dry ice-methanol bath to be stored at -80°C for later mRNA and protein studies. Fetal body weights and crown-rump lengths were measured. Embryonic day was confirmed based on fetal developmental stage [24]. The Institutional Animal Welfare Committee at Rhode Island Hospital approved this study.
Immunohistochemistry
Histological sections of placenta with underlying mesometrial triangle (5 μm thick) were immunostained with monoclonal antibody to Cytokeratin (CK) to detect invasive trophoblastic cells at the implantation site as previously described [5,23]. Briefly, deparaffinized and rehydrated tissue slides were incubated in preheated EnVision™ FLEX Target Retrieval Solution (high pH=9.0) for 20 minutes at 95- 100°C. Slides were rinsed in EnVision™ FLEX wash buffer and treated with 3% hydrogen peroxide for 5 minutes to quench the endogenous peroxidase activity. After rinsing in wash buffer, the slides were incubated for 20 minutes at room temperature with a 1:50 dilution of monoclonal cytokeratin antibody (DAKO # M0821, clone MNF-116). Antibody binding was detected with EnVision™ FLEX/HRP detection reaction, which consists of a dextran backbone to which a large number of Peroxidase (HRP) molecules and secondary antibody molecules have been coupled.
Diamino Benzidinetetrahydrochloride (DAB) was used as the chromogen. The sections were then counterstained lightly with hematoxylin. All immunohistochemical staining reactions were performed using the DakoAutostainer (Dako, Carpenteria, CA).
Stereology
CK-positive invasive trophoblastic cells within the mesometrial triangle were quantified using unbiased stereology [5]. Numerical density calculation was performed with the aid of an Olympus BX60 light microscope (Olympus America Inc., Center Valley, PA) with attached MS-2000 XYZ Inverted Stage (Applied Scientific Instrumentation, Eugene, OR), and Stereologer software (Stereology Resource Center, Inc., Chester, MD). The entire mesometrial triangle up to the junctional zone of the placenta served as the anatomical area of interest at low magnification (4X). The diffuseness of CKimmunoreactivity in the junctional zone helped delineate the upper boundary of the mesometrial triangle. Sections displaying linear maternal spiral arteries with maternal channel continuation were evaluated for consistency in approach. Unbiased counting frames were applied under software control. CK-positive invasive trophoblasts and Trophoblast Giant (TGC) cells were counted at 40X magnification using the optical dissector method. To quantify TGCs at the junctional zone, the entire junctional zone was selected as the anatomical area of interest. TGCs were identified based on size and cellular features. Results were normalized to tissue volume, which was determined using the Cavalieri point grid method.
Quantitative reverse transcriptase polymerase chain reaction (qRT-PCR) analysis
We used qRT-PCR to measure mRNA expression of trophoblast subtype-associated genes (Table 1) as previously described [3,25]. In brief, placental tissue was homogenized in Qiazol reagent using a TissueLyser II apparatus (Qiagen Inc., Valencia, CA). Total RNA was isolated using the EZ1 RNA universal tissue kit and the BIO Robot EZ1 (Qiagen Inc., Valencia, CA). RNA was reverse transcribed using random oligodeoxynucleotide primers and the AMV First Strand cDNA synthesis kit (Roche, Indianapolis, IN). The cDNA templates were used in qPCR amplification reactions with gene specific primer pairs (Table 2). Primers were designed using MacVector 10 software (MacVector, Inc., Cary, NC) and their target specificities were verified using NCBIBLAST (Basic Local Alignment Search Tool). The amplified signals were detected using LightCycler 480 and analyzed with the respective software (LightCycler® Software 4.0, Roche, Indianapolis, IN). Relative mRNA abundance was calculated from the ng ratios of specific mRNA to 18S rRNA measured in the same samples. Assays were performed in triplicate. Inter-group statistical comparisons were made using the calculated mRNA/18S ratios.
| Trophoblast subtype | Gene expression | |
|---|---|---|
| Trophoblast stem cells | Cdx2 | Caudal type homeobox 2 |
| Spongiotrophoblast | Tpbpa | Trophoblast specific protein alpha |
| Trophoblast giant cells | Prl3b1 | Prolactin family 3, subfamily b, member 1 |
| Glycogen cells | Gjb3 | Gap junction protein, beta 3 |
| Invasive trophoblast | Prl2a1 | Prolactin family 2, subfamily a, member 1 |
| Prl5a1 | Prolactin family 5, subfamily a, member 1 | |
| Mmp2 | Matrix metalloproteinase | |
Table 1: Trophoblast subtype associated gene expression.
| Primer | Sequence (5’→3’) | Position (mRNA) | Amplicon size (bp) | |
|---|---|---|---|---|
| 18S | For | GGA CAC GGA CAG GAT TGA CA | 1278 | 50 |
| Rev | ACC CAC GGA ATC GAG AAA GA | 1327 | ||
| Cdx2 | For | AGA CGA GTG GGA TTG TGG AC | 1190 | 155 |
| Rev | GAA AGC TTG GTG CCT GTA GC | 1344 | ||
| Tpbpa | For | GCC ACT GTG CCA TTG TCT AAG G | 489 | 100 |
| Rev | GCC CCT GCT GTT TTT GCT TC | 588 | ||
| Prl3b1 | For | CAT AGT GGC AGC AGT GGC TA | 360 | 232 |
| Rev | CAT GCA CCG ATA CAG GAC AC | 591 | ||
| Gjb3 | For | ATC TGG CTG TCG GTA GTG TTC G | 67 | 464 |
| Rev | TAG CAA TCC ACG GTG TTG GG | 530 | ||
| Prl2a1 | For | GTG AAC AAC CTG CCA TCC TT | 423 | 236 |
| Rev | CTA CCC TCA CAG CGG ATC AT | 658 | ||
| Prl5a1 | For | GCT GCTGCT TCT GTC AAA CTT GC | 86 | 205 |
| Rev | CCT GTT CTG GAA TGT CTG GTG TG | 290 | ||
| Mmp2 | For | ATC CCG TTA TGA GAC CCT GAG C | 145 | 161 |
| Rev | AAT CGT GCC TCC ATC CTT GC | 305 | ||
*Cdx2: Caudal Type Homeobox 2; Tpbpa: Trophoblast Specific Protein Alpha; Prl3b1: Prolactin Family 3, Subfamily b, Member 1; Gjb3: Gap Junction Protein, Beta 3; Prl2a1: Prolactin Family 2, Subfamily a, Member 1; Prl5a1: Prolactin Family 5, Subfamily A, Member 1; Mmp2: Matrix Metalloproteinase 2; For: Forward Primer; Rev: Reverse Primer; Position: Initial Nucleotide For Primer Binding; Bp: Base Pair Size of Amplicon.
Table 2: Primer pair sequences for real-time quantitative RT-PCR*.
Statistical analysis
Data corresponding to body weight and length, stereology or levels of gene expression are depicted in boxplot graphs representing the means (horizontal bars), 95% confidence intervals (box limits), and range (whiskers) for each group. Inter-group comparisons were made using one-way Analysis of Variance (ANOVA) with the Tukey’s multiple comparisons post-hoc test of statistical significance. Statistical analyses were performed using the GraphPAd Prism 5 software (San Diego, CA) and significant P-values (<0.05) are indicated within the graph panels.
Materials
Histofix was purchased from Histochoice (Amresco, Solon, OH). Monoclonal antibody to cytokeratin (clone MNF-116) and all the reagents for immunohistochemistry were purchased from Dako (Carpenteria, CA).Qiazol reagent, EZ1 RNA universal tissue kit, QuantiTectSYBR Green polymerase chain reaction (PCR) master mix, and the BIO Robot Z1 were purchasedfrom Qiagen Inc. (Valencia, CA). AMV first strand cDNA synthesis kit was obtained from Roche Diagnostics Corporation (Indianapolis, IN). PCR primers were purchased from Sigma Chemical Co. (St. Louis, MO).
Results
Temporal appearance of trophoblast subtypes
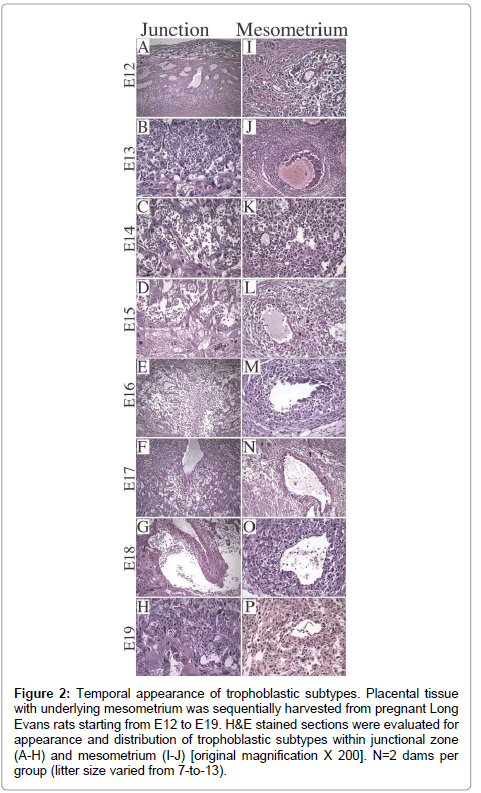
Litter size ranged from 7-to-13 (median=11). On E12, the dominant cell type was Trophoblast Giant Cell (TGC) and the thickness of placenta was 1/4th of the full thickness of the specimen (Figure 2A). Glycogen cells appeared in the junctional zone on E13, formed large masses on E15,and burst into decidua and invaded the mesometriumby E16 (Figure 2B-2G), resulting in markedly reduced populations of glycogen cells in the junctional zone by E19 (Figure 2H). With regard to the uterine spiral arteries, on E12, they had thick, muscular walls (Figure 2I), and on E13, endovascular TGCs appeared (Figure 2J). By E17, the TGCs disappeared (Figure 2N). Glycogen cells appeared singly in the decidua on E14 (Figure 2K- 2N), and thereafter, their numbers increased. Vascular transformation of the uterine spiral arteries was completed by E18 (Figure 2O).
Figure 2: Trophoblast subtypes in rat placenta. H&E stained sections of (A) late gestation rat uteroplacental compartment showing 3 distinct zones [original magnification X 20], (B) labyrinthine with syncytiotrophoblasts (SyT), (C) junctional zone with spongiotrophoblasts (SpT), glycogen cells (GC), trophoblast giant cells (TGC), (D) mesometrial triangle with endovascular TGC (E-TGC) and invasive trophoblasts (InT) [original magnification X 400}.
Severity of ethanol-induced IUGR depends on the timing and duration of the insult
We harvested the placentas and fetuses on E19 from 3 control (0% ethanol) and 15 ethanol-exposed dams (N=3 per diet-initiation day: E6, E10, E14, E15, E16). The litter size in control group ranged from 8-to-14. The litter size range of the ethanol groups were as follows: E6 7-to-10, E10 9-to-13, E14 8-to-12, E15 9-to-12, and E16 7-to-13. We detected 6 fetal resorption sites in dams exposed to ethanol starting on E6. In the other ethanol-exposed groups fetal resorption sites ranged from 1 (control and E16) to 3 (E10). The inter-group difference was not statistically significant.
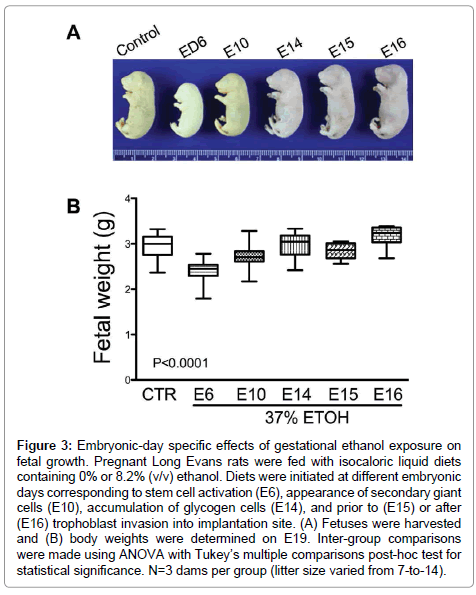
The mean body weight of control fetuses was 2.95 ± 0.05 g (mean ± S.E.M.). Early ethanol exposure significantly reduced mean fetal weight (E6 – 2.41 ± 0.04 g, E10 – 2.72 ± 0.02 g (E10); P<0.0001), whereas later onset ethanol exposures had no significant effects on fetal weight relative to control (Figure 3). In addition, fetal weight was significantly lower when ethanol exposure was initiated on E15 (2.83 ± 0.05 g; P<0.05) compared with E14 (2.96 ± 0.08 g) and E16 (3.17 ± 0.1 g).
Figure 3: Embryonic-day specific effects of gestational ethanol exposure on fetal growth. Pregnant Long Evans rats were fed with isocaloric liquid diets containing 0% or 8.2% (v/v) ethanol. Diets were initiated at different embryonic days corresponding to stem cell activation (E6), appearance of secondary giant cells (E10), accumulation of glycogen cells (E14), and prior to (E15) or after (E16) trophoblast invasion into implantation site. (A) Fetuses were harvested and (B) body weights were determined on E19. Inter-group comparisons were made using ANOVA with Tukey’s multiple comparisons post-hoc test for statistical significance. N=3 dams per group (litter size varied from 7-to-14).
Gestational ethanol exposure alters placental maturation in an embryonic-day specific manner
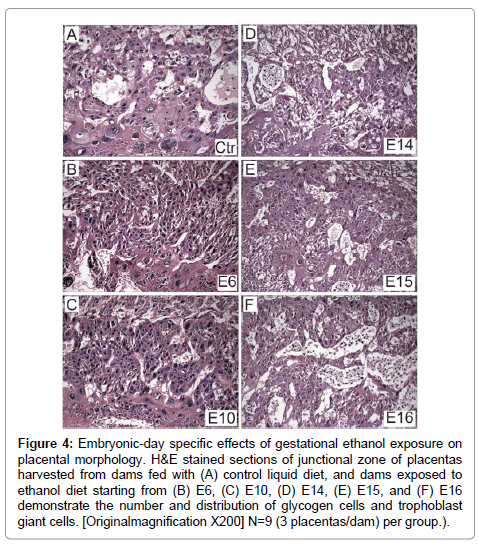
H&E stained sections of full thickness placentas with mesometrial triangle revealed the presence ofoccasional glycogen cells at the junctional zone and TGCs at the decidual border in controls (Figure 4A). In contrast, ethanol exposure had two distinct effects depending on timing. Initiation of the ethanol exposures on E6 or E10 resulted in a lack of glycogen cells at the junctional zone (Figures 4B and 4C), whereas, later timing of exposures (E14, E15, E16) caused glycogen cells to increase in abundance at the junctional zone (Figures 4D-4F). In specimens harvested from rats exposed to ethanol on E16, glycogen cells were present in large aggregates in the junctional zone (Figure 4F).
Figure 4: Embryonic-day specific effects of gestational ethanol exposure on placental morphology. H&E stained sections of junctional zone of placentas harvested from dams fed with (A) control liquid diet, and dams exposed to ethanol diet starting from (B) E6, (C) E10, (D) E14, (E) E15, and (F) E16 demonstrate the number and distribution of glycogen cells and trophoblast giant cells. [Originalmagnification X200] N=9 (3 placentas/dam) per group.).
Unbiased stereology demonstrated that TGC abundance ranged from 7.87 0.68 (mean ± S.E.M.) in the E6 ethanol-exposure group to 10.36 0.36 in E16ethanol-exposure group (E10: 8.12 ± 0.51; E14: 8.4 ± 0.48; E15: 7.89 ± 0.21). TGC abundance was significantly reduced in allethanol-exposure groups relative to control (14.08 ± 0.89; P<0.0001).
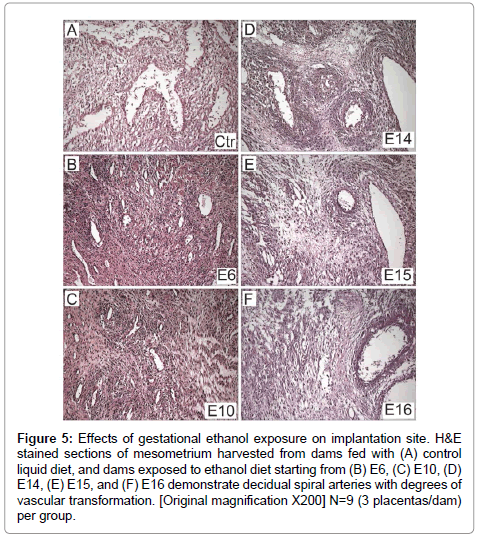
There was uniform vascular transformation of spiral arteries within the mesometrial triangle in control and E16 ethanol-exposure groups (Figures 5A-5F). In contrast, vascular transformation was progressively impaired with earlier onset exposure to ethanol. In the E6 (Figure 5B) and E10 (Figure 5C) groups, the spiral arteries were small and maintained their muscular walls throughout the mesometrial triangle. Ethanol-exposures from E14 (Figure 5D) or E15 (Figure 5E) variably impaired vascular transformation of the spiral arteries.
Figure 5: Effects of gestational ethanol exposure on implantation site. H&E stained sections of mesometrium harvested from dams fed with (A) control liquid diet, and dams exposed to ethanol diet starting from (B) E6, (C) E10, (D) E14, (E) E15, and (F) E16 demonstrate decidual spiral arteries with degrees of vascular transformation. [Original magnification X200] N=9 (3 placentas/dam) per group.
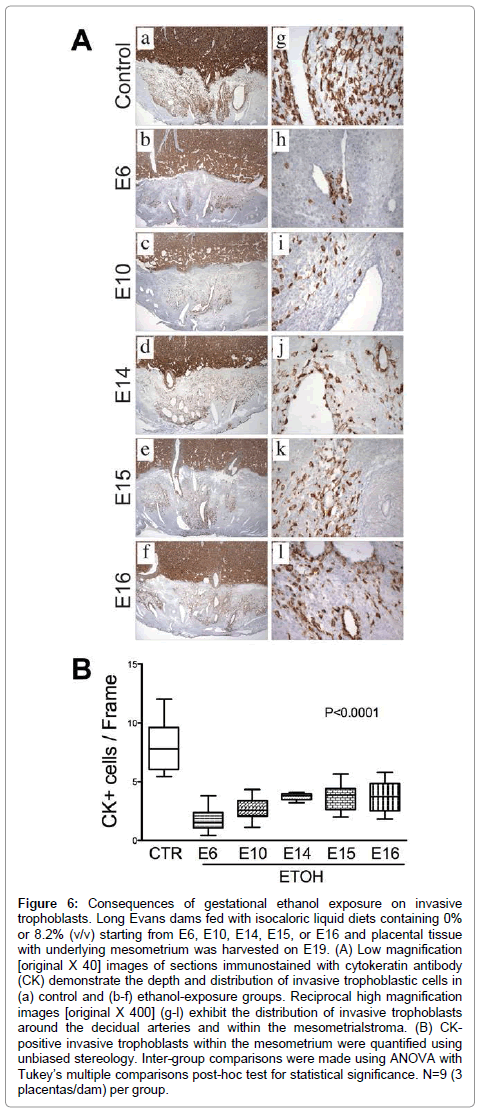
Invasive trophoblastic cells, marked by Cytokeratin (CK) immunoreactivity (Figure 6A), were distributed at the center of the mesometrial triangle, predominantly around the decidualspiral artery. Control placentas exhibited dense and widely distributed invasive trophoblastic cells in their mesometrial triangles (Figure 6A-a). Most of these cells were interstitial and exhibited focal endovascular invasion of the spiral artery and arterioles (Figure 6A-g). Ethanol exposure significantly reduced the number and density of CK-positive invasive trophoblastic cells inmesometrial triangles, as demonstrated by image analysis (P<0.0001, (Figure 6B) & (Figures 6A-a–6A-l). Moreover, trophoblastic cell invasion was shallower in the ethanol groups relative to control. Earlier onsets of ethanol exposure incrementally reduced the depth of trophoblastic cell invasion.
Figure 6: Consequences of gestational ethanol exposure on invasive trophoblasts. Long Evans dams fed with isocaloric liquid diets containing 0% or 8.2% (v/v) starting from E6, E10, E14, E15, or E16 and placental tissue with underlying mesometrium was harvested on E19. (A) Low magnification [original X 40] images of sections immunostained with cytokeratin antibody (CK) demonstrate the depth and distribution of invasive trophoblastic cells in (a) control and (b-f) ethanol-exposure groups. Reciprocal high magnification images [original X 400] (g-l) exhibit the distribution of invasive trophoblasts around the decidual arteries and within the mesometrialstroma. (B) CKpositive invasive trophoblasts within the mesometrium were quantified using unbiased stereology. Inter-group comparisons were made using ANOVA with Tukey’s multiple comparisons post-hoc test for statistical significance. N=9 (3 placentas/dam) per group.
Gestational ethanol exposure alters trophoblast-subtype associated gene expression
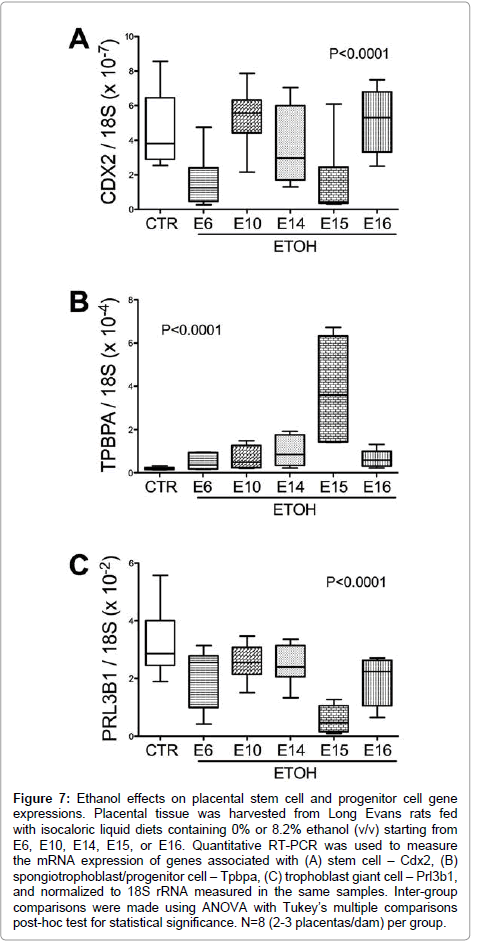
Chronic gestational ethanol exposure significantly altered stem cell associated Cdx2 expression (P<0.001; F value=10.47, (Figure 7A). Post-hoc tests demonstrated significant inter-group differences from control with respect to the E6 and E15 ethanol exposure groups. Spongiotrophoblast-associated Tpbpa mRNA levels were elevated by ethanol exposure (F value=16.57; P<0.0001; (Figure 7B). Post-hoc Tukey tests demonstrated significant differences from control with respect to the E15 ethanol-exposure group (P<0.001). Trophoblast giant cell associated Prl3b1 mRNA levels were significantly reduced in all ethanol exposure groups relative to control (P<0.0001; F value= 14.82; (Figure 7C).
Figure 7: Ethanol effects on placental stem cell and progenitor cell gene expressions. Placental tissue was harvested from Long Evans rats fed with isocaloric liquid diets containing 0% or 8.2% ethanol (v/v) starting from E6, E10, E14, E15, or E16. Quantitative RT-PCR was used to measure the mRNA expression of genes associated with (A) stem cell – Cdx2, (B) spongiotrophoblast/progenitor cell – Tpbpa, (C) trophoblast giant cell – Prl3b1, and normalized to 18S rRNA measured in the same samples. Inter-group comparisons were made using ANOVA with Tukey’s multiple comparisons post-hoc test for statistical significance. N=8 (2-3 placentas/dam) per group.
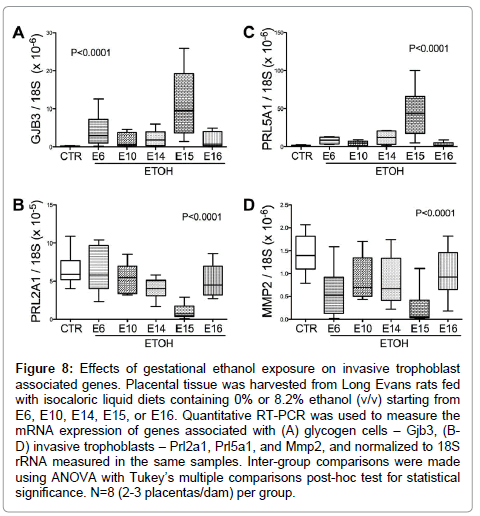
Glycogen cell specific Gjb3 mRNA levels were significantly elevated (P<0.0001; F value= 15.84; (Figure 8A), while Prl2A1 mRNA levels were reduced (P<0.0001; F value= 12.66; (Figure 8B) by ethanol exposure. Post-hocTukey’s tests revealed significant differences between control and ethanol-exposed E14 (P<0.05) and E15 (P<0.0001) samples. Finally, the mRNA levels of the invasive trophoblast cell marker Prl5a1, which is normally limited to the metrial gland, were elevated in the E15 ethanol-exposed group (F value=21.25; P<0.0001; (Figure 8C). In addition, Mmp2 expression, another marker for invasive trophoblasts, was reduced in all ethanol-exposed groups (P<0.0001; F value=9.57; (Figure 8D). The levels resulting from ethanol exposures beginning on E15 were lower than in all other groups (P<0.0001).
Figure 8: Effects of gestational ethanol exposure on invasive trophoblast associated genes. Placental tissue was harvested from Long Evans rats fed with isocaloric liquid diets containing 0% or 8.2% ethanol (v/v) starting from E6, E10, E14, E15, or E16. Quantitative RT-PCR was used to measure the mRNA expression of genes associated with (A) glycogen cells – Gjb3, (BD) invasive trophoblasts – Prl2a1, Prl5a1, and Mmp2, and normalized to 18S rRNA measured in the same samples. Inter-group comparisons were made using ANOVA with Tukey’s multiple comparisons post-hoc test for statistical significance. N=8 (2-3 placentas/dam) per group.
Discussion
This study demonstrates embryonic-day specific effects of gestational ethanol exposure on fetal growth and placental development. The range and severity of clinical symptoms of FASD has been explained by variations in timing, duration and dose of maternal alcohol consumption [26]. Herein, we demonstrated that earlier and longer exposures to ethanol during embryonic development result in substantial IUGR relative to later and shorter duration exposures.
Our interest in glycogen cells and TGCs stems from the fact that these precursors of invasive trophoblasts are required for vascular transformation [9,27]. Regardless the insult timing, gestational ethanol exposure reduced TGC abundance. In contrast, glycogen cell responses to ethanol varied by the timing of the insults. In early ethanol exposure groups, glycogen cells were nearly undetectable whereas following late gestation ethanol exposures they formed large aggregates. Correspondingly, gestational ethanol exposures significantly reduced invasive trophoblast cell populations in the mesometrial triangle, irrespective of the timing, although the reductions were more profound in early-compared with late-onset exposures. Consequently, gestational ethanol exposure impaired transformation of maternal decidual arteries such that the degree of impairment correlated with timing and duration of the insult, and severity of IUGR. The paradoxical response of glycogen cells may have been due to ethanol-inhibition of trophoblast cell motility and invasion [4,5,7]. Impaired motility of glycogen cells into the mesometrial triangle could account for their observed accumulation in the junctional zone. Moreover, this concept could explain the elevated IGF2 mRNA levels previously measured in ethanol-exposed placentas [4], since glycogen cells are the main source of placental IGF2 in the second half of gestation [28].
Cdx2 is a critical determinant of trophectoderm identity and the earliest factor mediating trophoblast lineage development [9]. Trophoblast stem cell potential is lost by E8.5, suggesting that other progenitor cells assume their functions in later gestation [9]. We measured placental Cdx2 mRNA levels as a marker of trophoblast stem cells. We hypothesized that ethanol exposure, starting from E6 would alter stem cells and trophoblast cell differentiation. Placental Cdx2 expression was significantly reduced by gestational ethanol exposure with further alterations downstream supporting this hypothesis. However, gestational ethanol exposure starting from E15 also significantly reduced Cdx2 mRNA levels suggesting that E15 is a critical time point for trophoblast stem cell activation. While Tpbpa is considered a genetic marker for spongiotrophoblast differentiation, overlap exists with respect to Mash2 expression in differentiating spongiotrophoblasts [10] and Gjb3 (also known as connexin 31)-positive glycogen cells [9]. The ethanol-induced Tpbpa expression, which was most profound in the E15 exposure samples, could reflect either a compensatory response of progenitor cells to ameliorate the effects of ethanol on TGC, or an increase in the number of glycogen cells at the junctional zone.
TGCs are terminally differentiated, polypoid cells that mediate invasion of decidua [29]. Primary TGCs are derived from mural trophectoderm immediately following implantation, while secondary TGCs originate from precursors located in the ectoplacental cone and spongiotrophoblast [10]. Four TGC subtypes that have been identified: 1) parietal TGCs, which line the implantation site; 2) spiral arteryassociated TGCs; 3) maternal blood canal-associated TGCs; and 4) sinusoidal TGCs [30]. Herein, we focused on parietal TGCs, which arise via primary and secondary TGC differentiation [30]. In mice, parietal TGCs appear around E7.5, while all other subtypes appear around E10.5 [30]. In developing rat placenta, TGCs are the main source of Prl3b1 [31], whose production starts in mid-gestation, and represent the dominant lactogenic hormone throughout the second half of gestation [12]. Herein, we found that gestational ethanol exposure significantly reduced placental Prl3b1 expression, particularly when the ethanol exposures were initiated on E15, consistent with previous observations [3]. While this effect could have been caused by altered differentiation in early exposure groups, ethanol-induced oxidative stress and apoptosis [3] also may have contributed to this outcome.
Gestational ethanol exposure induced glycogen cell-specific Gjb3 expression, corresponding with increased glycogen cells detected by histologic studies. Although the origin of glycogen cells is still debated, their co-expression of the spongiotrophoblast-specific gene, Tpbpa (also known as 4311), suggests a spongiotrophoblast derivation [13]. The function of Gjb3 in glycogen cell development is not clear [14].
As invasive trophoblast markers, we measured Prl2a1, Prl5a1, and Mmp2 expression by qRT-PCR analysis. Since Prl5a1 expression is normally restricted to mesometrium [27], the elevated placental levels in ethanol-exposed placentas points towards cellular shifts within junctional zone. On the other hand, the finding that ethanol reduces expression of Prl2a1and Mmp2, which are normally present in placenta and mesometrium [27] highlights the detrimental effects of ethanol on invasive trophoblastic cell function.
Together, the results demonstrate that gestational ethanol exposure alters placental morphology and trophoblastic subtype populations even in late gestation. We conclude that gestational ethanol exposure has dual inhibitory effects on placentation mediated by reductions in the population of progenitor cells and impairments in trophoblastic cell function, including motility and invasion.
Acknowledgements
Research was supported by AA-016783 and AA-16126 from the National Institutes of Health and presented at Society for Pediatric Pathology Fall Meeting in 2012.
References
- Barr HM, Streissguth AP (2001) Identifying maternal self-reported alcohol use associated with fetal alcohol spectrum disorders. Alcohol Clin Exp Res 25: 283-287.
- Bailey BA, Sokol RJ (2008) Pregnancy and alcohol use: evidence and recommendations for prenatal care. Clin Obstet Gynecol 51: 436-444.
- Gundogan F, Elwood G, Mark P, Feijoo A, Longato L, et al. (2010) Ethanol-induced oxidative stress and mitochondrial dysfunction in rat placenta: relevance to pregnancy loss. Alcohol Clin Exp Res 34: 415-423.
- Gundogan F, Elwood G, Longato L, Tong M, Feijoo A, et al. (2008) Impaired placentation in fetal alcohol syndrome. Placenta 29: 148-157.
- Gundogan F, Bedoya A, Gilligan J, Lau E, Mark P, et al. (2011) siRNA inhibition of aspartyl-asparaginyl β-hydroxylase expression impairs cell motility, Notch signaling, and fetal growth. Pathol Res Pract 207: 545-553.
- de la Monte SM, Tamaki S, Cantarini MC, Ince N, Wiedmann M, et al. (2006) Aspartyl-(asparaginyl)-beta-hydroxylase regulates hepatocellular carcinoma invasiveness. J Hepatol 44: 971-983.
- de la Monte SM, Tong M, Carlson RI, Carter JJ, Longato L, et al. (2009) Ethanol inhibition of aspartyl-asparaginyl-beta-hydroxylase in fetal alcohol spectrum disorder: potential link to the impairments in central nervous system neuronal migration. Alcohol 43: 225-240.
- Cross JC, Baczyk D, Dobric N, Hemberger M, Hughes M, et al. (2003) Genes, development and evolution of the placenta. Placenta 24: 123-130.
- Simmons DG, Cross JC (2005) Determinants of trophoblast lineage and cell subtype specification in the mouse placenta. Dev Biol 284: 12-24.
- Carney EW, Prideaux V, Lye SJ, Rossant J (1993) Progressive expression of trophoblast-specific genes during formation of mouse trophoblast giant cells in vitro. Mol Reprod Dev 34: 357-368.
- Cross JC, Nakano H, Natale DR, Simmons DG, Watson ED (2006) Branching morphogenesis during development of placental villi. Differentiation 74: 393-401.
- Soares MJ (2004) The prolactin and growth hormone families: pregnancy-specific hormones/cytokines at the maternal-fetal interface. Reprod Biol Endocrinol 2: 51.
- Adamson SL, Lu Y, Whiteley KJ, Holmyard D, Hemberger M, et al. (2002) Interactions between trophoblast cells and the maternal and fetal circulation in the mouse placenta. Dev Biol 250: 358-373.
- Coan PM, Conroy N, Burton GJ, Ferguson-Smith AC (2006) Origin and characteristics of glycogen cells in the developing murine placenta. Dev Dyn 235: 3280-3294.
- Hu D, Cross JC (2010) Development and function of trophoblast giant cells in the rodent placenta. Int J Dev Biol 54: 341-354.
- Caluwaerts S, Vercruysse L, Luyten C, Pijnenborg R (2005) Endovascular trophoblast invasion and associated structural changes in uterine spiral arteries of the pregnant rat. Placenta 26: 574-584.
- Ogony JW, Malahias E, Vadigepalli R, Anni H (2013) Ethanol Alters the Balance of Sox2, Oct4, and Nanog Expression in Distinct Subpopulations During Differentiation of Embryonic Stem Cells. Stem Cells Dev .
- Crews FT, Miller MW, Ma W, Nixon K, Zawada WM, et al. (2003) Neural stem cells and alcohol. Alcohol Clin Exp Res 27: 324-335.
- Veazey KJ, Carnahan MN, Muller D, Miranda RC, Golding MC (2013) Alcohol-Induced Epigenetic Alterations to Developmentally Crucial Genes Regulating Neural Stemness and Differentiation. Alcoholism, clinical and experimental research.
- Gong Z, Wezeman FH (2004) Inhibitory effect of alcohol on osteogenic differentiation in human bone marrow-derived mesenchymal stem cells. Alcohol Clin Exp Res 28: 468-479.
- Gilligan J, Tong M, Longato L, de la Monte SM, Gundogan F (2012) Precision-cut slice culture method for rat placenta. Placenta 33: 67-72.
- Soscia SJ, Tong M, Xu XJ, Cohen AC, Chu J, et al. (2006) Chronic gestational exposure to ethanol causes insulin and IGF resistance and impairs acetylcholine homeostasis in the brain. Cell Mol Life Sci 63: 2039-2056.
- Vercruysse L, Caluwaerts S, Luyten C, Pijnenborg R (2006) Interstitial trophoblast invasion in the decidua and mesometrial triangle during the last third of pregnancy in the rat. Placenta 27: 22-33.
- Altman PL, Dittmer DS (1964) BIOLOGY DATA BOOK. AMRL-TR-64-100. AMRL TR .
- de la Monte SM, Tong M, Bowling N, Moskal P (2011) si-RNA inhibition of brain insulin or insulin-like growth factor receptors causes developmental cerebellar abnormalities: relevance to fetal alcohol spectrum disorder. Mol Brain 4: 13.
- May PA, Gossage JP (2011) Maternal risk factors for fetal alcohol spectrum disorders: not as simple as it might seem. Alcohol Res Health 34: 15-26.
- Ain R, Canham LN, Soares MJ (2003) Gestation stage-dependent intrauterine trophoblast cell invasion in the rat and mouse: novel endocrine phenotype and regulation. Dev Biol 260: 176-190.
- Redline RW, Chernicky CL, Tan HQ, Ilan J, Ilan J (1993) Differential expression of insulin-like growth factor-II in specific regions of the late (post day 9.5) murine placenta. Mol Reprod Dev 36: 121-129.
- Cross JC (2000) Genetic insights into trophoblast differentiation and placental morphogenesis. Semin Cell Dev Biol 11: 105-113.
- Simmons DG, Fortier AL, Cross JC (2007) Diverse subtypes and developmental origins of trophoblast giant cells in the mouse placenta. Dev Biol 304: 567-578.
- Faria TN, Deb S, Kwok SC, Talamantes F, Soares MJ (1990) Ontogeny of placental lactogen-I and placental lactogen-II expression in the developing rat placenta. Dev Biol 141: 279-291.
Citation: Gundogan F, Gilligan J, Ooi JH, Sung J, Qi W, et al. (2013) Dual Mechanisms of Ethanol-Impaired Placentation: Experimental Model. J Clin Exp Pathol 3:142. DOI: 10.4172/2161-0681.1000142
Copyright: © 2013 Gundogan F, et al. This is an open-access article distributed under the terms of the Creative Commons Attribution License, which permits unrestricted use, distribution, and reproduction in any medium, provided the original author and source are credited.
Share This Article
Recommended Journals
Open Access Journals
Article Tools
Article Usage
- Total views: 16819
- [From(publication date): 6-2013 - Apr 04, 2025]
- Breakdown by view type
- HTML page views: 12120
- PDF downloads: 4699
