Research Article Open Access
Diversity of Phytoplankton in Different Stations from Muthupettai, South East Coast of India
Babu A*, Varadharajan D, Vengadesh Perumal N, Thilagavathi B, Manikandarajan T, Sampathkumar P and Balasubramanian TFaculty of Marine Sciences, Annamalai University, Parangipettai -608 502, Tamil Nadu, India
- Corresponding Author:
- Babu A
Faculty of Marine Sciences
Centre of Advanced Study in Marine Biology
Annamalai University, Parangipettai-608 502
Tamil Nadu, India
Tel: 04144-243223
Fax: 04144-243553
E-mail: babumarine@gmail.com
Received Date: July 25, 2013; Accepted Date: August 03, 2013; Published Date: August 08, 2013
Citation: Babu A, Varadharajan D, Vengadesh Perumal N, Thilagavathi B, Manikandarajan T, et al. (2013) Diversity of Phytoplankton in Different Stations from Muthupettai, South East Coast of India. J Marine Sci Res Dev 3:128. doi:10.4172/2155-9910.1000128
Copyright: © 2013 Babu A, et al. This is an open-access article distributed under the terms of the Creative Commons Attribution License, which permits unrestricted use, distribution, and reproduction in any medium, provided the original author and source are credited.
Visit for more related articles at Journal of Marine Science: Research & Development
Abstract
The distributions of phytoplankton and its community structure in relation to physico-chemical parameters in aquaculture discharge waters and adjacent waters of Muthupettai lagoon were studied. Physico-chemical parameters and nutrients concentration were fluctuated depends on the seasonal chances, whereas the total of 101 phytoplankton species were recorded, Among them, 76 species of diatoms (Bacillariophyceae), 17 species of dinoflagellates (Dinophyceae), 5 species of blue greens (Cyanophyceae), 2 species of green algae (Chlorophyceae) and 1 species of silicoflagellates (Chrysophyceae) were recorded, where, Nitzschia seriata, Coscinodiscus centralis, Thalassiothrix frauenfeldii, and Ceratium furca were the most abundant in phytoplankton community. The percentage composition were recorded as Diatom>Dinoflagellates>Blue greens>Greens>Silicoflagellate respectively. The study revealed that there are no effects due to the aquaculture discharge waters for the mangrove ecosystem. This study also revealed seasonal environmental variables and phytoplankton distributions in Muthupettai lagoon.
Keywords
Phytoplankton; Muthupettai; Lagoon; Nutrients; Aquaculture
Introduction
The global demand for seafood continues to rise despite most wild fisheries being at their maximum level of sustainable exploitation [1]. Predictions expected that by 2030, more than 50% of fisheries production will need to come from aquaculture due to human population growth, continuing demand for seafood and static or declining fish harvests [2]. In tropical and subtropical coastal areas worldwide, no economical activity has evolved as quickly as shrimp farming in the last 15 years. However, such an enormous development has been accompanied by strong controversies on the environmental, economic and social impacts of shrimp farming [3]. Phytoplankton can be use as good bio-indicator of water quality including pollution, since they reflect even the suitable changes taking place in their environment by changing their species composition, biomass, community structure and productivity. More over the abundance of phytoplankton can be taking as the best mean for quantitative assessment of potential fisheries of an area [4]. Thus, pond discharges are potential sources of pollution in receiving waters. There is a need for a more comprehensive approach to assessing the influence of shrimp farm discharge on the surrounding environment, with ability to predict changes in the environment following further changes in farm management practices. Therefore, in the present study has been undertaken to study the phytoplankton density and distribution in relation to physico-chemical parameters at Muthupettai, for a period of one year from April 2009-March 2010.
Materials and Methods
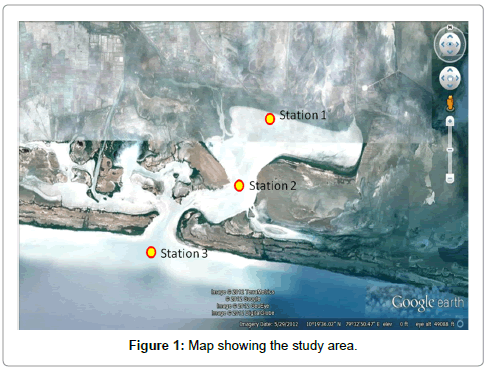
The present study was carried out the all the shrimp farm of Muthupettai, Station-1, situated in the outlet of the pond. Station- 2, situated in the farm discharges mixing in the back water area (junction of Kandakruchnar and Koraiar). Station- 3, situated in the mouth of the Muthupettai lagoon (Lat 10° 20’ 58N: Long 79° 32’ 07E), (Lat 10° 19’ 47N: Long 79° 33’ 07 E), (Lat 10° 18’ 44 N; Long 79° 31’ 32E) is bounded by a part of the Bay of Bengal and the northeast and Palk Strait on the Southwest and which embraces as vast swamp area (Figure 1). Three different points where selected at equidistance downstream from the farm, where the discharge water from a shrimp farm gradually mixes with the river water and flows into mouth of the Muthupettai lagoon. The shrimp farm was a pump fed type and stocked with the black tiger shrimp Penaeus monodon. All the shrimp farmers used CP dry pellets feed. A total of 75 shrimp farms, one side are surrounded by the mangrove fields and the other side had wasteland and cultivable lands with paddy fields. The farm has a total area of 150 acres with 18 excavated ponds including two reservoirs. The water spread area of the farm ranged from 0.7 to 0.9 ha. The depth of the pond water body was approximately 1.5m. The selected study areas are given bellow. Surface water samples were collected at monthly interval from the stations 1 and 2 for a period of one year from April, 2009 to March, 2010, for the estimation of various physico-chemical parameters. Rainfall data were obtained from the meteorological unit (Govt. of India.) located at Thiruvarur. Temperature was measured using a standard centigrade thermometer. Salinity was estimated with the help of a refractometer (ERMA, Hand Refractometer, and Japan) and pH was measured using an ELICO Grip pH meter. Dissolved oxygen was estimated by the modified Winkler’s method and is expressed as ml/l. For the analysis of nutrients, surface water samples were collected in clean polyethylene bottles, kept immediately in an icebox and transported to the laboratory [5]. The collected water samples were filtered by using a Millipore filtering system and analysed for dissolved inorganic nitrate, nitrite, phosphate and reactive silicate adopting the standard procedures described by Strickland and Parsons [5]. Phytoplankton samples were collected of monthly intervals from the surface water by towing a plankton net (mouth diameter 0.35 m) made up of bolting silk cloth (N.0.3 mess size- 48 μm) for half an hour. The collected samples were preserved in 5% neutralized formalin and used for qualitative analysis for the quantitative analysis of phytoplankton the settling method described by was adapted and the numerical plankton analysis was carried out using light microscope [6]. For the quantitative analysis of phytoplankton, 500 ml of water was filtered through a bagnet of same mesh size and the numerical plankton analysis was carried out using a binocular microscope. Phytoplanktons were identified by using the standard works done [7-12]. Biodiversity indices were calculated following the standard formulae: Biodiversity: H’=-S Pi log Pi; I=1; richness: D=1-C; C=SPi2; Pi=ni/N and evenness: J’=H’/log2S [13-15]. A calendar year was divided into four seasons viz., Monsoon (October to December), Postmonsoon (January to March), summer (April to June) and Premonsoon (July to September) based on the northeast monsoon which is prevalent in the study area. Correlation coefficients (r) were calculated for phytoplankton density and physico-chemical parameters and the Analysis of Variance (F) tests were made for hydrological parameters in relation to stations and seasons.
Results and Discussion
Total rainfall (mm)
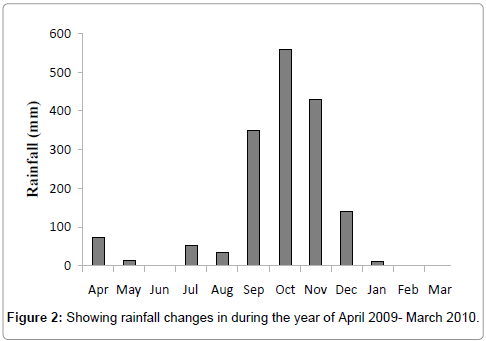
Total rainfall of 1672 mm was recorded from April 2009 to March 2010. It varied from 13 mm to 561 mm and rain did not occur in the months of June 2009, February and March 2010 (Figure 2). Rainfall is the most important cyclic phenomenon in tropical countries as it brings important changes in the hydrographical characteristics of the marine and estuarine environments. In the present study, the peak values of rainfall were recorded during the monsoon month of October 2009. The rainfall in India is largely influenced by two monsoons viz., southwest monsoon on the west coast, northern and northeastern India and by the northeast monsoon on the southeast coast [16]. On the other hand tidal rhythm, water current and evaporation in summer produced only little variation in those parameters or more or less stable in the absence of rainfall. Maruthanayagam C and Subramanian P have also reported the bulk of rainfall during northeast monsoon season along the southeast coast of India [17].
Water temperature (°C)
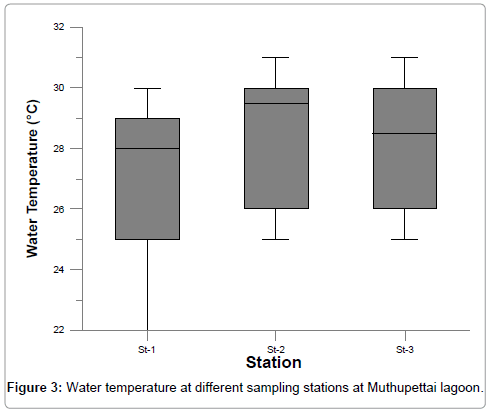
The surface water temperature fluctuated from 22 to 31. The maximum temperature was recorded during summer and minimum temperature during monsoon at all the stations (Figure 3) Generally, surface water temperature is influenced by the intensity of solar radiation, evaporation, freshwater influx and cooling and mix up with ebb and flow from adjoining neritic waters. The water temperature during October was low because of strong land sea breeze and precipitation and the recorded high value during summer could be attributed to high solar radiation [18,19]. The observed spatial variation in temperature could be due to the viable intensity of prevailing streams and the resulting mixing of water [20]. Statistically analysis showed a positive correlation (r=0.712 at station 1 and r=0.812 at station 2) between atmospheric and surface water temperature for both stations.
Salinity (psu)
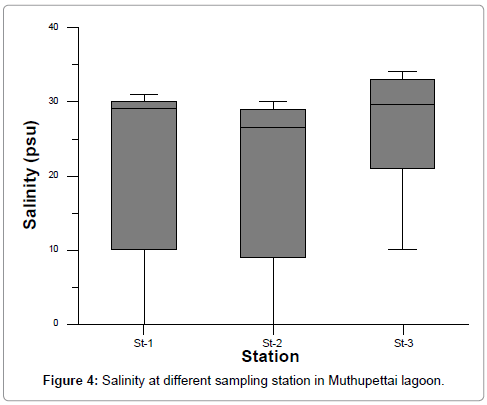
The salinity acts as a limiting factor in the distribution of living organisms, and its variation caused by dilution and evaporation is most likely to influence the fauna in the coastal ecosystem [21]. The salinity ranged from 1 to 34 psu. The highest salinity was recorded during summer season (April and May, 2009) and least salinity recorded during monsoon (October 2009) at all the stations (Figure 4 and Table 3). Generally, changes in the salinity in the brackish water habitats such as esturaies, backwaters and mangroves are due to the influx of freshwater from land run off, caused by monsoon or by tidal variations. This is presently evidenced by the negative correlation (r=- 0.696 at station 1 and r=-0.746 at station 2) obtained between salinity and rainfall. Further, salinity also influenced by the higher temperature as is evident from the obtained significant positive correlation with temperature. The salinity was found to be high during summer season and low during the monsoon season at all the stations. The recorded higher values (34.0%) could be attributed to the low amount of rainfall, higher rate of evaporation and also due to neritic water dominance, as reported by earlier workers in other areas [22-24]. During the monsoon season (4.0%), the rainfall and the freshwater inflow from the land in turn moderately reduced the salinity, as reported by Mitra et al. [25] in the Godavari estuary in the Bay of Bengal and coastal waters of Kalpakkam [25-27].
| Parameters | Station | April | May | June | July | Aug | Sept | Oct | Nov | Dec | Jan | Feb | Mar |
|---|---|---|---|---|---|---|---|---|---|---|---|---|---|
| Rainfall | 74.00 | 15.00 | 0.00 | 53.00 | 34.00 | 351.00 | 561.00 | 430.00 | 142.00 | 12.00 | 0.00 | 0.00 | |
| W.T (°C) | I | 28.00 | 29.00 | 29.00 | 30.00 | 28.00 | 25.00 | 22.00 | 24.00 | 27.00 | 28.00 | 28.00 | 29.00 |
| II | 29.00 | 30.00 | 30.00 | 31.00 | 30.00 | 26.00 | 25.00 | 25.00 | 28.00 | 29.00 | 30.00 | 30.00 | |
| III | 29.00 | 30.00 | 31.00 | 29.00 | 28.00 | 27.00 | 26.00 | 25.00 | 27.00 | 28.00 | 29.00 | 30.00 | |
| D.O. (ml/l) | I | 3.38 | 2.35 | 2.21 | 3.74 | 4.21 | 5.74 | 6.65 | 5.74 | 4.62 | 3.27 | 2.38 | 3.02 |
| II | 4.38 | 5.21 | 3.32 | 5.02 | 5.62 | 5.72 | 6.17 | 5.74 | 5.62 | 5.02 | 4.22 | 5.62 | |
| III | 5.21 | 5.62 | 4.34 | 5.71 | 5.62 | 6.17 | 6.33 | 6.21 | 5.62 | 5.21 | 4.62 | 5.21 | |
| Salinity (‰) | I | 29.00 | 30.00 | 30.00 | 31.00 | 28.00 | 10.00 | 0.00 | 5.00 | 23.00 | 29.00 | 30.00 | 31.00 |
| II | 27.00 | 28.00 | 29.00 | 30.00 | 26.00 | 9.00 | 0.00 | 4.00 | 21.00 | 26.00 | 29.00 | 29.00 | |
| III | 34.00 | 34.00 | 33.00 | 30.00 | 28.00 | 21.00 | 10.00 | 20.00 | 24.00 | 29.00 | 32.00 | 33.00 | |
| pH | I | 8.20 | 8.20 | 8.10 | 8.00 | 7.90 | 7.90 | 7.80 | 7.90 | 7.80 | 7.90 | 8.00 | 8.20 |
| II | 8.00 | 8.00 | 8.10 | 8.00 | 8.10 | 8.00 | 7.90 | 7.80 | 7.90 | 8.00 | 8.00 | 8.10 | |
| III | 8.20 | 8.20 | 8.20 | 8.00 | 8.00 | 8.00 | 8.00 | 7.90 | 7.90 | 8.10 | 8.00 | 8.20 | |
| NO2 (µM) | I | 1.43 | 2.03 | 2.14 | 2.21 | 1.41 | 0.53 | 0.45 | 0.39 | 2.74 | 2.43 | 3.33 | 2.39 |
| II | 1.12 | 1.82 | 2.02 | 2.01 | 1.02 | 0.24 | 0.16 | 0.29 | 1.80 | 2.02 | 2.33 | 2.45 | |
| III | 0.57 | 0.51 | 0.30 | 0.44 | 0.51 | 0.86 | 0.70 | 0.65 | 0.40 | 0.69 | 0.61 | 0.68 | |
| NO3 (µM) | I | 5.23 | 4.66 | 4.94 | 3.72 | 2.17 | 2.15 | 2.72 | 1.29 | 4.11 | 5.34 | 6.15 | 5.09 |
| II | 3.21 | 2.18 | 3.51 | 3.85 | 2.74 | 1.82 | 1.56 | 1.76 | 2.06 | 3.95 | 4.05 | 4.24 | |
| III | 3.30 | 2.58 | 2.88 | 3.51 | 3.25 | 4.80 | 5.23 | 4.47 | 3.33 | 3.40 | 3.64 | 2.57 | |
| NH3 (µM) | I | 6.06 | 7.72 | 8.10 | 6.09 | 3.07 | 1.07 | 0.96 | 1.87 | 6.10 | 7.03 | 8.04 | 7.05 |
| II | 1.13 | 2.12 | 1.24 | 3.17 | 1.12 | 0.17 | 0.16 | 0.18 | 1.05 | 2.14 | 2.11 | 2.85 | |
| III | 0.05 | 0.07 | 0.10 | 0.09 | 0.07 | 0.13 | 0.19 | 0.10 | 0.10 | 0.07 | 0.09 | 0.10 | |
| IP (µM) | I | 1.40 | 1.36 | 1.16 | 1.25 | 1.30 | 1.18 | 1.16 | 1.26 | 1.34 | 1.43 | 1.68 | 1.58 |
| II | 0.74 | 0.56 | 0.25 | 0.22 | 0.35 | 0.16 | 0.18 | 0.26 | 0.35 | 0.41 | 0.70 | 0.90 | |
| III | 0.41 | 0.30 | 0.25 | 0.20 | 0.28 | 0.16 | 0.45 | 0.69 | 0.40 | 0.35 | 0.30 | 0.32 | |
| SiO3 (µM) | I | 32.93 | 33.16 | 29.90 | 25.91 | 26.81 | 33.99 | 54.66 | 35.82 | 28.63 | 29.01 | 30.97 | 32.93 |
| II | 30.11 | 30.25 | 27.15 | 25.38 | 24.15 | 36.84 | 50.86 | 31.78 | 24.67 | 28.15 | 26.87 | 29.95 | |
| III | 32.54 | 31.30 | 28.68 | 25.52 | 35.58 | 48.73 | 65.71 | 58.67 | 36.63 | 29.01 | 28.54 | 29.15 | |
| Density (Cells/l) | I | 26354 | 38612 | 763284 | 165957 | 19163 | 8319 | 5906 | 11372 | 14052 | 307817 | 430552 | 268144 |
| II | 24841 | 185070 | 133232 | 189074 | 23125 | 20412 | 9064 | 14277 | 36298 | 51639 | 34502 | 34796 | |
| III | 83578 | 104072 | 89458 | 103576 | 72884 | 60480 | 20949 | 25531 | 56794 | 61348 | 67214 | 79284 | |
| Diversity | I | 3.09 | 3.05 | 0.95 | 2.04 | 3.09 | 2.25 | 2.06 | 2.52 | 2.61 | 0.49 | 1.10 | 1.26 |
| II | 3.33 | 1.35 | 1.76 | 1.29 | 3.11 | 3.46 | 2.78 | 3.22 | 3.12 | 3.25 | 3.27 | 3.21 | |
| III | 3.44 | 3.51 | 3.36 | 3.60 | 3.82 | 3.76 | 3.30 | 3.63 | 3.72 | 3.82 | 3.67 | 3.53 | |
| Richness | I | 0.94 | 0.94 | 0.41 | 0.79 | 0.94 | 0.86 | 0.86 | 0.90 | 0.91 | 0.15 | 0.56 | 0.57 |
| II | 0.95 | 0.41 | 0.56 | 0.41 | 0.93 | 0.96 | 0.93 | 0.95 | 0.94 | 0.95 | 0.95 | 0.95 | |
| III | 0.95 | 0.95 | 0.93 | 0.96 | 0.97 | 0.97 | 0.94 | 0.97 | 0.97 | 0.97 | 0.96 | 0.96 | |
| Evenness | I | 0.90 | 0.91 | 0.29 | 0.61 | 0.93 | 0.85 | 0.89 | 0.89 | 0.90 | 0.16 | 0.36 | 0.41 |
| II | 0.90 | 0.36 | 0.48 | 0.36 | 0.87 | 0.93 | 0.93 | 0.91 | 0.89 | 0.91 | 0.93 | 0.93 | |
| III | 0.86 | 0.85 | 0.83 | 0.87 | 0.92 | 0.92 | 0.90 | 0.93 | 0.92 | 0.92 | 0.90 | 0.89 |
Table 3: Physico-chemical parameters and density, diversity, richness and evenness of phytoplankton species in different stations during April 2009–March 2010.
Hydrogen ion concentration (pH)
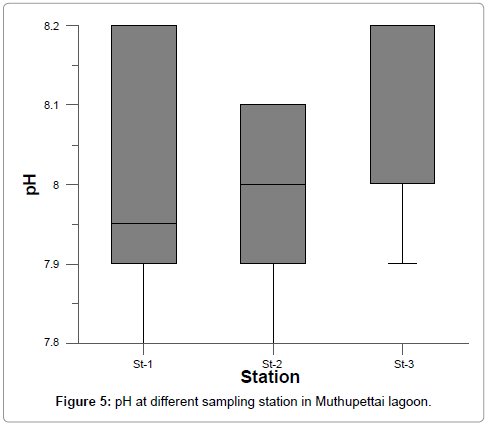
Hydrogen ion concentration (pH) Hydrogen ion concentration (pH) in surface waters varied from 7.6 to 8.2. The maximum pH was recorded during summer and post monsoon and minimum pH during monsoon season at all stations (Figure 5 and Table 3). Generally, fluctuations in pH values during different seasons of the year is attributed to factors like removal of CO2 by photosynthesis through bicarbonate degradation, dilution of seawater by freshwater influx, low primary productivity, reduction of salinity and temperature and decomposition of organic materials as stated by Subramanian and Mahadevan and Vijayakumar et al. [28,29]. The recorded high summer pH might be due to the influence of seawater penetration and high biological activity and due to the occurrence of high photosynthetic activity [30,31]. The statistical analysis also revealed that salinity show highly significant negative correlation with rainfall.
Dissolved Oxygen
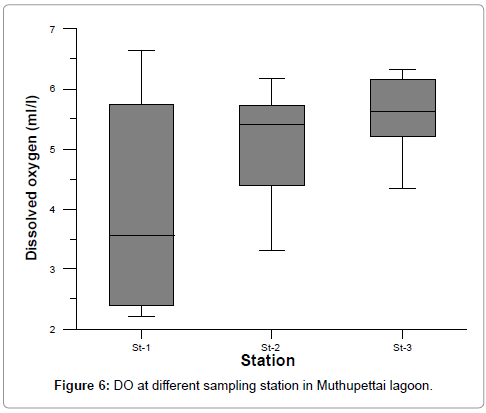
The variation in dissolved oxygen concentration varied from 2.21 to 6.65. The maximum values were recorded during monsoon season and minimum values were recorded during summer season at station 1 (Figure 6 and Table 3). It is well known that the temperature and salinity affect the dissolution of oxygen [32]. In the present investigation, higher values of dissolved oxygen were recorded during monsoon months at all the stations. Season-wise observation of dissolved oxygen showed an inverse trend against temperature and salinity. The observed high monsoonal values might be due to the cumulative effect of higher wind velocity coupled with heavy rainfall and the resultant freshwater mixing [33]. Segar and Hariharan [34] have mainly attributed seasonal variation of dissolved oxygen to freshwater flow and terrigenous impact of sediments. Further, significant inverse relationship between rainfall and nutrients indicated that freshwater flow constituted the main source of the nutrients in the estuaries and lagoons.
Micronutrients
Nutrients are considered as one of the most important parameters in the estuarine and lagoon environment influencing growth, reproduction and metabolic activities of living being. Distribution of nutrients is mainly based on the season, tidal conditions and freshwater flow from land source.
Ammonia
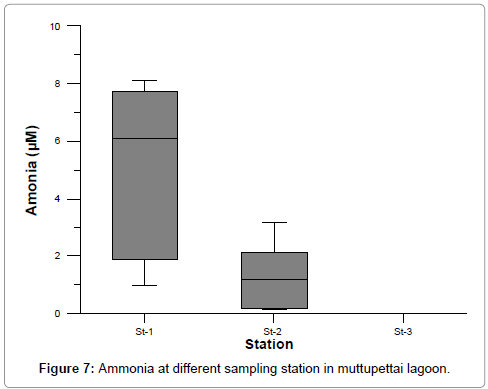
The ammonia concentration fluctuated from 0.962 to 8.098, 0.162 to 3.174, and 0.051 to 0.187 at stations 1, 2 and 3 respectively. The maximum values were recorded during summer (stations 1) and minimum values during post monsoon season (station 3). Higher concentration of ammonia (8.098 μM) was observed during the summer season in station 1 due to aquaculture pond discharge water mix the station. Lower concentration of ammonia (0.051 μM) was observed during the post monsoon season in station 3 (Figure 7). In station 2 and 3 higher concentration could be partially due to the death and subsequent decomposition of phytoplankton and also due to the excretion of ammonia by planktonic organisms [34].
Dissolved inorganic nitrate
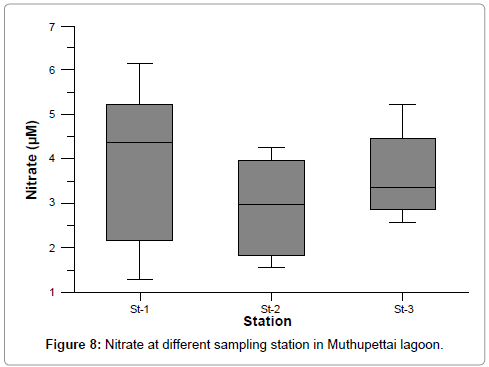
The dissolved inorganic nitrate concentration ranges from 1.42 to 6.151, 1.557 to 4.243, and 2.571 to 5.231 at stations 1, 2 and 3 respectively. The maximum values were recorded at stations 1 during post monsoon and minimum values were recorded at station 1 during monsoon season. It could be mainly due to the organic materials received from the pond discharge (Figure 8). In station 3 the maximum nitrates values recorded at monsoon season the increased nitrates level was due to fresh water inflow, mangrove leaves (litter fall) decomposition and terrestrial run-off during the monsoon season [28]. Another possible way of nitrates entry is through oxidation of ammonia form of nitrogen to nitrite formation [25]. The recorded low values (1.292 μM) during non-monsoon period may be due to its utilization by phytoplankton as evidenced by high photosynthetic activity and also due to the neritic water dominance, which contained only negligible amount of nitrate [19,28].
Dissolved inorganic nitrite
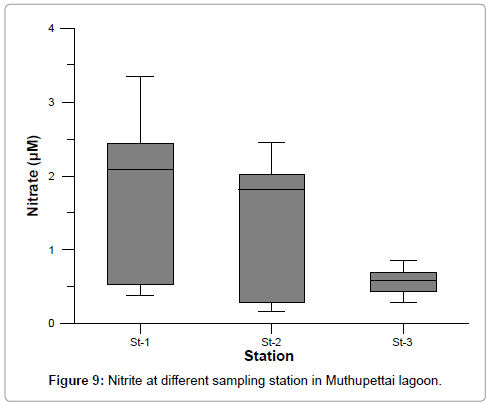
The dissolved inorganic nitrite concentration values ranged from 0.389 to 3.331 at station 1, 0.162 to 2.574 at station 2, and 0.301 to 0.861 at station 3. The maximum value was recorded at station 1 during post monsoon and minimum value at station 2 during monsoon. The recorded higher nitrite values during post monsoon season (3.331 μM) could be due to the increased pond discharge, oxidation of ammonia and reduction of nitrate and by recycling of nitrogen and also due to bacterial decomposition of planktonic detritus present in the environment [17]. Further, the denitrification and air-sea interaction exchange of chemicals are also responsible for this increased value (Figure 9 and Table 3) [30]. The recorded low nitrite value (0.162 μM) during summer and monsoon seasons may be due to high freshwater inflow and low salinity [31,32].
Dissolved inorganic phosphate
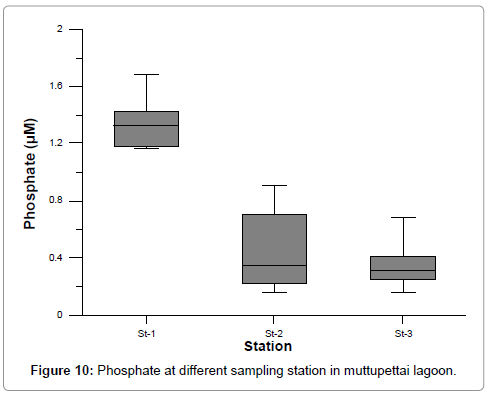
The dissolved Inorganic phosphate concentration ranges varied from 1.161 to 1.684, 0.159 to 0.921, and 0.157 to 0.687 at stations 1, 2, and 3 respectively. The maximum values were recorded during post monsoon at station 1 and minimum values at station 3 during summer season. The recorded high concentration of inorganic phosphates (1.684 μM) during post monsoon season might possibly be due to pond discharge, in station 2 and 3 the high values recorded at monsoon season due to monsoonal fluctuation, which in turn increased the level of phosphate (Figure 10) [35]. Further, regeneration and release of total phosphorus from bottom mud into the water column by turbulence and mixing also attributed to the higher monsoonal values [36]. The recorded low phosphates value (0.157 μM) during summer could be attributed to the limited flow of freshwater, high salinity and utilization of phosphate by phytoplankton [37]. The variation may also be due to the processes like adsorption and desorption of phosphates and buffering action of sediment under varying environmental conditions [23]. Moreover, the weatherings of rocks soluble alkali metal phosphates, the bulk of which are carried into the estuaries are also responsible for the recorded higher values [22]. The addition of super phosphates applied in the agricultural fields as fertilizers and alkyl phosphates used in households as detergents can be other sources of inorganic phosphates during the season [18].
Dissolved silicate
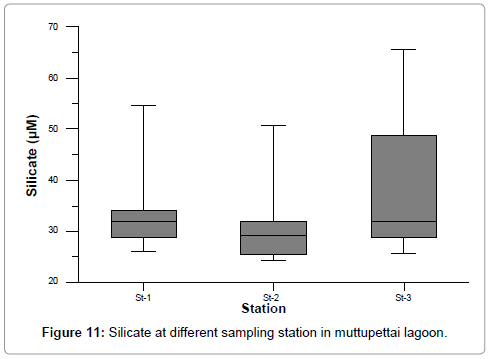
The dissolved silicate concentration ranged from 25.914 to 54.662, 24.147 to 50.857 and 25.515 to 65.705 at stations 1, 2, 3 respectively. The maximum values were recorded during monsoon season at station 3, and minimum values were recorded during summer at station 2. The silicate content was higher than that of the other nutrients (NO3, NO2 and PO4) and the recorded high monsoon values (65.705 μM) may be due to heavy inflow of monsoonal freshwater derived from land drainage carrying silicate leached out from rocks. Further, due to the turbulent nature of water, the silicate from the bottom sediment might have been exchanged with overlying water in this estuarine and lagoon environment (Figure 11) [18]. Besides this, the dissolution of particulate silicon carried by the river, the removal of silicates by adsorption and co-precipitation of soluble silicate silicon with humic compounds and iron [21]. The observed low summer values (24.147 μM) could be attributed to uptake of silicates by phytoplankton for their biological activity [35,36].
In the present study a totally 101 species of phytoplankton were recorded during the study period. Among them, 76 species of diatoms (Bacillariophyceae), 17 species of dinoflagellates (Dinophyceae), 5 species of blue greens (Cyanophyceae), 2 species of green algae (Chlorophyceae) and 1 species of silicoflagellates (Chrysophyceae) were found. The maximum phytoplankton species was recorded in station III and minimum species was recorded in station I than there other station. Among the station I were recorded phytoplankton maximum contribution of Bacillariophyceae (44) followed by Dinophyceae (9), Cyanophyceae (2) and Chlorophyceae (1), as well as station II phytoplankton species was recorded maximum in Bacillariophyceae (61) followed by Dinophyceae (11), Cyanophyceae (3), Chlorophyceae (1) and Chrysophyceae (1) and the station III maximum species was recorded in Bacillariophyceae (70) following them Dinophyceae (15), Cyanophyceae (4), Chlorophyceae (2) and Chrysophyceae (1) (Table 1). Among various species, Nitzschia seriata, Coscinodiscus centralis, Thalassiothrix frauenfeldii, and Ceratium furca were the most abundant forms. In general, the distribution and abundance of phytoplankton in tropical waters, varied remarkably due to the seasonal environmental fluctuations, and these variations are well pronounced in the sheltered system of estuarine waters. The percentage contribution of each group of phytoplankton was in the following order: Diatom>Dinoflagellates>Blue greens>Greens>Silicoflagellate.
| S.No | Bacillariophyceae (Diatoms) | St-1 | St-2 | St-3 |
|---|---|---|---|---|
| 1 | Asterionella glacialis | * | * | + |
| 2 | Bacillaria paradox | * | + | + |
| 3 | Bacteriastrum comosum | * | + | + |
| 4 | Bacteriastrum delicatilum | + | + | + |
| 5 | Bacteriastrum hylinium | + | + | + |
| 6 | Bellerochea malleus | * | + | + |
| 7 | Biddulphia biddulpia | + | * | + |
| 8 | Biddulphia heteroceros | + | + | * |
| 9 | Biddulphia obtuse | * | * | + |
| 10 | Biddulphia pulchella | + | + | + |
| 11 | Biddulphia reticulata | * | + | + |
| 12 | Biddulphia sp. | + | + | + |
| 13 | Chaetoceros affinis | + | + | + |
| 14 | Chaetoceros brevis | + | + | + |
| 15 | Chaetoceros coarctatus | * | + | + |
| 16 | Chaetoceros currivisetes | + | * | + |
| 17 | Chaetoceros danicus | * | + | + |
| 18 | Chaetoceros deblis | + | * | * |
| 19 | Chaetoceros decipiens | * | + | + |
| 20 | Chaetoceros diversus | + | * | + |
| 21 | Chaetoceros indicus | * | + | + |
| 22 | Chaetoceros messanensis | + | * | + |
| 23 | Chaetoceros peruvian | + | * | + |
| 24 | Climocodium fraunfeldium | * | * | + |
| 25 | Coscinodiscus centralis | + | + | + |
| 26 | Coscinodiscus concinnus | * | + | + |
| 27 | Coscinodiscus ecentricus | * | + | + |
| 28 | Coscinodiscus gigas | + | + | + |
| 29 | Coscinodiscus granii | * | + | + |
| 30 | Coscinodiscus radiatus | + | * | + |
| 31 | Coscinodiscus thori | + | + | + |
| 32 | Cyclotella sp. | + | + | + |
| 33 | Cyclotella striata | * | + | + |
| 34 | Diatoma anceps | + | + | + |
| 35 | Ditylum brightwelli | * | + | + |
| 36 | Eucambia groenlandica | * | + | + |
| 37 | Eucambia zoodiocus | + | + | + |
| 38 | Fragillaria sp. | + | + | + |
| 39 | Guinordia sp. | + | + | + |
| 40 | Gyrosigma sp. | + | + | + |
| 41 | Hemiaulus sinensis | * | + | + |
| 42 | Hemidiscus hardmanianus | * | * | + |
| 43 | Lauderia sp. | + | + | + |
| 44 | Leptocylindrus danicus | + | + | + |
| 45 | Lithodesmium undulatum | * | + | + |
| 46 | Navicula henneydii | * | + | + |
| 47 | Navicula sp. | + | + | + |
| 48 | Navicula venhoffeni | * | + | + |
| 49 | Nitzschia closterium | + | + | + |
| 50 | Nitzschia longissima | * | + | + |
| 51 | Nitzschia pungens | + | + | + |
| 52 | Nitzschia seriata | + | + | + |
| 53 | Nitzschia sp. | + | + | + |
| 54 | Odentella mobiliensis | + | + | + |
| 55 | Odentella sinensis | * | + | + |
| 56 | Planktoniella sol | + | + | + |
| 57 | Pleurosigma angulatum | + | + | + |
| 58 | Pleurosigma depressum | + | + | + |
| 59 | Pleurosigma directum | * | * | + |
| 60 | Pleurosigma elongatum | + | + | + |
| 61 | Pleurosigma normanii | * | * | + |
| 62 | Rhizosolenia alata | + | * | * |
| 63 | Rhizosolenia cylindrus | + | + | + |
| 64 | Rhizosolenia imbricata | * | + | + |
| 65 | Rhizosolenia robusta | + | + | + |
| 66 | Rhizosolenia setigera | * | + | + |
| 67 | Rhizosolenia styliformis | + | + | + |
| 68 | Skeletonema costatum | + | + | + |
| 69 | Stephanophysis palmariana | * | + | * |
| 70 | Streptothaeca indicus | * | + | * |
| 71 | Thalassionema nitzschioides | + | + | + |
| 72 | Thalassiosira sp. | + | + | + |
| 73 | Thalassiothrix fraunfeldii | * | * | + |
| 74 | Triceratium favus | * | + | + |
| 75 | Triceratium reticulatum | + | + | + |
| 76 | Triceratium robertsianum | + | + | * |
| Dinophyceae | ||||
| 1 | Ceratium extensum | + | + | + |
| 2 | Ceratium furca | + | + | + |
| 3 | Ceratium fusus | * | * | + |
| 4 | Ceratium inflatum | + | + | + |
| 5 | Ceratium lineatum | * | + | + |
| 6 | Ceratium macroceros | * | + | + |
| 7 | Ceratium trichoceros | * | + | + |
| 8 | Ceratium tripos | * | * | + |
| 9 | Ceratocorys horrida | + | * | * |
| 10 | Dinophysis caudata | * | + | + |
| 11 | Noctiluca sp | + | + | + |
| 12 | Ornithocercus steinii | + | * | * |
| 13 | Prorocentrum micans | * | * | + |
| 14 | Protoperidinium depressum | + | + | + |
| 15 | Protoperidinium oceanicum | + | + | + |
| 16 | Protoperidinium sp. | + | + | + |
| 17 | Pyrophacus stenii | * | + | + |
| Cyanophyceae (Blue-greens) | ||||
| 1 | Anabena sp | + | + | + |
| 2 | Trichodesmium erythraea | * | + | + |
| 3 | Spirulina major | * | * | + |
| 4 | Lyngbya sp. | + | + | * |
| 5 | Oscillatoria limosa | * | * | + |
| Chlorophyceae (Greens) | ||||
| 1 | Volvox sp. | + | + | + |
| 2 | Pediastrum simplex | * | * | + |
| Chrysophyceae (Silicoflagellate) | ||||
| 1 | Dichtyocha fibula | * | + | + |
| Total | 56 | 76 | 91 |
Table 1: Study period recorded phytoplankton species from Muthupettai region.
The phytoplankton species composition was comparatively more in station 3 than in stations 1 and 2. Generally, diatoms were found to be dominant in Lagoon mouth waters, which could well thrive in widely changing hydrographical conditions [22,37-40]. Depending on several factors in coastal lagoons, there are dominant groups: diatoms, dinoflagellates, cyanobacteria, chlorophytes, phytoflagellates, silicoflagellates and euglenophytes. Among the most important variables for the dominance of a given group, there are sources of water supply (a river or the sea), salinity and dynamic aspects of a lagoonal system. Among chlorophytes, several genuses have been registered during the winter, when fresh water supply occurs.
Presently observed high population density and species diversity during summer and pre monsoon might be due to the predominance of diatoms viz: Nitzschia seriata, Thalassiothrix frauenfeldii, Odontella sinensis, Bacteriastrum comosum, Chaetoceros affinis, and Coscinodiscus centralis. The phytoplankton abundance during summer season could be attributed to the increased salinity, pH, high temperature and high intensity of light penetration during the season [31].
The abundance of phytoplankton was lowest during monsoon months, when the water column was remarkably stratified to a large extent because of heavy rainfall, high turbidity caused by run-off, reduced salinity, decreased temperature and pH, overcast sky and cool conditions. However, during this season, freshwater algal forms like Anabaena sp., Oscillatoria sp., Chlorella sp., Nostoc sp., Lynbya sp., Spirogyra sp. Volvox sp. and Spirulina sp. were noticed. The phytoplankton counts were high during southwest monsoon season as reported in some of the studies in Bay of Bengal [38]. Similar observations were made earlier [41-43]. This is being supported by who stated that phytoplankton and their growth depend on several environmental factors, which are variable in different seasons and regions [44]. This kind of cyclic change in the species composition of phytoplankton was a characteristic feature of the Pichavaram coastal mangroves [45].
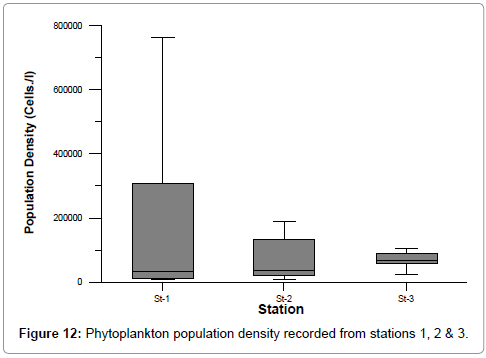
The ranges of phytoplankton population density (cells/l) were: 5906-763284 (st-1), 9064-185070 (st-2) and 20949-104072 (st-3) (Figure 12). The maximum density was recorded during summer and minimum during monsoon. The observed high density during the summer could be attributed to more stable hydrographical conditions prevailed during that period. Station 1 showed comparatively high population density due to high nutrient concentrations due to aquaculture pond discharge and optimal salinity [46]. The salinity showed positive correlation with zooplankton density (r=0.801 st. 1, r=0.649 st. 2 and r= 0.802 st. 3) [42-48]. Phytoplankton composition and abundance in supply water is modified in shrimp ponds. In some culturing systems, where salinity decreases because of the mixing with fresh water from rivers, there are ponds where diatoms, cyanobacteria, chlorophytes and dinoflagellates dominate, depending on several environmental factors (e.g. light, salinity, and temperature and nutrient levels). The occurrence of some species can be temporal or can last longer. Sometimes there are blooms of short periods, but a very high abundance of one or a few species that can alter shrimp growth due to oxygen depletion at nights [47].
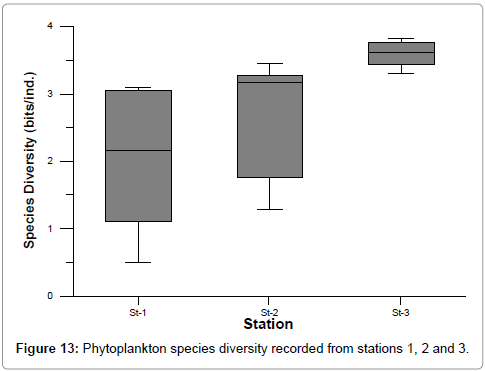
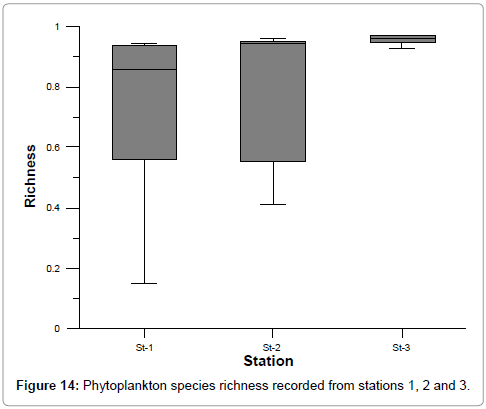
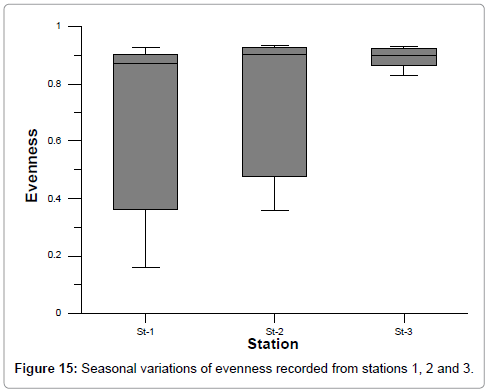
The ranges of species diversity, richness and evenness at stations 1, 2 and 3 were: 0.49-3.82, 0.15-0.97 and 0.16-93 respectively (Figures 13-15). The least values of biodiversity indices were recorded during summer and post monsoon season, but were higher during premonsoon season at all the stations could be correlated with the recorded lower and higher salinity values, as reported by Ramakrishnan et al. [39]. This is further evidenced by the positive correlation obtained between salinity and species diversity, richness and evenness [42,45,48].
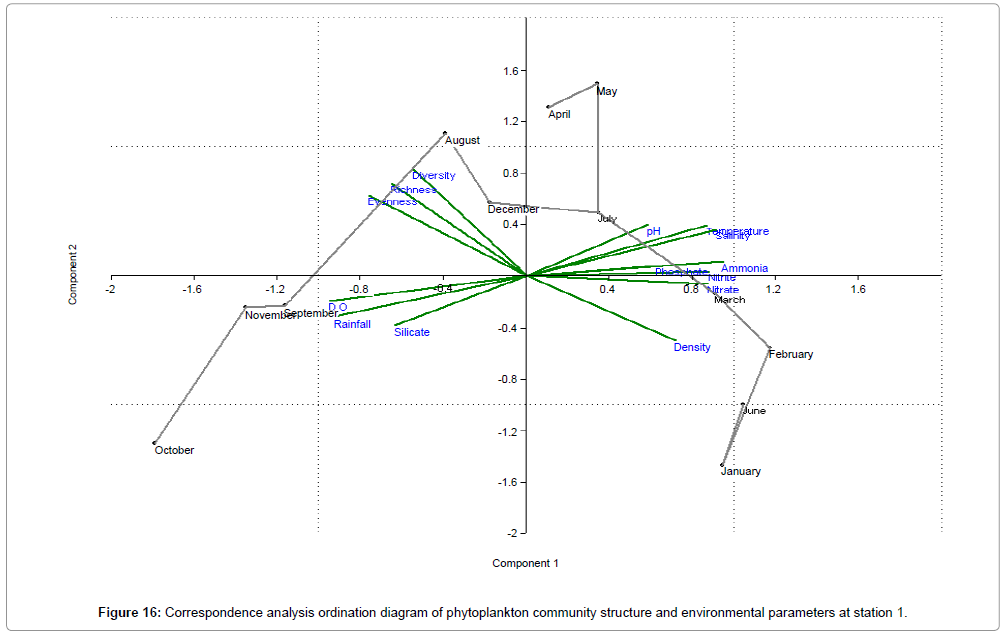
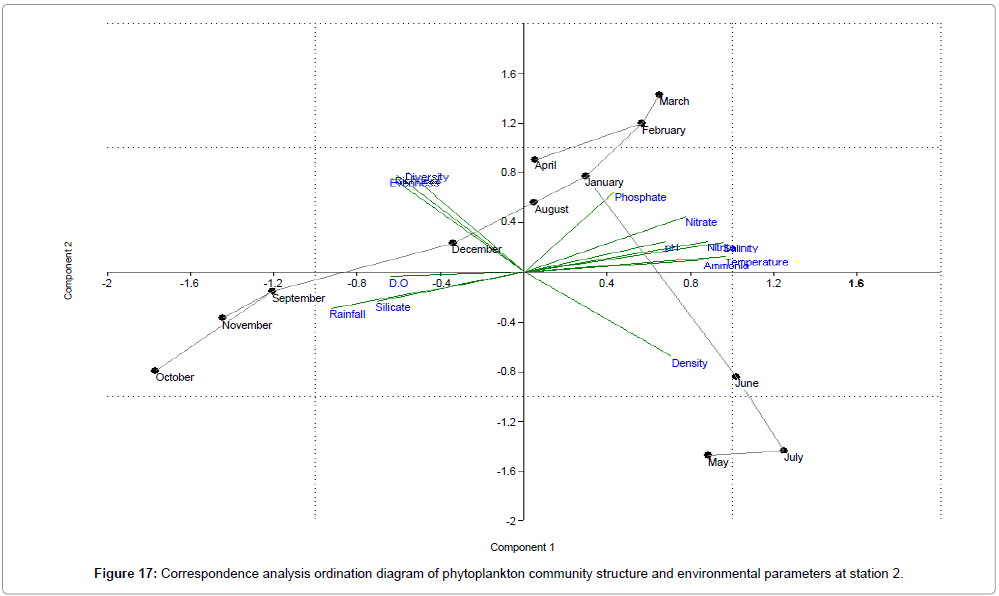
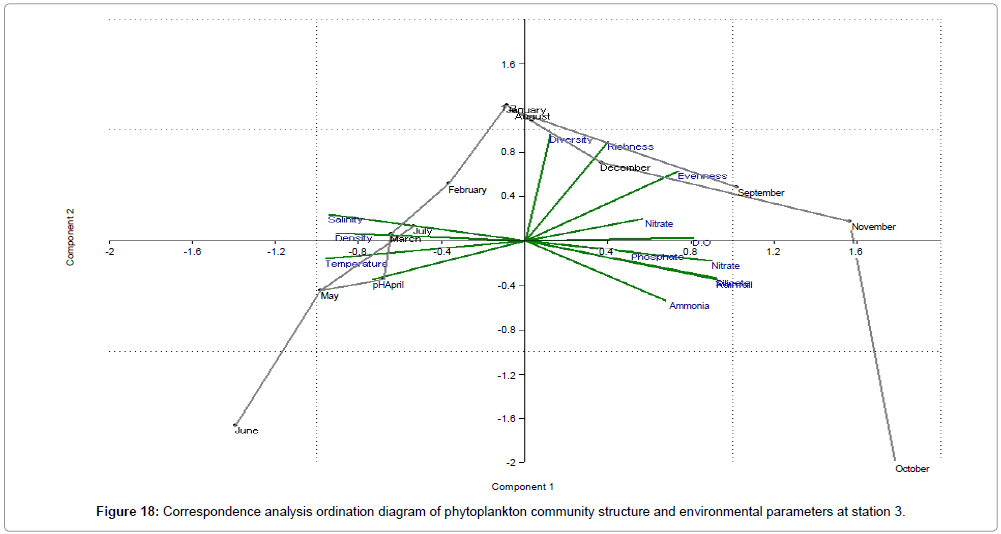
CCA biplot of phytoplankton community structure and environmental variables scored for March 2009 to April 2010 (Figures 16-18). Active variables selected by the analysis (P<0.01) are underlined. A positive correlation is expressed by relative long vectors pointing approximately in the same direction, and a negative correlation is indicated by arrows pointing in opposite directions. The higher the correlation is the longer the arrow in the diagram. The variables year is also represented (Table 2).
| Month | Engine value | % of Variance | ||||
|---|---|---|---|---|---|---|
| Station 1 | Station 2 | Station 3 | Station 1 | Station 2 | Station 3 | |
| April | 9.36415 | 8.95609 | 9.04365 | 62.428 | 59.707 | 60.291 |
| May | 2.80704 | 3.29397 | 2.94883 | 18.714 | 21.96 | 19.659 |
| June | 1.04594 | 0.838987 | 1.15584 | 6.9729 | 5.5932 | 7.7056 |
| July | 0.933509 | 0.671245 | 0.84853 | 6.2234 | 4.475 | 5.6569 |
| August | 0.383715 | 0.551213 | 0.564902 | 2.5581 | 3.6748 | 3.766 |
| September | 0.187896 | 0.440726 | 0.236751 | 1.2526 | 2.9382 | 1.5783 |
| October | 0.098986 | 0.145756 | 0.106567 | 0.65991 | 0.97171 | 0.71045 |
| November | 0.085436 | 0.048737 | 0.05505 | 0.56957 | 0.32491 | 0.367 |
| December | 0.058135 | 0.035112 | 0.023633 | 0.38757 | 0.23408 | 0.15755 |
| January | 0.024714 | 0.011814 | 0.013279 | 0.16476 | 0.078758 | 0.088523 |
| February | 0.01048 | 0.006352 | 0.002967 | 0.069868 | 0.042346 | 0.019783 |
| March | 1.94E-30 | 7.23E-31 | 2.68E-29 | 1.30E-29 | 4.82E-30 | 1.79E-28 |
Table 2: Analyses of correlation; r=correlation coefficient & % of Variance; p=significance level (alpha level).
In the present study, farm discharge mixing area had high polluted, also this area minimum density of phytoplankton was recorded (stations 1, 2 and 3), when compared with open sea. Probably, because high organic load at stations 1 and 2. A major problem experienced with shrimp farms is the discharge of pond waters. Approximately 80% of nitrogen added to ponds as shrimp feed is not retained as shrimp biomass [49,50]. Remaining nitrogen acts to fuel plankton and microbial production within ponds, often resulting in negative effects on pond water and sediment quality such as anoxia, nutrient toxicity, and blooms of undesirable algal species [1,51]. Pollution of the receiving water includes nutritional enrichment, organic matter and settling of solids [51,52].
The most microalgae are obligate photoautotrophs, and their growth is strictly dependent of photosynthetic activity; in the case of dinoflagellates, the nutritional strategies are diversed, and show varying degrees of mixotrophy and heterotrophy through a combination of phototrophy and phagotrophy in response to rapid changes in the environmental conditions such as light availability, inorganic and organic nutrient concentrations and food particle abundance. In most shrimp farms from the Gulf of California, coastal waters are used for supplying shrimp ponds; in some cases water is pumped directly from the coast and in other cases indirectly through coastal lagoons. In the Gulf of California, the most abundant and diverse groups of the phytoplankton are diatoms (415 species) and dinoflagellates (270 species). Based on this data, it would suggest that the influence of discharge is contained the phytoplankton density. Although, the coastal zone is also a dynamic area with many cyclic and random processes owing to a variety of resources and habitats. Studies of the abundance, distribution and composition of phytoplankton communities are, therefore, a fundamental contribution to our understanding of the structure and function of marine ecosystems.
References
- David JWM (1997) The role of microorganisms in aquaculture ponds. Aquacult 151: 333-349.
- Simon JFS, Matthew RPB (1998) Nutrient budgets in intensive shrimp ponds: implications for sustainability. Aquacult 164: 117-133.
- Federico Páez-Osuna (2001) The environmental impact of shrimp aquaculture: causes, effects, and mitigating alternatives. Environ Manag 28: 131-140.
- Gouda R, Panigrahy RC (1996) Ecology of phytoplankton in coastal waters off Gopalpur, east coast of India. Indian J Mar Sci 25: 81-84.
- Strickland JDH, Parsons TR (1972) A Practical Hand Book Of Seawater Analysis. (2nd Edn) Bull Krishivigan Res Board, Canada.
- Settling without the inverted microscope. Anonymous (1979): Settling without the inverted microscope.
- Subrahmanyan R (1946) A systematic account of the marine plankton diatoms of the Madras coast. Proceedings of the Indian Academy of Sciences - Section B 24: 85-197.
- Prescott GW (1978) How to know the freshwater algae. Brown company publishers Lowa 239.
- Steidenger KA, Williams J (1976) Dinoflagellates. Mem. Hourglass Cruises 2: 1-251.
- Taylor FJR (1976) Dinoflagellates from the International Indian Ocean Expedition : a report on material collected by the R.V. "Anton Bruun" 1963-1964. Bibil Botan 132: 1-226.
- Mackay MA, Norton RS, Borowitzka LJ (1986) Marine blue-green algae have a unique osmoregulatory system 73: 301-307.
- Santhanam R, Ramanathan N, Venkataramanujam K, Jegatheesan G (1987) Phytoplankton of the Indian seas. An aspects of Marine Botany. Daya Pub house, Delhi, India.
- Shannon CE (1948) A Mathematical Theory of Communication. The Bell System Technical Journal 27: 379-423.
- Gleason HA (1922) On the relation between species and area. Ecol3: 158-162.
- Pielou EC (1966) The measurement of diversity in different types of biological collections. J Theo Biol 13: 144.
- Perumal P (1993) The information of meterological phenomena on the ecosystem of a tropical region, southeast coast of India- A case study. Ciencias marinas 19: 343-351
- Maruthanayagam C, Subramanian P (2000) Hydrological and zooplankton biomass variation in Palk Bay and Gulf of Mannar along the east coasts of India. J Mar Biol Ass India 41: 7-18.
- Das J, Das SN, Sahoo RK (1997) Semidiurnal variation of some physico-chemical parameters in the Mahanadi estuary, east coast of India. Indian J Mar Sci 26: 323-326.
- Govindasamy C, Kannan L, Jayapaul A (2000) Seasonal variation in physico-chemical properties and primary production in the coastal water biotopes of Coromandel coast, India. J Environ Biol 21: 1-7.
- Reddi KR, Jayaraju N, Suriyakumar I, Sreenivas K (1993) Tidal fluctuation in relation to certain physio-chemical parameters in swarnamukhi river estuary, east coast of India. Indian J Mar Sci 22: 232-234.
- Mohan PC, Sreenivas N (1998) Diel variations in zooplankton populations in mangrove ecosystem at Gaderu canal, southeast coast of India. Indian J Mar Sci 27: 486-488.
- Gowda G, Gupta TRC, Rajesh KM, Gowda H, Lingadhal C, et al. (2001) Seasonal distribution of phytoplankton in Nethravathi estuary, Mangalore. J Mar Biol Ass India 43: 31-40.
- Rajasegar M (2003) Physico-chemical characteristics of the Vellar estuary in relation to shrimp farming. J Environ Biol 24: 95-101.
- Sai Sastry AG, Chandramohan R (1990) Physicochemical characteristics of Vasishta Godavari estuary, east coast of India: pre pollution status. Indian J Mar Sci 19: 42-46.
- Mitra A, Patra KC, Panigrahy RC (1990) Seasonal variations of some hydrographical parameters in a tidal creek opening in to the Bay of Bengal. Mahasagar 23: 55-62.
- Satpathy KK (1996) Seasonal distribution of nutrients in the coastal waters of Kalpakkam, east coast of India, Indian J Mar Sci 25: 221-224.
- Karuppasamy PK, Perumal P (2000) Biodiversity of zooplankton at Pichavaram mangroves, South India. Advan Biosci 19: 23-32.
- Subramanian B, Mahadevan A (1999) Seasonal and diurnal variations of hydro biological characters of coastal waters of chennai (Madras) Bay of Bengal. Indian J Mar Sci 28: 429-433.
- Vijayakumar S, Rajan K, Mridula Mendon M, Hariharan R (2000) Seasonal distribution and behavior of nutrients with reference to tidal rhythm in the Mulki estuary, Southwest coast of India. J Mar Boil Ass India 42: 21-23.
- Choudhury SB, Panigrahy RC (1991) Seasonal distribution and behavior of nutrients in the creek and coastal waters of Gopalpur, east coast of India. Mahasagar. Bull Nat Ins Oceanog 24: 81-88.
- Mani P, Krishnamurthy K (1989) Variation of phytoplankton in a tropical estuary (Vellar estuary, Bay of Bengal, India). Inter Review Hydrobiol 74: 109-115.
- Murugan A, Ayyakannu K (1991) Ecology of Uppanar backwaters, Cuddalore: 2. nitrients. Mahasagar 24: 103-108.
- Rajashree G, Panigrahy RC (1995) Seasonal distribution and behaviour of nitrate and phosphate in Rushikulya estuary, east coast of India. Indian J Mar Sci 24: 233-235.
- Segar K, Hariharan V (1989) Seasonal distribution of nitrate, nitrite, ammonia and plankton in effluent discharge area of Mangalore, west coast of India. Indian J Mar Sci18: 170- 173.
- Nair PVR, Gopinathan CP, Balachandran VK, Mathew KJ, Regunathan A, et al. (1984) Ecology of mud banks: Phytoplankton productivity I Alleppey mud bank. Bull Centre Mar Fish Res Ins 31: 28-34.
- Chandran R, Ramamoorthi K (1984) Hydrobiological studies in the gradient zone of the Vellar estuary. I Physico-chemical parameters. Mahasagar Bull Nat Inst Oceanog 17: 69-78.
- Senthilkumar S, Santhanam P, Perumal P (2002) Diversity of phytoplankton in Vellar estuary, Southeast coast of India. The 5th Indian Fisheries Forum Proceedings, (Eds: S. Ayyappan, J.K. Jena and M. Mohan Joseph). Published by AFSIB, Mangalore and AeA, Bhubanewar, India 245-248.
- Sujatha M, Panda D, Panigrahy RC (1993) Physico – chemical characteristics of the Bahuda estuary (Orissa), east coast of India. Indian J Mar Sci 22: 75-77.
- Ramakrishnan R, Perumal P, Santhanam P (1999) Spatio-temporal variations of hydrographical features in the Pichavaram mangroves and Mohi aqua farm, Southeast coast of India. Intl Sem Appl HydrogeochemAnnamalai University, India 197-203.
- Perumal NV, Rajkumar M, Perumal P, Rajasekar KT (2009) Plankton diversity in the Kaduviyar estuary, Nagapattinam, South east coast of India. J Environ Biol 30: 1035-1046.
- Marichamy R, Gopinathan CP, Sivameetan P (1985) Studies on primary and secondary production in relation to hydrography in the inshore waters of Tuticorin. J Mar Biol Ass India 27: 129-137
- Patterson Edward JK, Ayyakkannu K (1991) Studies on the ecology of plankton community of Kollidam estuary, southeast coast of India. I Phytoplankton Mahasagar Bull Nat Ins Oceanog 24: 89-97.
- Rajasegar M, Srinivasan M, Rajaram R (2000) Phytoplankton diversity associated with the shrimp farm development in Vellar estuary, south India. Seaweed Res Utilin22: 125-131.
- Ei-Gindy AAH, Dorghan MM (1992) Interrelation of phytoplankton, chlorophyll and Physio-chemical factors in Arabian Gulf and Gulf of Oman during summer. Indian J Mar Sci 21: 257-261.
- Mani P (1992) Natural phytoplankton communities in pitchavaram mangroves. Indian J Mar Sci 23: 278-280.
- Rajasekar KT, Rajkumar M, Jun Sun, Prabu VA, Perumal P (2005) Seasonal variations of phytoplankton diversity in the Coleroon coastal waters, southeast coast of India. Acta Oceanologica Sinica 29: 97-108.
- Boyd CE, Tucker CS (1998) Waste Management. Pond Aquacult Water Qual Manage 541-575.
- Kannan L, Vasantha V (1992) Micro phytoplankton of the pichavaram mangroves, southeast coast of India. species composition and population density. Hydrobiol 247: 77-86.
- Briggs MRP, Funge-Smith SJ (1994) A nutrient budget of some intensive marine shrimp ponds in Thailand. Aquacult Fish Manage 25: 789-811.
- Christopher Jackson, Nigel Preston, Peter J Thompson, Michele Burford (2003) Nitrogen budget and effluent nitrogen components at an intensive shrimp farm. Aquacult 218: 397-411.
- Anonymous (1978) Fish farms have to watch their waste. Fish Farming Inter 5: 19.
- Burford MA, Glibert PM (1999) Short-term nitrogen uptake and regeneration in early Cairns Jr., J., Mount, D.I., 1990. Aquatic Toxicol Environ Sci Technol 24: 154-161.
Relevant Topics
- Algal Blooms
- Blue Carbon Sequestration
- Brackish Water
- Catfish
- Coral Bleaching
- Coral Reefs
- Deep Sea Fish
- Deep Sea Mining
- Ichthyoplankton
- Mangrove Ecosystem
- Marine Engineering
- Marine Fisheries
- Marine Mammal Research
- Marine Microbiome Analysis
- Marine Pollution
- Marine Reptiles
- Marine Science
- Ocean Currents
- Photoendosymbiosis
- Reef Biology
- Sea Food
- Sea Grass
- Sea Transportation
- Seaweed
Recommended Journals
Article Tools
Article Usage
- Total views: 16859
- [From(publication date):
November-2013 - Oct 17, 2025] - Breakdown by view type
- HTML page views : 11718
- PDF downloads : 5141

