Research Article Open Access
Distribution and Abundance of Amphioxus With Relation To Sediment Characteristics from South East Coast of India
A Babu*, P Sampathkumar, T Balasubramanian, D Varadharajan and T ManikandarajanFaculty of Marine Sciences, Annamalai University, Parangipettai – 608 502, Tamil Nadu, India
- *Corresponding Author:
- Babu A
Faculty of Marine Sciences
Centre of Advanced Study in Marine Biology
Annamalai University, Parangipettai-608 502
Tamil Nadu, India
Tel: 04144-243223
Fax: 04144-243553
E-mail: babumarine@gmail.com
Received date March 05, 2013; Accepted date May 26, 2013; Published date May 31, 2013
Citation: Babu A, Sampathkumar P, Balasubramanian T, Varadharajan D, Manikandarajan T (2013) Distribution and Abundance of Amphioxus With Relation To Sediment Characteristics from South East Coast of India. J Marine Sci Res Dev 3:121. doi:10.4172/2155-9910.1000121
Copyright: © 2013 Babu A, et al. This is an open-access article distributed under the terms of the Creative Commons Attribution License, which permits unrestricted use, distribution, and reproduction in any medium, provided the original author and source are credited.
Visit for more related articles at Journal of Marine Science: Research & Development
Abstract
omicsonline.org
Biodiversity, the variety of life and understood of species survive. Lancelet plays an important role in marine benthic food chain. A study was carried out to observe the abundance and diversity of marine bottom lancelet and observations on sediment characteristics. The lancelet were collected station 1 at Cooum the maximum of 98.12 No/ m2 was observed in site IV and minimum of 4.22 No/m2 was observed in site II. Station 2 at Muttukadu the maximum of 165.12 No/m2 was observed in site I and minimum of 1.10 No/m2 was observed in site IV. Station 3 at Pondicherry the maximum of 98.8 No/m2 was recorded in site II and minimum of 2.35 No/m2 was recorded in site IV. At all station when compared the maximum species was observed in Muttukadu and minimum in Cooum during the study period.
Keywords
Lancelet; Diversity Record; Branchiostoma Sp; Sediment Characteristics
Introduction
A study on the abundance of amphioxus and larvae was to estimate the marine resources or biodiversity. Most of the amphioxus are marine habitat, particularly in larvae are pelagic and adults both in pelagic and benthic nature. It produces young ones in open sea at both pelagic and benthic [1,2]. Amphioxus is one among the macrobenthic organisms which are retained on 0.5 mm screen [3]. Benthic communities represented by diversified population within the sediments, it play an important role in enhancing fish production through a food chain [4,5]. Benthic fauna have been found to vary greatly in sensitivity to various types of pollution. Benthic communities often have been regarded as good indicators of organic pollution and also free from organic pollution because of their constant presence. The present study focused with the density and distribution of amphioxus with respect to sediments characters in the study area.
Materials and Methods
The study was conducted in three different stations, Cooum (station1), Muttukadu (station 2), Pondicherry (station 3) and each station has 4 sampling sites depend on the distances and depth during the year of January 2008-December 2008. Sample collection was using a Peterson grab (0.0256 m2). Two samples were collected at each site, one for benthic faunal analysis and one for sediment analysis. Specimens of amphioxus were collected, enumerated and preserved with 5% buffered formalin. After collecting samples, they were emptied into a plastic tray. The larger organisms were picked out immediately from the sediment and then sieved through 0.5 mm mesh screen. The procedure adopted for sampling was followed the standard method proposed by Mudroch and MacKnight [6]. This procedure was repeated number of times, gradually breaking up the sediment until the majority of the mud and suspended specimens were removed. The organisms retained by the sieve were placed in a labelled container and fixed in 5% formalin.
Subsequently, the organisms were stained with Rose Bengal solution (0.1 g in 100 ml of distilled water) for enhanced visibility during identification, once the fixative was added, each sealed sample container was gently upturned and rotated to distribute the formalin evenly throughout the sieved sample. At all stages of the sieving, care was taken to individually remove noticed fragile animals. Once back at the laboratory, the sieved samples were gently but thoroughly washed in freshwater. The samples were preserved with 75% alcohol for further identification. The density of macro fauna amphioxus is expressed as number of individuals/m2).
Sediment analysis
For sediment analysis, the sediment dried by sunshade and then dried samples used for the estimation of total organic carbon by conventional methods; they were dry-sieved with the help of a mechanical shaker. The sand, silt and clay fraction was determined as the amount of sediment in different sieves.
Results
Total organic carbon (mg/g)
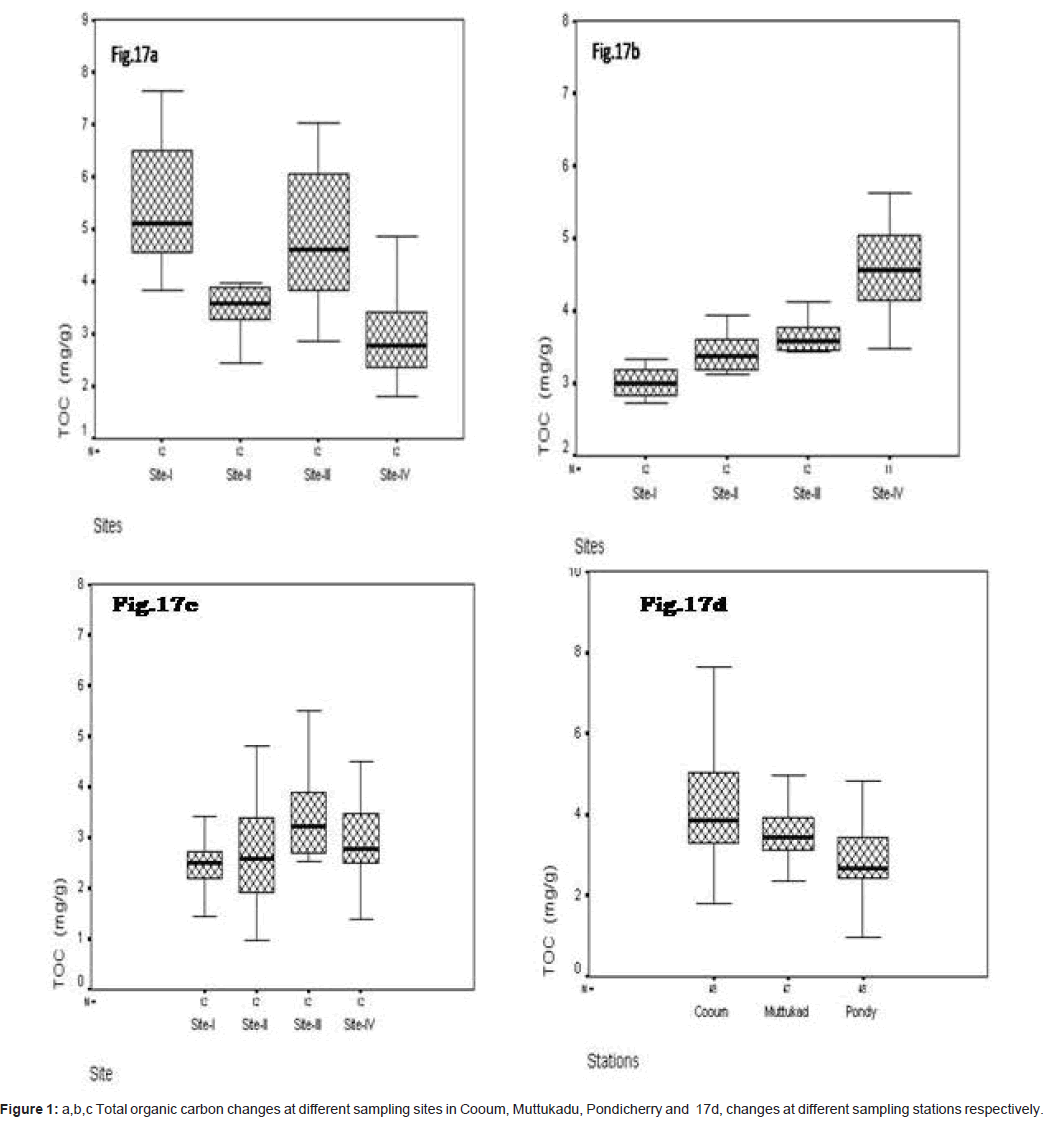
In site wise, the concentration of total organic carbons varied at Cooum, the minimum of 1.794 mg/g was observed at site II and the maximum of 7.632 mg/g at site I (Figure 1a). At Muttukadu, the minimum of 2.345 mg/g was observed at site I and the maximum of 5.840 mg/g at site IV (Figure 1b). At Pondicherry, the minimum of 0.760 mg/g was observed at site I and the maximum of 6.880 mg/g at site IV (Figure 1c). The station wise the minimum was observed at Pondicherry and the maximum at Cooum during the study period (Figure 1d).
Sand (%)
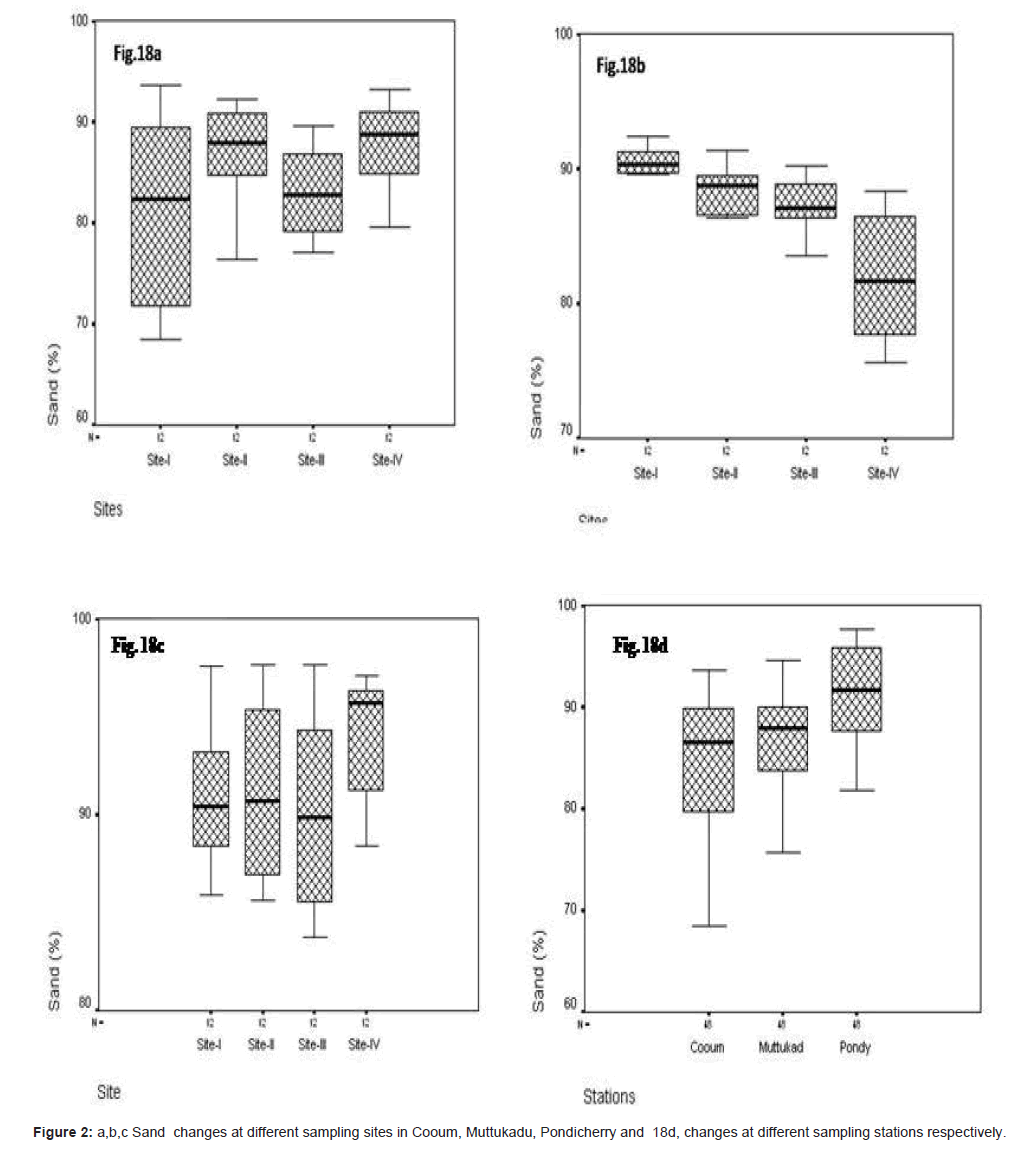
In site wise, sand varied at Cooum minimum of 62.42% was observed at site I and the maximum of 93.67% at site IV (Figure 2a). At Muttukadu, the minimum of 2.345 % at site I and the maximum of 5.840 % at site IV (Figure 2b). At Pondicherry the minimum of 0.760 % at site I and the maximum of 6.880 % at site IV (Figure 2c). The station wise, minimum was observed at Cooum, and the maximum at Pondicherry (Figure 2d).
Silt (%)
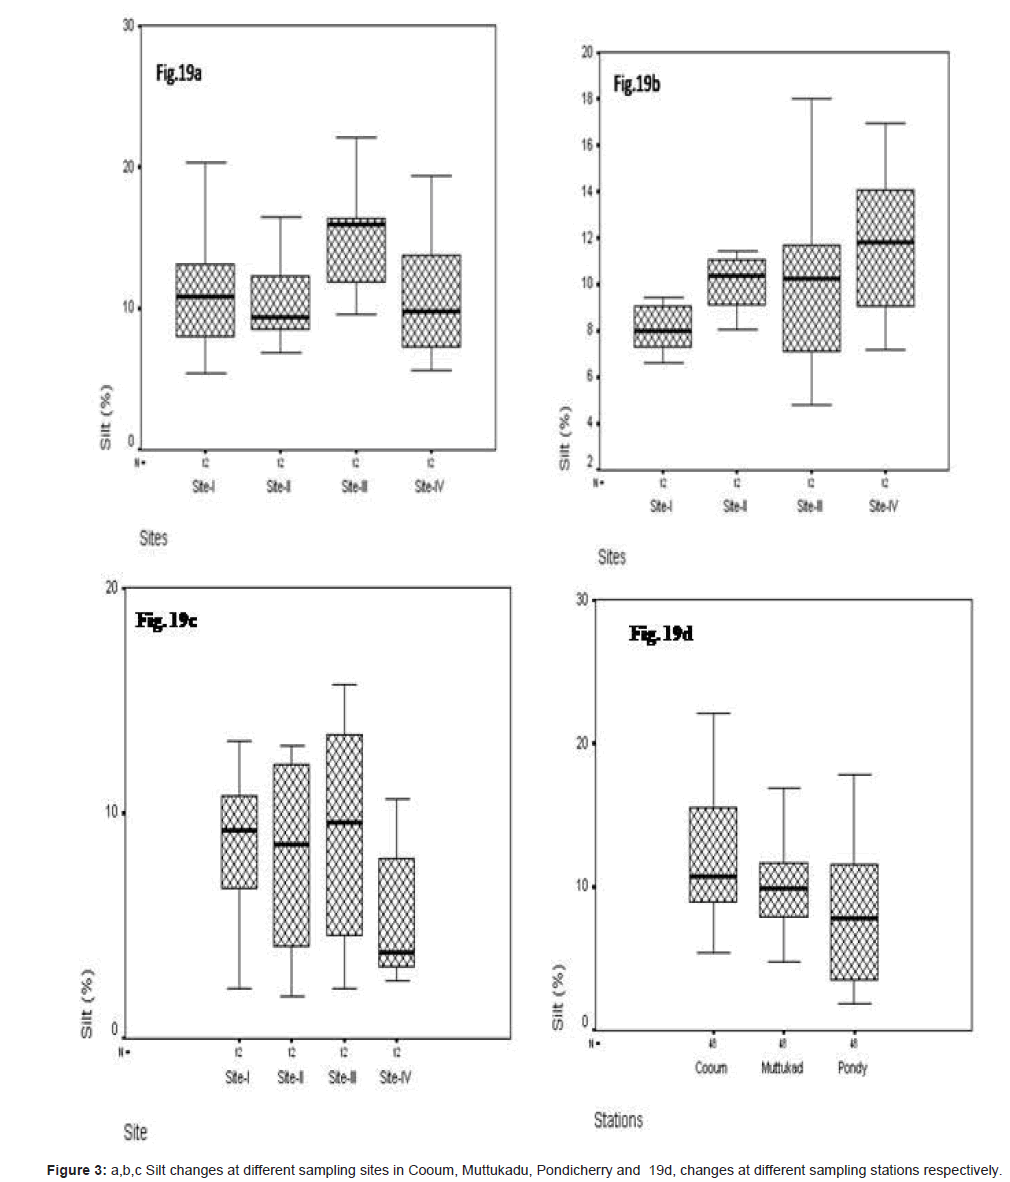
In site wise, silt varied at Cooum, the minimum of 5.34 % at site I and the maximum of 22.13% at site III (Figure 3a). At Muttukadu, the minimum of 4.82 % at site II and the maximum of 18.020 % at site IV (Figure 3b). At Pondicherry the minimum of 1.860 % at site III and the maximum of 17.781 % at site IV (Figure 3c). The station wise minimum was observed at Pondicherry and the maximum at Cooum (Figure 3d).
Clay (%)
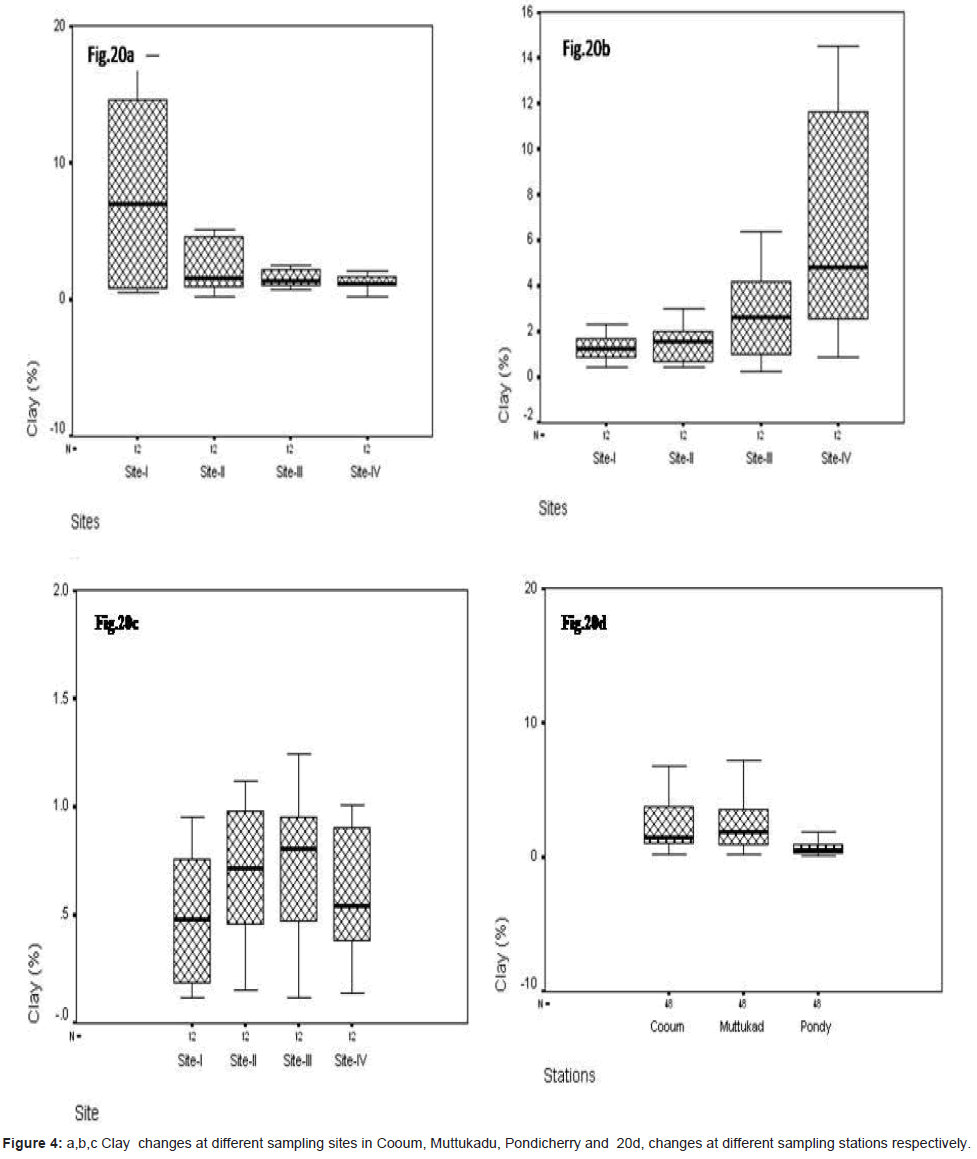
In site wise, clay varied at Cooum, the minimum of 0.15% in site IV and the maximum of 17.86 % in site I (Figure 4a). At Muttukadu, the minimum of 0.235% at site I and the maximum of 14.51 % at site IV (Figure 4b). At Pondicherry, the minimum of 0.121% at site IV and the maximum of 1.828 % at site III (Figure 4c). The station wise minimum was observed at Cooum and the maximum at Pondicherry during the study period (Figure 4d).
Branchiostoma lanceolatum (No/m2)
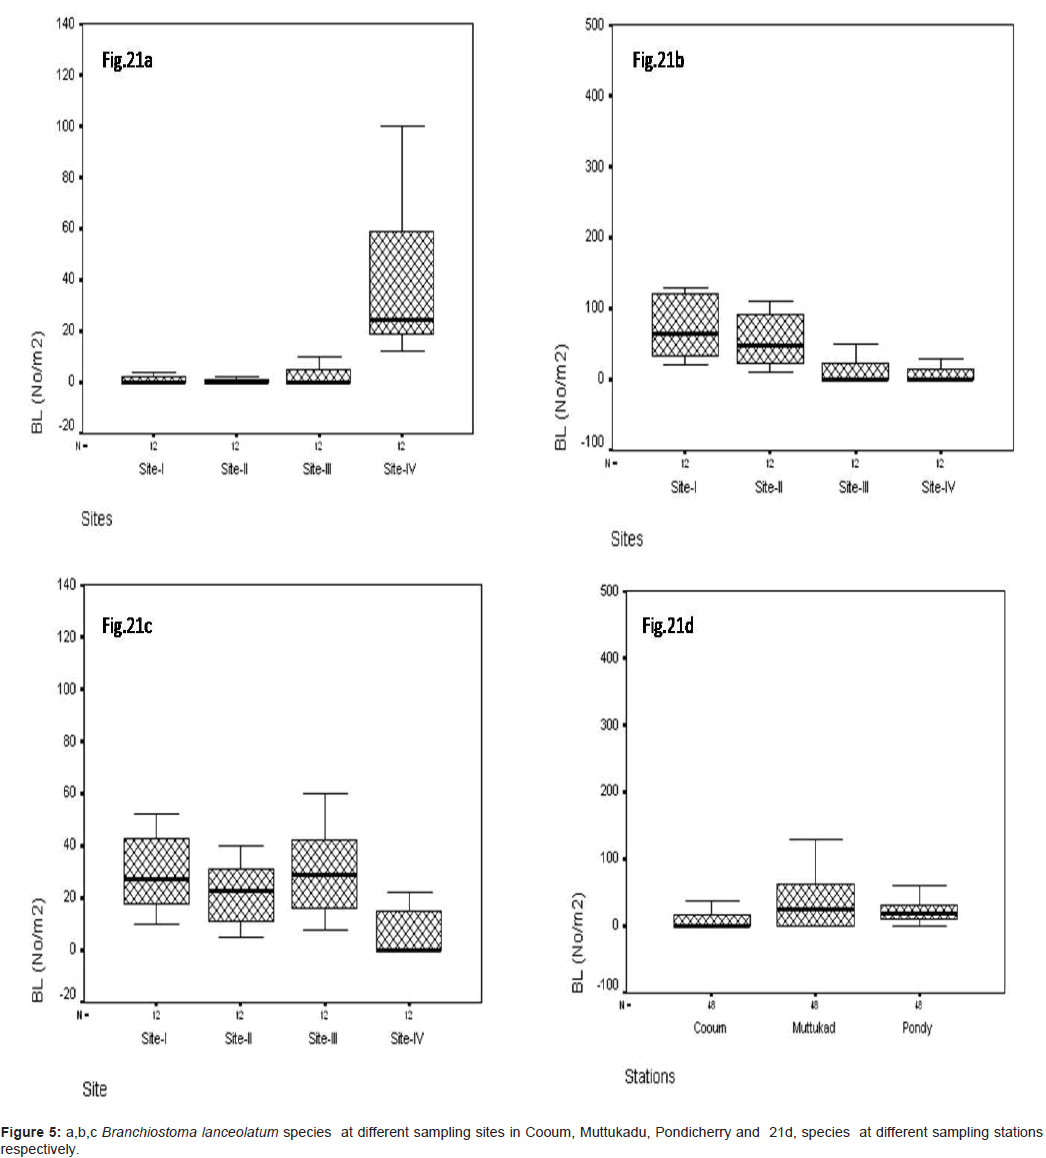
In site wise B. lanceolatum was observed during the study period, At Cooum the minimum of 0.22 No/m2 was observed at site III and the maximum of 23.12 No/m2 in site IV (Figure 5a). At Muttukadu minimum of 0.10 No/m2 was observed at site IV and the maximum of 98.12 No/m2 at site I (Figure 5b). At Pondicherry the minimum of 0.35 No/m2 was observed at site IV and the maximum of 32.8 No/m2 at site III (Figure 5c). The station wise maximum was observed at Muttukadu and minimum in Cooum during the study period (Figure 5d).
Branchiostoma belcheri (No/m2)
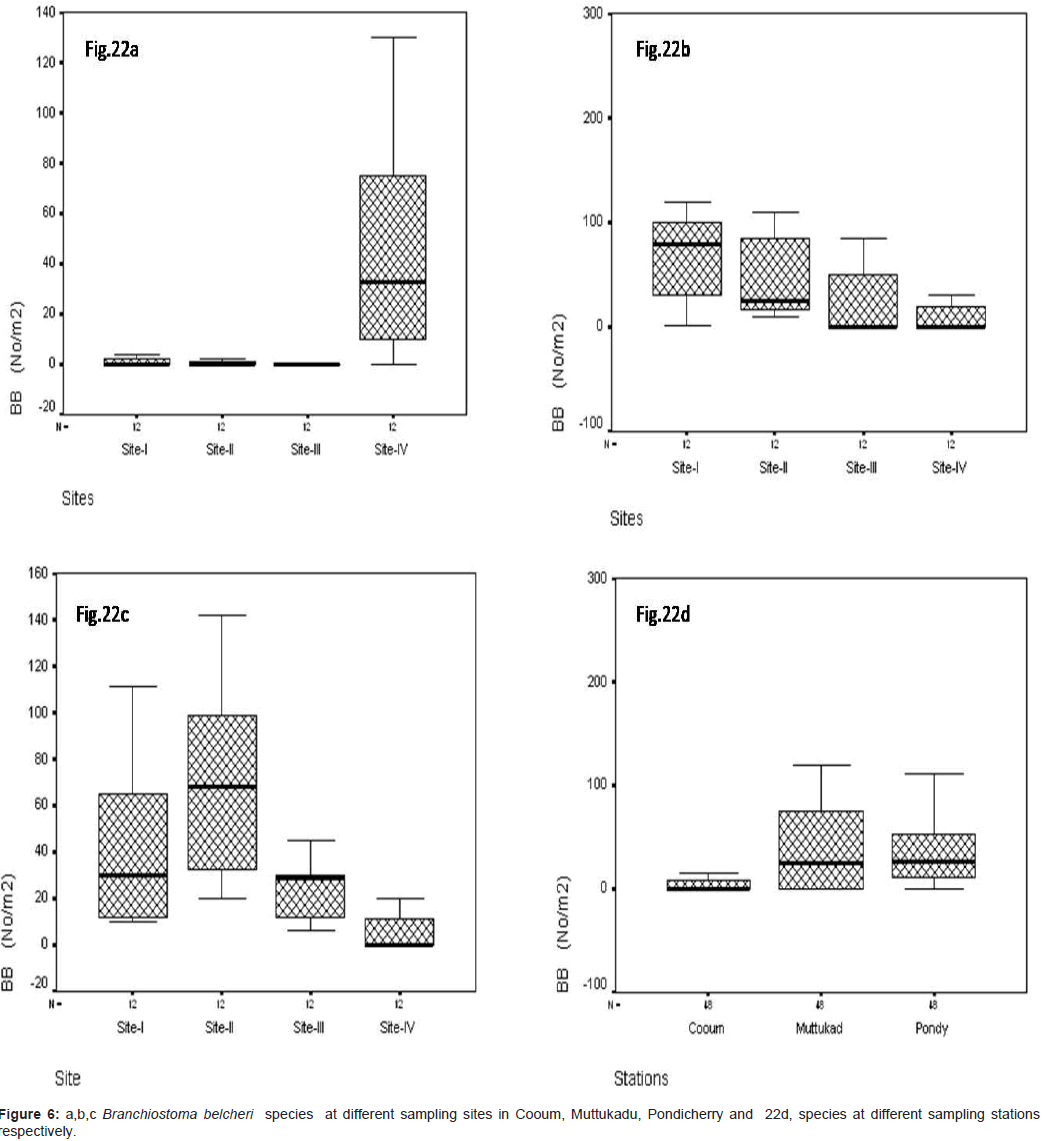
In site wise, B. belcheri was observed during the study period, At Cooum, the minimum of 0.22 No/m2 were observed at site III and the maximum of 33.12 No/m2 at site IV (Figure 6a). At Muttukadu, the minimum of 0.10 No/m2 was observed at site IV and the maximum of 99.12 No/m2 in site I (Figure 6b). At Pondicherry, the minimum of 0.35 No/m2 in site IV and the maximum of 72.8 No/m2 at site III (Figure 6c). The station wise maximum was recorded in Muttukadu and minimum in Cooum during the study period (Figure 6d). Statistical significant changes were occurred in sampling stations and site (P ≤ 0.05).
Branchiostoma indicum (No/m2)
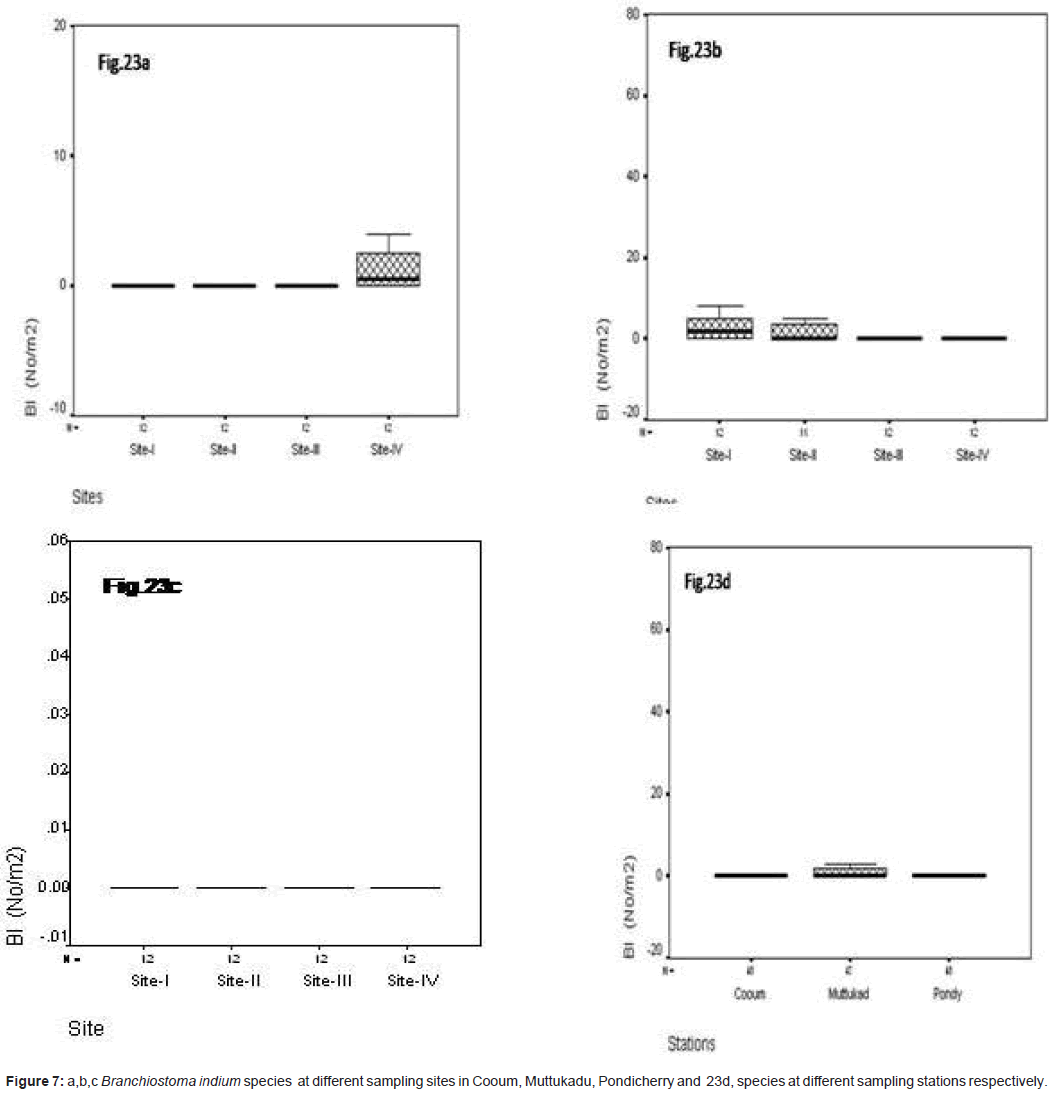
In site wise, B. indicum was observed during the study period, at Cooum the minimum of 0.12 No/m2 was observed at site IV and the maximum of 0.22 No/m2 at site IV (Figure 7a). At Muttukadu the minimum of 0.10 No/m2 was observed at site IV and the maximum of 0.12 No/m2 in site I (Figure 7b). At Pondicherry the minimum of 0.35 No/m2 was observed at site IV and the maximum of 0.8 No/ m2 in site I (Figure 7c). The station wise maximum was observed at Muttukadu and minimum in Cooum during the study period. (Figure 7d). Statistical significant changes were occurred in sampling stations and site (P ≤ 0.05).
Branchiostoma malayanum (No/m2)
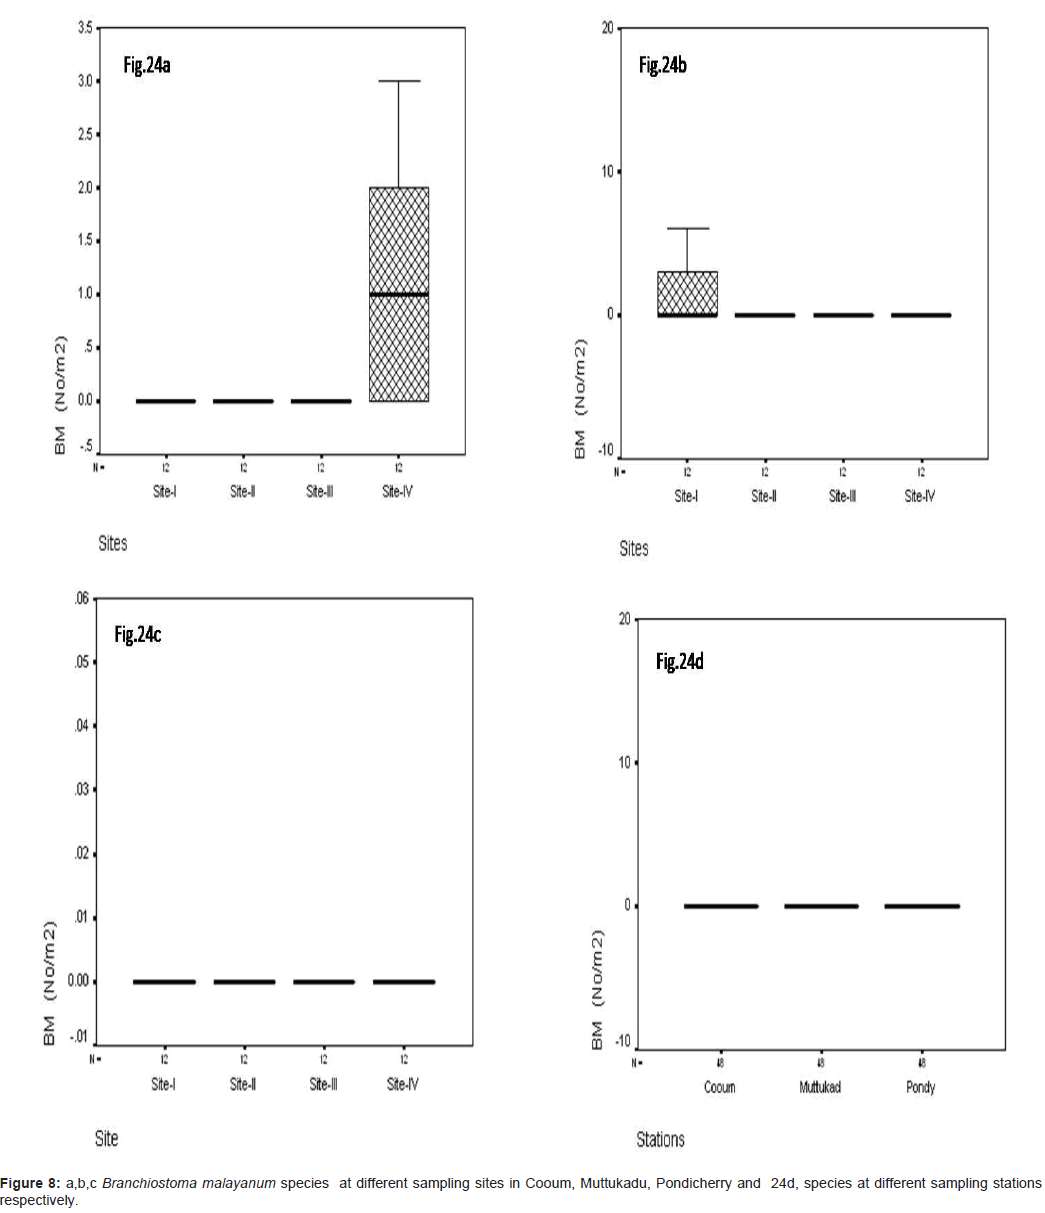
The Branchiostoma malayanum were recorded during the study period at Cooum the minimum of 0.22 No/m2 at site IV and the maximum of 99.12 No/m2 at site IV (Figure 8a). At Muttukadu the minimum of 0.10 No/m2 was observed at site IV and the maximum of 152.12 No/m2 in site I (Figure 8b). At Pondicherry, minimum of 0.35 No/m2 was observed at site IV and the maximum of 98.8 No/m2 were observed at site II (Figure 8c). The station wise, maximum was recorded in Muttukadu and minimum in Cooum during the study period (Figure 8d). Statistical significant changes were occurred in sampling stations and site (P ≤ 0.05).
Amphioxus population density (No/m2)
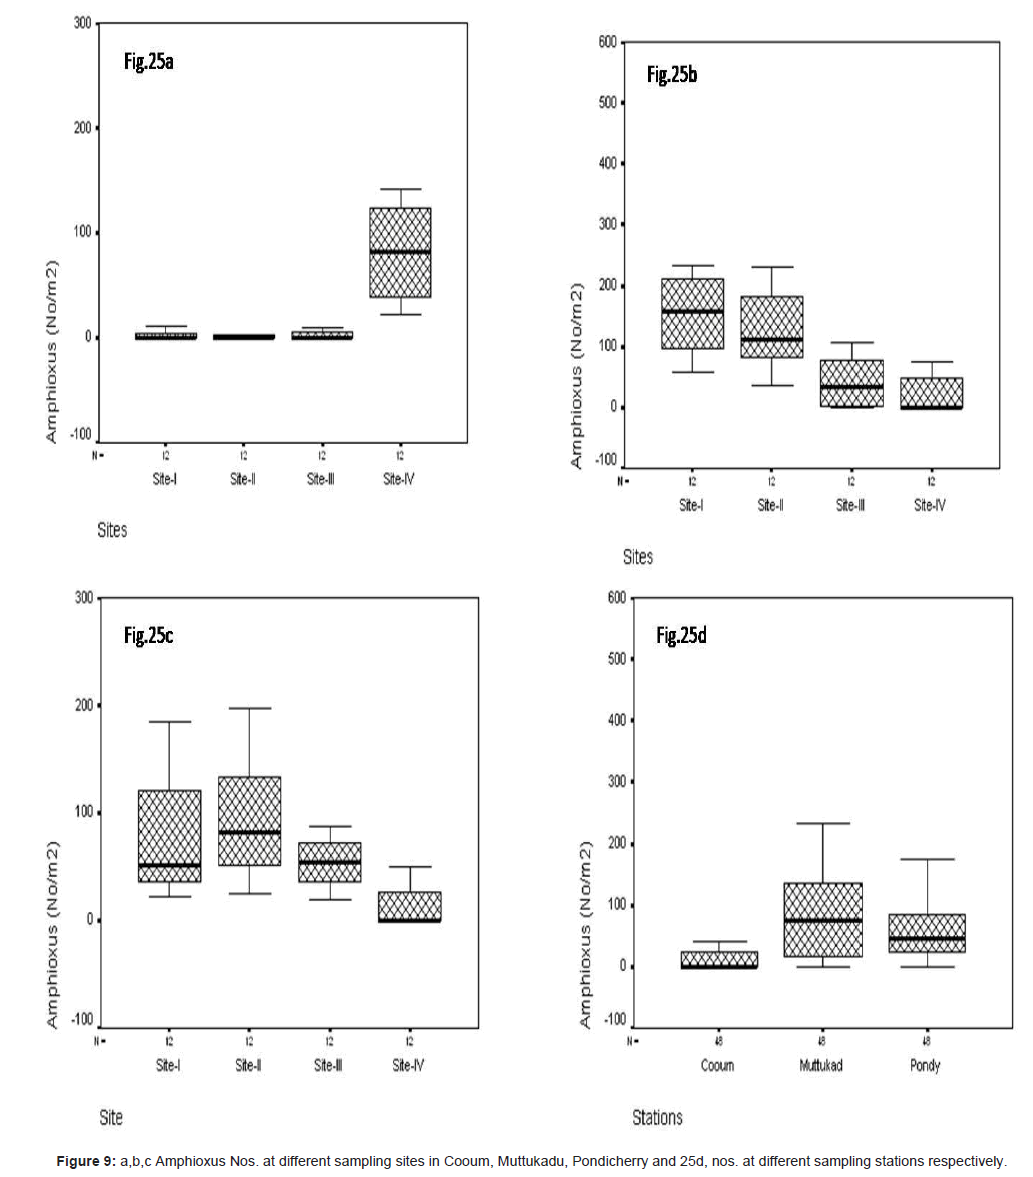
In site wise amphioxus was observed during the study period at Cooum the minimum of 4.22 No/m2 at site II and the maximum of 98.12 No/m2 at site IV (Figure 9a). At Muttukadu, the minimum of 1.10 No/m2 was observed at site IV and the maximum of 165.12 No/ m2 at site I (Figure 9b). At Pondicherry, the minimum of 2.35 No/ m2 was observed at site IV and the maximum of 98.8 No/m2 at site II (Figure 9c). The station wise maximum was observed at Muttukadu and minimum in Cooum during the study period (Figure 9d).
Statistical interpretation
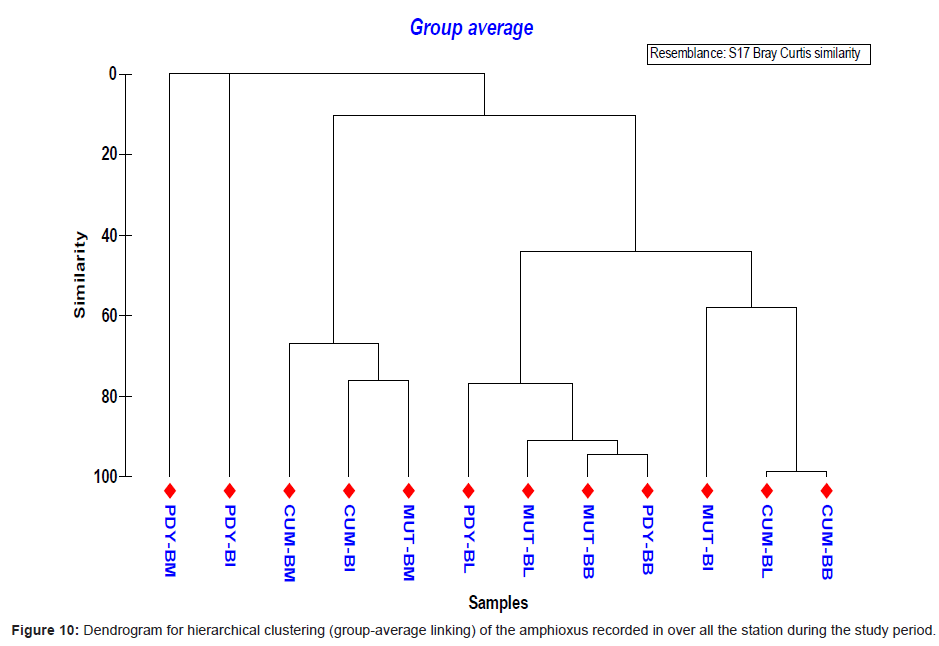
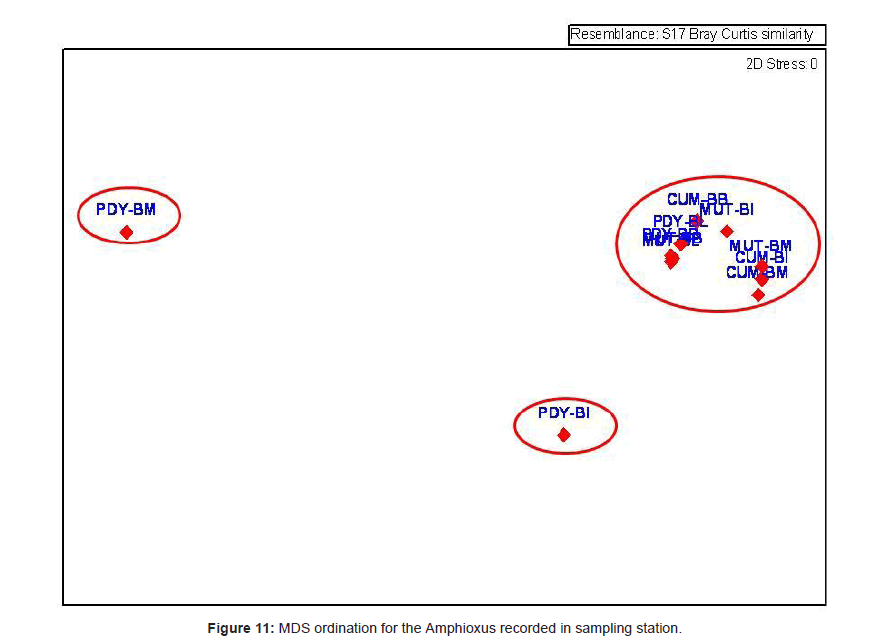
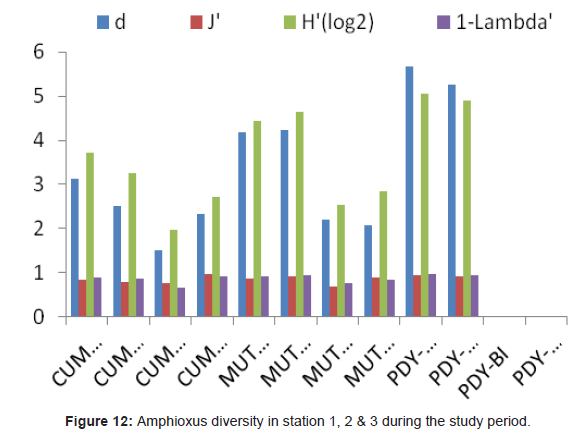
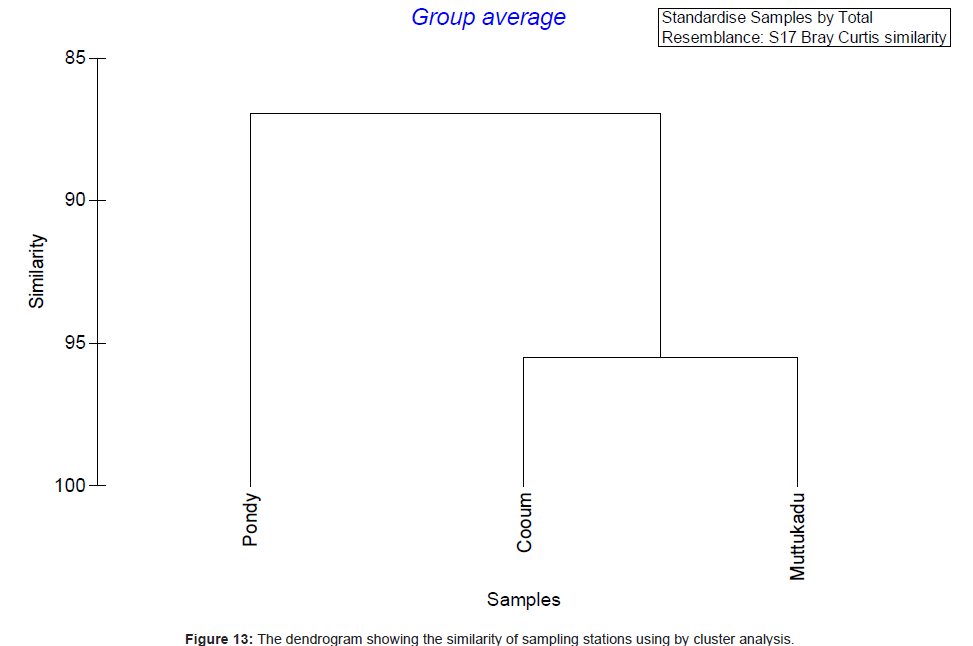
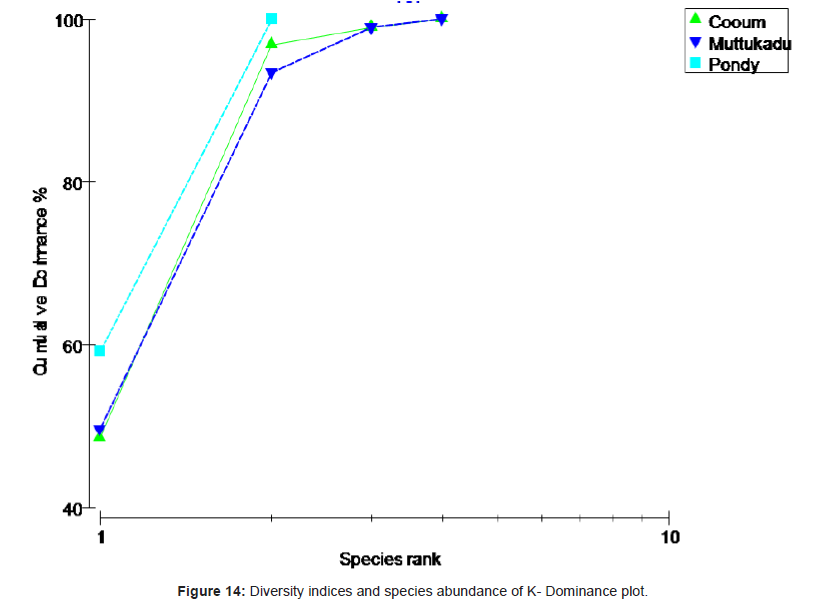
Analysis of variance test results (ANOVA) for comparison of sediment characteristics between stations 2, 3 and 4 are given in table 1. Cluster analysis is technique in which entities are sequentially linked together according to their similarity or dissimilarity producing a two dimensional hierarchical structure (dendrogram). In the present study, the cluster analysis was employed to know the similarity between samples and the results are shown in figure 10. Dendrogram (Figure 10) and MDS ordination (Figure 11) were showed that the distribution and abundance of Branchiostoma spp. between three stations, among them Muttukadu and Cooum showed similar distribution and abundance whereas Pondicherry showed different distribution and abundance pattern (Table 2 and Figure 12). The dendrogram clearly revealed that (Figure 13) Muttukadu and Cooum were grouped at the highest level of similarity (85%), followed by Pondicherry group at the next level of similarity. It is indicates that the excellent ordination pattern between the samples and stations (Figure 13). In order to ascertain the diversity pattern graphically, K- dominance plot was drawn combine for 3 stations (Figure 14) and shown the pronounced variation between these 3 stations. The trend observed in diversity index was quite evident here as well. The plots are drawn for 3 stations blue colour indicating the presence of more number of species at Muttukadu. As the percentage contribution of each species was added, the curve extended horizontally giving `S` shape, before reaching the cumulative 100%.
| Source | Type III Sum of Squares | df | Mean Square | F | Sig. | |||||||||||
|---|---|---|---|---|---|---|---|---|---|---|---|---|---|---|---|---|
| STATIONS | 98788.722(a) | 2 | 49394.361 | 10.934 | 0.000 | |||||||||||
| SITE | 65573.833(a) | 3 | 21857.944 | 4.566 | 0.004 | |||||||||||
| MONTH | 68961.222(a) | 11 | 6269.202 | 1.241 | 0.266 | |||||||||||
| TOTAL ORGANIC CARBON (mg/g) | ||||||||||||||||
| Corrected Model | 623569.012(a) | 99 | 6298.677 | 2.415 | 0.001 | |||||||||||
| Intercept | 395412.178 | 1 | 395412.178 | 151.577 | 0.000 | |||||||||||
| TOC (mg/g) | 623569.012 | 99 | 6298.677 | 2.415 | 0.001 | |||||||||||
| Error | 112171.967 | 43 | 2608.650 | |||||||||||||
| Total | 1226352.000 | 143 | ||||||||||||||
| Corrected Total | 735740.979 | 142 | ||||||||||||||
| SAND (%) | ||||||||||||||||
| Corrected Model | 646839.889(a) | 124 | 5216.451 | 1.114 | 0.413 | |||||||||||
| Intercept | 467069.923 | 1 | 467069.923 | 99.774 | 0.000 | |||||||||||
| SAND (%) | 646839.889 | 124 | 5216.451 | 1.114 | 0.413 | |||||||||||
| Error | 88944.000 | 19 | 4681.263 | |||||||||||||
| Total | 1229056.000 | 144 | ||||||||||||||
| Corrected Total | 735783.889 | 143 | ||||||||||||||
| SILT(%) | ||||||||||||||||
| Corrected Model | 575222.722(a) | 131 | 4391.013 | 0.328 | 0.999 | |||||||||||
| Intercept | 435261.316 | 1 | 435261.316 | 32.531 | 0.000 | |||||||||||
| SILT (%) | 575222.722 | 131 | 4391.013 | 0.328 | 0.999 | |||||||||||
| Error | 160561.167 | 12 | 13380.097 | |||||||||||||
| Total | 1229056.000 | 144 | ||||||||||||||
| Corrected Total | 735783.889 | 143 | ||||||||||||||
| CLAY (%) | ||||||||||||||||
| Corrected Model | 557591.472(a) | 124 | 4496.705 | 0.479 | 0.991 | |||||||||||
| Intercept | 413958.855 | 1 | 413958.855 | 44.139 | 0.000 | |||||||||||
| CLAY (%) | 557591.472 | 124 | 4496.705 | 0.479 | 0.991 | |||||||||||
| Error | 178192.417 | 19 | 9378.548 | |||||||||||||
| Total | 1229056.000 | 144 | ||||||||||||||
| Corrected Total | 735783.889 | 143 | ||||||||||||||
| DEPTH (m) | ||||||||||||||||
| Corrected Model | 298368.438(a) | 68 | 4387.771 | 0.752 | 0.883 | |||||||||||
| Intercept | 337316.631 | 1 | 337316.631 | 57.837 | 0.000 | |||||||||||
| DEPTH (m) | 298368.438 | 68 | 4387.771 | 0.752 | 0.883 | |||||||||||
| Error | 437415.451 | 75 | 5832.206 | |||||||||||||
| Total | 1229056.000 | 144 | ||||||||||||||
| Corrected Total | 735783.889 | 143 | ||||||||||||||
| Branchiostoma lanceolatum(No/m2) | ||||||||||||||||
| Corrected Model | 640283.108(a) | 43 | 14890.305 | 15.592 | 0.000 | |||||||||||
| Intercept | 644378.171 | 1 | 644378.171 | 674.736 | 0.000 | |||||||||||
| BL (No/m2) | 640283.108 | 43 | 14890.305 | 15.592 | 0.000 | |||||||||||
| Error | 95500.781 | 100 | 955.008 | |||||||||||||
| Total | 1229056.000 | 144 | ||||||||||||||
| Corrected Total | 735783.889 | 143 | ||||||||||||||
| Branchiostoma belcheri(No/m2) | ||||||||||||||||
| Corrected Model | 595253.657(a) | 43 | 13843.108 | 9.851 | 0.000 | |||||||||||
| Intercept | 757434.095 | 1 | 757434.095 | 538.983 | 0.000 | |||||||||||
| BB (No/m2) | 595253.657 | 43 | 13843.108 | 9.851 | 0.000 | |||||||||||
| Error | 140530.232 | 100 | 1405.302 | |||||||||||||
| Total | 1229056.000 | 144 | ||||||||||||||
| Corrected Total | 735783.889 | 143 | ||||||||||||||
| Branchiostoma malayanum (No/m2) | ||||||||||||||||
| Corrected Model | 36035.114(a) | 7 | 5147.873 | 1.001 | 0.434 | |||||||||||
| Intercept | 89169.516 | 1 | 89169.516 | 17.331 | 0.000 | |||||||||||
| BM (No/m2) | 36035.114 | 7 | 5147.873 | 1.001 | 0.434 | |||||||||||
| Error | 699748.775 | 136 | 5145.212 | |||||||||||||
| Total | 1229056.000 | 144 | ||||||||||||||
| Corrected Model | 36035.114(a) | 7 | 5147.873 | 1.001 | 0.434 | |||||||||||
Table 1: Analysis of variance (Two way) dependent variable Amphioxus No/m2 were expressed in different stations Cooum, Muttukadu and Pondicherry.
| S | N | d | J' | H'(log2) | 1-Lambda' | |
|---|---|---|---|---|---|---|
| CUM-BL | 21 | 588 | 3.136405 | 0.845484 | 3.713634 | 0.898695 |
| CUM-BB | 17 | 600 | 2.5012 | 0.795957 | 3.253444 | 0.864307 |
| CUM-BI | 6 | 27 | 1.517065 | 0.759718 | 1.963841 | 0.669516 |
| CUM-BM | 7 | 13 | 2.339227 | 0.968632 | 2.719295 | 0.910256 |
| MUT-BL | 33 | 2147 | 4.171106 | 0.87846 | 4.431298 | 0.927713 |
| MUT-BB | 33 | 1893 | 4.240703 | 0.917777 | 4.629627 | 0.951241 |
| MUT-BI | 13 | 234 | 2.199687 | 0.68583 | 2.537872 | 0.764352 |
| MUT-BM | 9 | 46 | 2.089514 | 0.899362 | 2.850909 | 0.846377 |
| PDY-BL | 41 | 1172 | 5.660537 | 0.940736 | 5.040041 | 0.963192 |
| PDY-BB | 40 | 1694 | 5.245568 | 0.922141 | 4.907566 | 0.959461 |
| PDY-BI | 0 | 0 | 0 | 0 | 0 | 0 |
| PDY-BM | 0 | 0 | 0 | 0 | 0 | 0 |
Table 2: Amphioxus diversity in station 1, 2 and 3 during the study period.
Discussion
Order Amphioxiformes, Family Branchiostomidae, amphioxus is a lancelet in the subphylum Cephalochordata. The cephalochordate amphioxus the closest invertebrate relative to the vertebrates, possessing a vertebrate-like body plan, with nothocord, hollow dorsal nerve cord, segmented muscle are arranged in blocks called myomeres, perforated pharyngeal region slits and post anal tail and tail that runs past the anus [3,6,7]. However, amphioxus is devoid of most of the complex features of vertebrates, as an elaborated brain or paired fins. It is one of the marine invertebrate are inhabits in soft substrates and intertidal shallow regions. The evolutionary science it is used as a model organism to study the development of vertebrates. It has an assortment of cells and organs for sensing light and mechanical stimuli and also it has simple but plausible homologs of both the pineal and paired eyes of vertebrates. Male and female amphioxus is moreover similar and also due to differs only in the structure of gonads. The fish like structure of marine chordates are in the environment among their distribution the number of species usually found half buried in sand. Amphioxus is important for food in human and domesticated animals and evolution studies and they provide indications about the origin of the vertebrates [8,9]. The related modern studies are important especially biotechnology oriented research. Diversity of amphioxus is important because it provides own ecosystem and culture with unique and inspirational perspectives. It can create new ideas and changes that can be beneficial to an ecosystem.
In the present study the distributions and abundance of amphioxus at three stations and 12 sampling sites were examined by the basis of distance and depth, in which the results showed that amphioxus was present in all the three stations, mostly at near-shore sites expect Cooum (up to 1 km offshore). Where in the total of 7 out of the 12 sampling sites were recorded with the presence of amphioxus respectively, Cooum, Muttukadu and Pondicherry, the density from 3 to 478 ind/m2, and 58.52 ind/m2 on average. Muttukadu, amphioxus was present at two of the four sampling sites, with density from 40 to 230 ind/m2, and 123.5 ind/m2 on average. Cooum, amphioxus was present at all four sampling sites, with density ranging from 2 to 273ind/m2, and 30.91 ind/m2 on average. Pondicherry, amphioxus was also present at all the three sampling sites, with density ranging from 22 to 197 ind/m2, and 62.51 ind/m2 on average. Of all four of the 3 stations sampled, the highest abundance was located at Muttukadu site 1km, where amphioxus was present with density of 123.5 ind/m2. The marine bottoms have a different benthic substratum nature of composition sand, silt and clay. The present study was considered the maximum amphioxus was observed in organically rich sediments [10-12]. It is one of the main reasons for the maximum species was abundance and diversity in these sampling stations during the study period. Species abundance and diversity maximum was observed in sand and sandy substrate and minimum of species abundance or poor was observed in clay substratum. The distributions and abundances of the amphioxus that produce sediments depend upon such environmental factors and waters in which the organisms live. This study were made in previous studies was represented by Ansari [12] has been reported maximum of fauna are associated with sandy substrate. Varadharajan et al. [13] has been reported the pollution is the major problem of the benthic species diversity, Manoharan et al. [14] has been observed substratum is important for benthic species survival and abundance. Sundaravarman et al. [15] has been reported physico-chemical parameters can affect the benthic species diversity. Fishing, climate change and pollution have left an indelible mark on virtually of the coastal ecosystem. Fishing are using with advances in fishing equipment, larger ships and new tracking technologies many species in these ecosystem have been reduced are significantly. The impact of marine species there are environmental problems that are linked to human lifestyles. However the amphioxus studies basically are very difficult ones, since the species identification is not easily. Due to the species the first time were reported along Indian coast it can be helpful for new species identification. The anthropogenic and manmade pollution should be avoiding these coastal ecosystems and monitoring is need for conservation and managements.
References
- Baker CV (2008) The evolution and elaboration of vertebrate neural crest cells. Curr Opin Genet Dev18: 536-543.
- Da Silva LFB, Tavares M, Soares-Gomes A (2008) Population structure of the lancelet Branchiostoma caribaeum (Cephalochordata: Branchiostomidae) in the Baía de Guanabara, Rio de Janeiro, southeastern Brazil. Rev Bras Zool25: 617-623.
- Chin TG (1941) Studies on the biology of the Amoy amphioxus Branchiostoma belcheri Gray. Philipp J Sci75: 369-421.
- Coull BC (1973) Estuarine Meiofauna– A review, trophic relationships and microbial interactions 499-511.
- Holland ND, Chen J (2001) Origin and early evolution of the vertebrates: new insights from advances in molecular biology, anatomy, and palaeontology. Bio Essays23: 142-151.
- Mudroch A, MacKnight SD (1994) CRC handbook of techniques for aquatic sediment sampling, (2nd Ed.), CRC Press, Boca Raton, FL, USA.
- Kaneto S, Wada H (2011) Regeneration of amphioxus oral cirri and its skeletal rods: implications for the origin of the vertebrate skeleton. J Exp Zool B Mol Dev Evol 316: 409-417.
- Poss SGaB, Boschung HT (1996) Lancelets (Cephalochordata: Branchiostomatidae): how many species are valid? Israel J Zool Suppl 42: 13-66.
- Holland LZ, Laudet V, Schubert M (2004) The chordate amphioxus: an emerging model organism for developmental biology. Cell Mol Life Sci 61: 2290-2308.
- Wang Y, Zhao PS, Wang J (2002) The comparison of the growth and development of the lancelets Branchiostoma belcheri tsingtaunese reared with natural and artificial seawater. Natural Science Journal of Hainan University 20: 62-66.
- Zhang QJ, Zhong J, Fang SH, Wang YQ (2006) Branchiostoma japonicum and B. belcheri are distinct lancelets (Cephalochordata) in Xiamen waters in China. Zoolog Sci 23: 573-579.
- Ansari ZA (1977) Macrobenthos of the Cochin backwater. Mahasagar- Bulletin of theNational Institute of Oceanography10: 169-171.
- Varadharajan D, Soundarapandian P, Gunalan B, Babu R (2010) Seasonal Abundance of Macro Benthic Composition and Diversity along the South East Coast of India. Europ J Appl Sci 2: 1-5.
- Manoharan J, Varadharajan D, Thilagavathi B, Priyadharsini S (2011) Biodiversity and abundance of benthos along the South East Coast of India. Advan Appl Sci Res 2: 554-562.
- Sundaravarman K, Varadharajan D, Babu A, Saravanakumar A, Vijayalakshmi S, et al. (2012) A study of a marine benthic fauna with special reference to the environmental parameters, south east coast of India. Inter J Pharma Biol Arch 3: 1157-1169.
Relevant Topics
- Algal Blooms
- Blue Carbon Sequestration
- Brackish Water
- Catfish
- Coral Bleaching
- Coral Reefs
- Deep Sea Fish
- Deep Sea Mining
- Ichthyoplankton
- Mangrove Ecosystem
- Marine Engineering
- Marine Fisheries
- Marine Mammal Research
- Marine Microbiome Analysis
- Marine Pollution
- Marine Reptiles
- Marine Science
- Ocean Currents
- Photoendosymbiosis
- Reef Biology
- Sea Food
- Sea Grass
- Sea Transportation
- Seaweed
Recommended Journals
Article Tools
Article Usage
- Total views: 16549
- [From(publication date):
September-2013 - Oct 29, 2025] - Breakdown by view type
- HTML page views : 11794
- PDF downloads : 4755

