Research Article Open Access
Differences and Similarities in the Metabolism of Glyburide for Various Species: An Analysis by LC-DAD-Q-TRAP-MS/MS
Selvan Ravindran*, Santosh Kapil Kumar Gorti, Sudipta Basu, Prashant Surve and Pradnya Honrao
Department of Biotransformation, Drug Metabolism and Pharmacokinetics Unit, Sai Life Sciences Limited, Pune, India
- *Corresponding Author:
- Selvan Ravindran, Ph.D.
Department of Biotransformation
Drug Metabolism & Pharmacokinetics Unit
Sai Life Sciences Limited
International Bio-Tech Park
Phase-II, Hinjewadi, Pune-411 057, India
Tel: +91 20 6674 3600
Fax: +91 20 6674 3645
E-mail: selvan.r@sailife.com, selvan_ravindran@yahoo.com
Received date: January 30, 2013; Accepted date: March 15, 2013; Published date: March 18, 2013
Citation: Ravindran S, Kumar Gorti SK, Basu S, Surve P, Honrao P (2013) Differences and Similarities in the Metabolism of Glyburide for Various Species: An Analysis by LC-DAD-Q-TRAP-MS/MS. J Anal Bioanal Tech 4:164. doi: 10.4172/2155-9872.1000164
Copyright: © 2013 Ravindran S, et al. This is an open-access article distributed under the terms of the Creative Commons Attribution License, which permits unrestricted use, distribution, and reproduction in any medium, provided the riginal author and source are credited.
Visit for more related articles at Journal of Analytical & Bioanalytical Techniques
Abstract
Studies were conducted on the Metabolism of sulfonylurea drug glyburide (5-chloro-N-(4-[N-(cyclohexylcarbamoyl) sulfamoyl] phenethyl)-2-methoxybenzamide) in human, mouse, rat, dog and monkey hepatic microsomes. Liquid chromatography with Diode array detector (LC-DAD) hyphenated with Q-Trap-Mass Spectrometer (Q-TRAP-MS/ MS) was employed to study the metabolism of glyburide in different species. The primary objective of the present study is to identify the similarities and differences in the metabolism of glyburide and to confirm the recent newly identified metabolites across the species. Results obtained from LC-UV and LC-MS/MS confirm the similarities and differences in the biotransformation of glyburide across the species. LC-UV-MS/MS data clearly suggests that the quantities of metabolites formed in all the species are dissimilar. Drug metabolite ratio is also different in all the species considered for tests. Mono-oxygenated metabolites and a metabolite due to the ring loss were identified in all the species. Similarities and differences in the metabolism of glyburide confirm the role of cytochrome P450 (CYP 45) enzymes and its distinct activity across the species.
Keywords
Metabolism; Liquid chromatography; Mass spectrometry; LC-DAD-Q-TRAP-MS/MS; Species comparison
Introduction
Identification of the metabolite is an important aspect in drug discovery and development. Identification of metabolites at the preclinical stage helps in optimizing the structure of the drug [1,2]. Food and Drug Administration guidelines imply the need to identify and quantify the structure of the metabolites [3]. Glyburide is a sulfonylurea urea drug used for the treatment of diabetes. Monohydroxylated metabolites are identified during in vitro incubation of glyburide with hepatic microsomes [4]. Recently, new metabolites such as the metabolite owing to loss of cyclohexyl ring [5], dihydroxylated metabolites, metabolite owing to hydroxylation and dehydrogenation were identified using LC-DAD-Q-TRAP-MS/MS [6]. New metabolites were identified during the incubation of glyburide with human liver microsomes. These new metabolites were detected in reasonable quantities and were detected while using DAD detector as well. New metabolites were confirmed using LC-DAD-Q-TRAP-MS/ MS. The objective of the present study is to compare the metabolism of glyburide in humans with that of other species such as rat, mouse, dog and monkey. DAD detector [7] has been utilized to obtain the drug to metabolite ratio.
Drug to metabolite ratio obtained from each species is compared with the drug to metabolite ratio obtained from human. Complying with the Food and Drug Administration guidelines, if the quantities of the formed metabolites are five percent with respect to the parent drug those metabolites have to be synthesized and be subjected to pharmacological and toxicological studies [3]. In this context, drug to metabolite ratio obtained from DAD chromatogram becomes vital. In addition to this, drug metabolite ratio obtained for different species will be helpful in choosing the animal models that could be used for performing pharmacology and toxicological studies. Generally, comparison of in vitro and in vivo studies of different animal species and their correlation analysis helps in projecting the human dose.
In order to understand the similarities and differences in drug metabolism studies, we have designed an experiment using glyburide as a model system. Glyburide was incubated with hepatic microsomes from human, mouse, rat, dog and monkey individually. Metabolites were identified and drug to metabolite ratio was used as a semiquantitative method to calculate the amount of metabolite formed with respect to the parent drug. This helps in comparing the amounts of metabolites formed in different species such as rat, mouse, dog, monkey and human.
Materials and Methods
Chemicals and supplies
Glyburide was purchased from Sigma-Aldrich Inc (St. Louis, MO, USA). All the other chemicals were also purchased from Sigma Chemical Co unless otherwise mentioned.
Liver microsomes
Pooled male human liver microsomes (Catalog no. 452615), pooled monkey liver microsomes (catalog no. 452403), pooled mouse liver microsomes (B6C3F1, catalog no. 452220), pooled rat liver microsomes (SD, catalog no. 452501), pooled dog liver microsomes (Beagle, catalog no. 452601) were purchased from BD gentest. NADPH (Cat # N1630, 95% pure), potassium phosphate dibasic (Cat # P2222, 99% pure), potassium phosphate monobasic (Cat # P5655, >99% pure), and DMSO (Cat # D5879, >99.5% pure) were purchased from Sigma, Germany. Activity of CYP enzymes was tested with positive controls 7-hydroxy coumarin and testosterone.
Metabolism of a drug by liver microsomes
The NADPH dependent metabolism of glyburide was studied in microsomal mixtures containing the following components at their respective final concentrations: glyburide, 15 μM; microsomal protein, 1 mg/ml; 0.1 M potassium phosphate (pH 7.4). After 5 minute pre incubation at 37°C in a shaking water bath, the reaction was initiated by the addition of 1 mM NADPH. The reaction was incubated for 30 min at 37°C and was terminated by the addition of ice cold acetonitrile. Samples were centrifuged at 15,000 g for 15 min at 5°C and the pellets were discarded. 50 μl was transferred to HPLC vials and subjected to analysis. Blank incubations were carried out with all the components except NADPH.
Instrument (LC-DAD-Q-TRAP-MS/MS) for drug metabolism studies
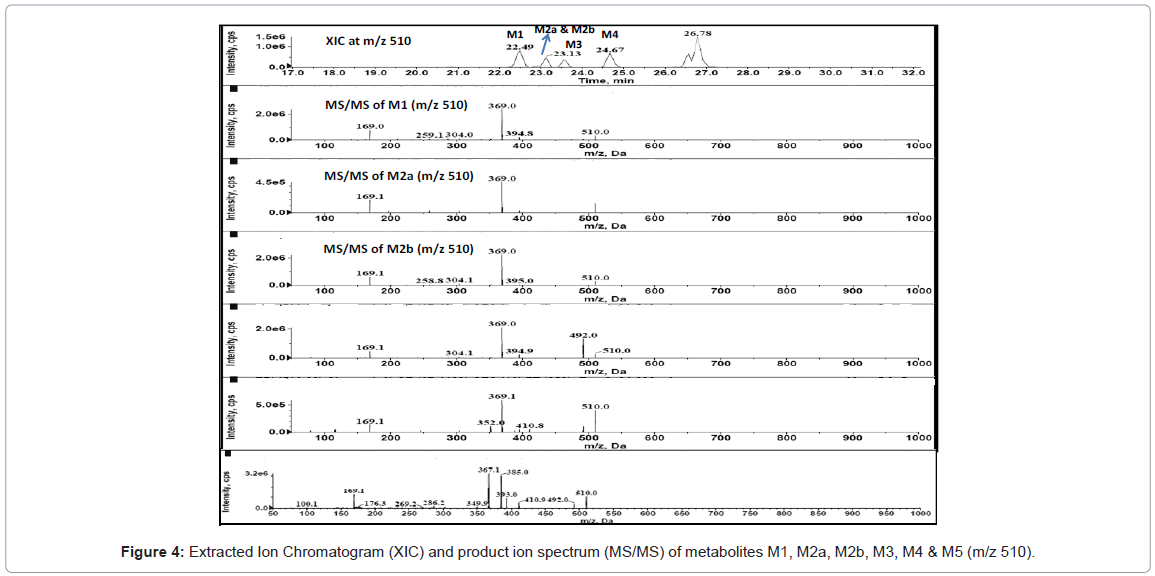
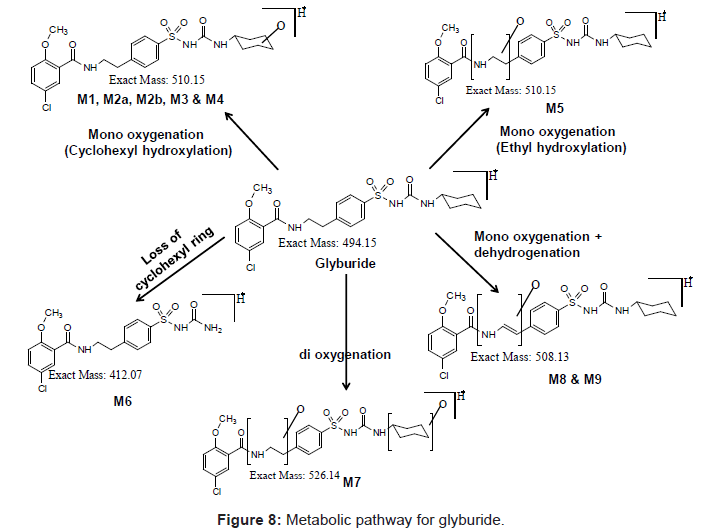
HPLC-MS/MS analysis for drug metabolism studies was performed with a Agilent 1200 series HPLC system consisting of a quaternary pump (model G1311A), a column oven (model G1316A), an auto sampler (model G1367B) and a diode array detector (DAD) (model G1316A) hyphenated with quadruple ion trap mass spectrometer (LC-DAD-Q-TRAP-MS/MS, AB Sciex, Canada). Analytical separation of glyburide and its metabolites was achieved using a reverse phase Zorbax 300 SB C18 150×4.5 mm, 5 μ analytical column. A variable flow gradient program was used to elute test compounds and its metabolites. A full scan mass analysis from m/z 100 to 1000 was done to detect the glyburide and its metabolites. Extracted ion current at m/z 510 is used to identify the hydroxylated metabolites of glyburide and extracted ion current at m/z 412 is utilized to identify the metabolite due to loss of cyclohexyl ring. Extracted ion current at m/z 526 and m/z 508 are utilized to confirm dihydroxylated metabolite and metabolite owing to hydroxylation and dehydrogenation. DAD chromatogram was utilized to quantify glyburide and metabolites.
Chromatographic conditions
Chromatographic separation of drug and metabolites was achieved using a Zorbax 300 SB C18 column (150×4.6 mm, 5 μ); the column temperature was maintained at 40°C. The mobile phase consisted of acetonitrile (solvent A) and water containing 0.1% formic acid (solvent B). The constant flow rate was set at 0.4 ml/min for the whole run time. Solvent delivery module in Agilent is utilized to produce the following gradient. The gradient elution is as follows: 5% solvent A for 2.5 min, followed by 5-90% solvent A in 21.5 min and held at 90% solvent A for another 2.5 min. Electrospray ionization source (ESI) serves as an interface and directs the solvent eluted from the HPLC in to the Q-Trap spectrometer.
Mass spectrometric conditions
The primary in vitro glyburide metabolites were identified using Q-TRAP-MS/MS (API4000 Q-TRAP-MS/MS, AB Sciex) with electro spray ionization (ESI) source operated in positive ion mode. Enhanced mass scan (EMS) and Enhanced product ion (EPI) scans were used to elucidate the structure of metabolites. The mass chromatograms (Extracted Ion Current at respective masses such as m/z 510, m/z 412 etc) obtained from EMS-EPI scans were helpful to confirm the corresponding peaks in the spectrum obtained from diode array detector (DAD). The LC/MS/MS parameters used are as follows, Curtain gas was set to 26 Psi and collisonally activated dissociation gas was set to medium. Ion spray voltage was 5400 V and Ion source temperature was 500°C. Nebulizer gas and turbo gas was 55 psi and 60 psi respectively. Decluster potential was 105 V, Collision energy for EMS scan was 9V and EPI scan was 36 V with a collision energy spread of 10.
Results
LC-DAD chromatogram for glyburide and its metabolites
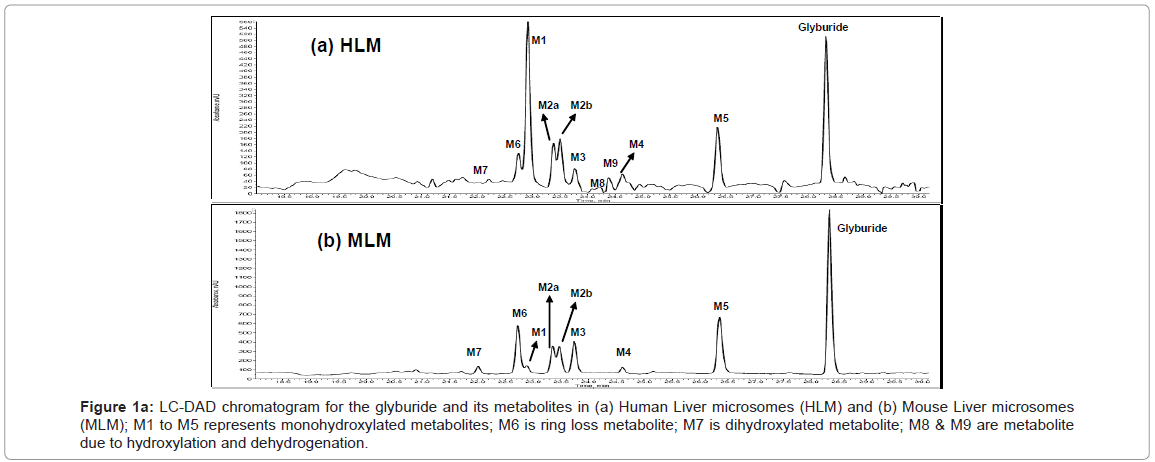
Figure 1 shows the LC-DAD chromatogram for human and mouse. Mono-oxygenated metabolites (M1, M2a, M2b, M3, M4 & M5), metabolite owing to loss of cyclohexyl ring (ring loss metabolite, M6), Dihydroxylated metabolite (M7) and metabolites due to hydroxylation and dehydrogenation (M8 & M9) were identified for human. All these metabolites were identified in our previous studies too [6]. Similar to human, metabolic turnover (formation of metabolites) for mouse is also high and metabolites M1, M2a, M2b, M3, M4, M5 and M6 were identified.
Figure 1a: LC-DAD chromatogram for the glyburide and its metabolites in (a) Human Liver microsomes (HLM) and (b) Mouse Liver microsomes (MLM); M1 to M5 represents monohydroxylated metabolites; M6 is ring loss metabolite; M7 is dihydroxylated metabolite; M8 & M9 are metabolite due to hydroxylation and dehydrogenation.
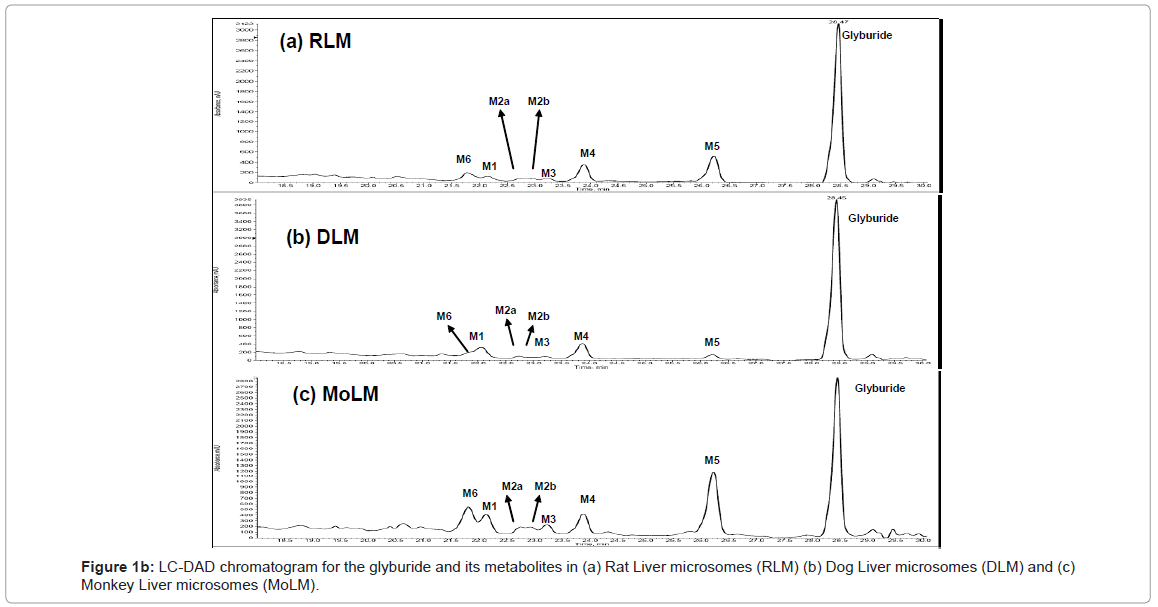
Figure 1b shows the LC-DAD chromatogram for rat, dog and monkey. Metabolites M1, M2a, M2b, M3, M4, M5 and M6 identified in human and mouse were also observed for rat, dog, mouse and monkey. Metabolites M7, M8 and M9 were absent in mouse, rat, dog and monkey. Although metabolites M1to M6 were identified in all the species, the quantities of these metabolites were different.
Mass chromatograms for glyburide and its metabolites
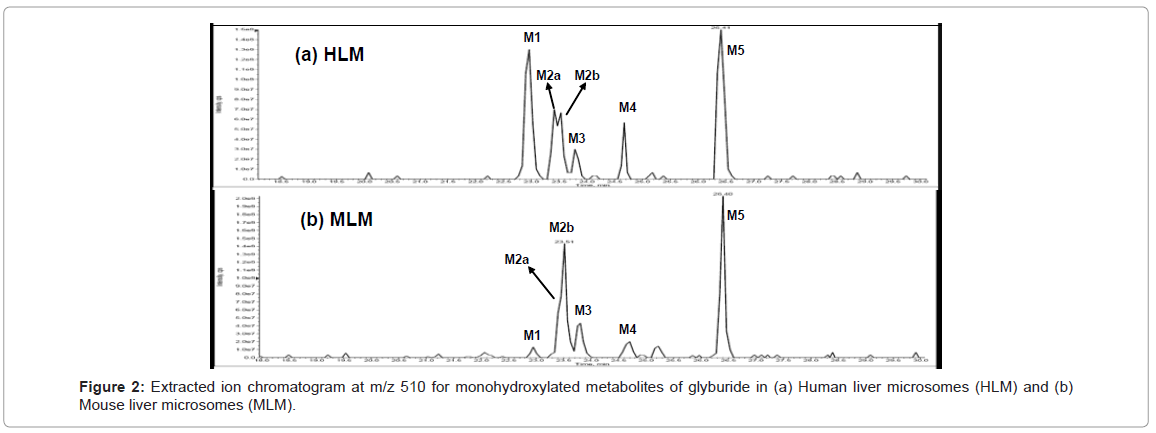
Extracted ion chromatogram at m/z 510 for human and mouse is shown in figure 2. Retention times of the metabolites identified in mass chromatogram is similar to the elution time in DAD chromatogram. Therefore, the mass chromatogram complements the results obtained from LC-DAD chromatogram. Metabolite due to monohydroxylation was observed in rat, dog and monkey similar to human and mouse.
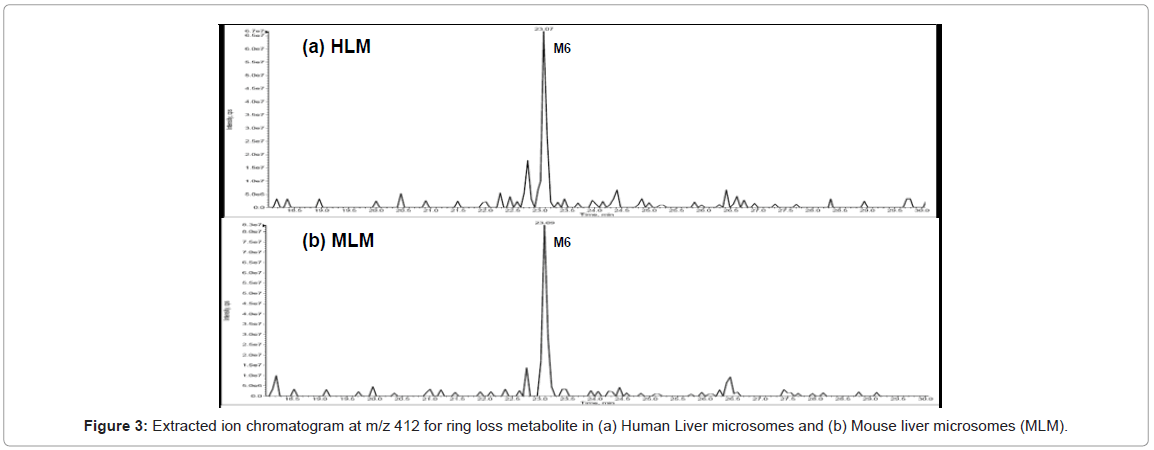
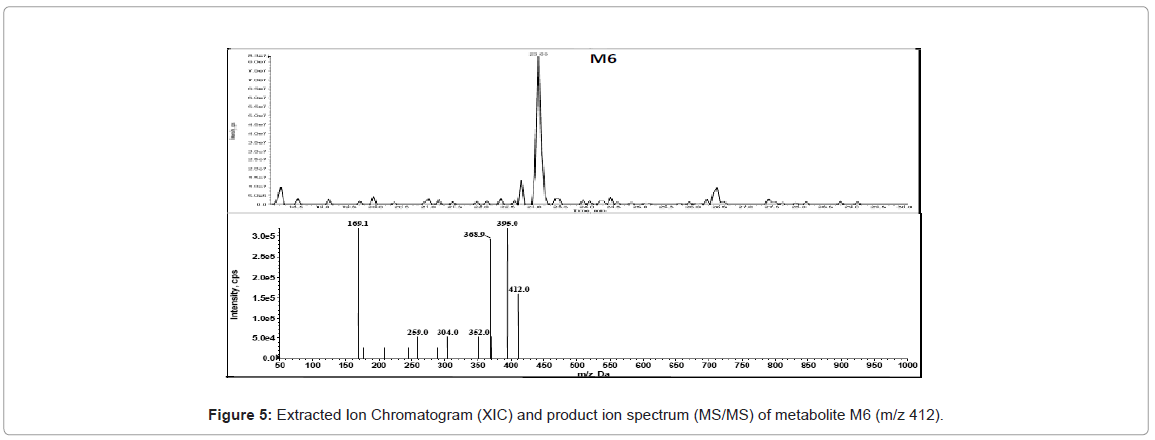
Metabolite owing to ring loss was also observed for all the species. Molecular mass of ring loss metabolite is 412 amu. Extracted ion current at m/z 412 for human and mouse is shown in figure 3. Identification of metabolites in mass spectrum confirms and complements the results obtained from the DAD chromatogram.
Intensities of the peaks detected in mass chromatograms are different from the intensities of the peaks observed in LC-DAD spectrum. This difference is due to the differences in the ionization efficiency of metabolites in the mass spectrum. DAD chromatograms are not influenced by the ionization efficiency of compounds and therefore are utilized to quantify the metabolites in the absence of synthetic standards.
Quantitation of glyburide and metabolites in human, mouse, rat, dog and monkey based on LC-DAD data
Glyburide upon incubation with human liver for 30 minutes resulted in cyclohexyl hydroxylated metabolites (M1, 27.6%; M2a, 6.67%; M2b, 7.59%; M3, 5.02% and M4, 3.84%) which are the predominantly formed metabolites followed by parent glyburide (26.92%), ethyl hydroxylated metabolite (M5, 12.14%), metabolite due to the loss of cyclohexyl ring (M6, 5.29%), Dihydroxylated metabolite (M7, 1.23%) and Metabolite owing to hydroxylation and dehydrogenation (M8, 0.91% and M9, 2.50%). The rank order for the metabolites formed for human liver micrsomes was M1>Glyburide>M5>M2b>M2a>M6>M3>M4>M9>M7>M8 (Figure 1a). Rank order was obtained with reference to glyburide in zero minute samples which was considered to be 100 percent (Table 1).
| Glyburide and its metabolites | HLM 30 min | MLM 30 min | RLM 30 min | DLM 30 min | MoLM 30 min |
|---|---|---|---|---|---|
| Glyburide | 26.92 | 57.02 | 67.95 | 75.94 | 56.64 |
| M1 | 27.62 | 2.32 | 3.21 | 8.96 | 5.26 |
| M2a | 6.67 | 4.23 | 1.72 | 1.17 | 2.33 |
| M2b | 7.59 | 3.74 | 1.69 | 1.12 | 2.21 |
| M3 | 5.02 | 5.10 | 1.99 | 1.50 | 3.02 |
| M4 | 3.84 | 1.12 | 6.54 | 7.89 | 5.08 |
| M5 | 12.14 | 14.01 | 11.82 | 3.36 | 19.05 |
| M6 | 5.29 | 10.04 | 4.77 | 1.72 | 5.95 |
| M7 | 1.23 | 1.51 | BDL | BDL | BDL |
| M8 | 0.91 | BDL | BDL | BDL | BDL |
| M9 | 2.50 | BDL | BDL | BDL | BDL |
BDL-Below the detection limit
HLM-Human Liver Microsomes
MLM-Mouse Liver Microsomes
RLM-Rat Liver Microsomes
DLM-Dog Liver Microsomes
MoLM-Monkey Liver Microsomes
Table 1: Percentage of metabolites identified after 30 min incubation of glyburide with liver micrsomes from human, mouse, rat, dog and monkey. Drug to metabolite ratio after 30 min is calculated by considering glyburide in zero minute samples as one hundred percent. Incubation and analysis was done in triplicate and the results are within the statistical error limit (P<0.05).
In mouse liver microsomes, parent glyburide was predominantly present (57.02%) followed by ethyl hydroxylated metabolite (M5, 15.01%), ring loss metabolite (M6, 10.24%), cyclohexyl hydroxylated metabolites (M3, 5.10%; M2a, 4.23%; M2b, 3.74% & M1, 2.32%), dihydroxylated metabolite (M7, 1.51%) and cyclohexyl hydroxylated metabolite (M4, 1.12%). Rank order for the metabolites formed for mouse liver microsomes was Glyburide>M5> M6>M3>M2a>M2b> M1>M7>M4 (Figure 1b).
In the case of rat liver microsomes parent glyburide (67.95%) was predominantly observed followed by ethyl hydroxylated metabolite (M5, 11.82%), cyclohexyl hydroxylated metabolite (M4, 6.54%), ring loss metabolite (M6, 4.77%) and cyclohexyl hydroxylated metabolites (M1, 3.21%; M3, 1.99%; M2a, 1.72%; & M2b, 1.69%). Hence the rank order for the metabolites formed for rat liver microsomes was Glyburide>M5>M4>M6>M1>M3>M2a>M2b (Figure 2a).
For the dog liver microsomes, parent glyburide (75.94%) was predominantly observed followed by cyclohexyl hydroxylated metabolite (M1, 8.96%; M4, 7.89%), ethyl hydroxylated metabolite (M5, 3.36%), ring loss metabolite (M6, 1.72%) and cyclohexyl hydroxylated metabolites (M3, 1.5%; M2a, 1.17% & M2b, 1.12%). Therefore the rank order for the metabolites formed for dog liver microsomes was Glybur ide>M1>M4>M5>M6>M1>M3>M2a>M2b (Figure 2b).
In the case of monkey liver microsomes, parent glyburide (56.64%) was predominantly observed followed by ethyl hydroxylated metabolite (M5, 19.05%), ring loss metabolite (M6, 5.95%), cyclohexyl hydroxylated metabolites (M1, 5.26%; M4, 5.08%; M3, 3.02%; M2a, 2.33% & M2b, 2.21%). Therefore the rank order for the metabolites formed for monkey liver microsomes was Glyburide>M5>M6>M1>M4>M3>M2a>M2b (Figure 2c).
Discussion
During the pre-clinical development of drugs, animal models are used to predict the metabolic pathway of drugs in human. Enzymes CYP 450’s (Cytochrome P450) play an important role in the metabolism and pharmacokinetics of drugs in both humans and animals. Humans differ from animals with respect to catalytic activity of CYP450 enzymes. Isoform composition and expression of enzymes also differ from humans to animals. Isoforms of CYP1A, CYP2C, CYP2D, CYP3A and CYP2E are responsible for metabolism of majority of the drugs in the market. All these enzymes are expressed in human, monkey, dog, rat and mouse. However there are differences in the primary amino acid sequences of the cytochrome P450s across the species resulting in different catalytic activity and drug specificity [8,9].
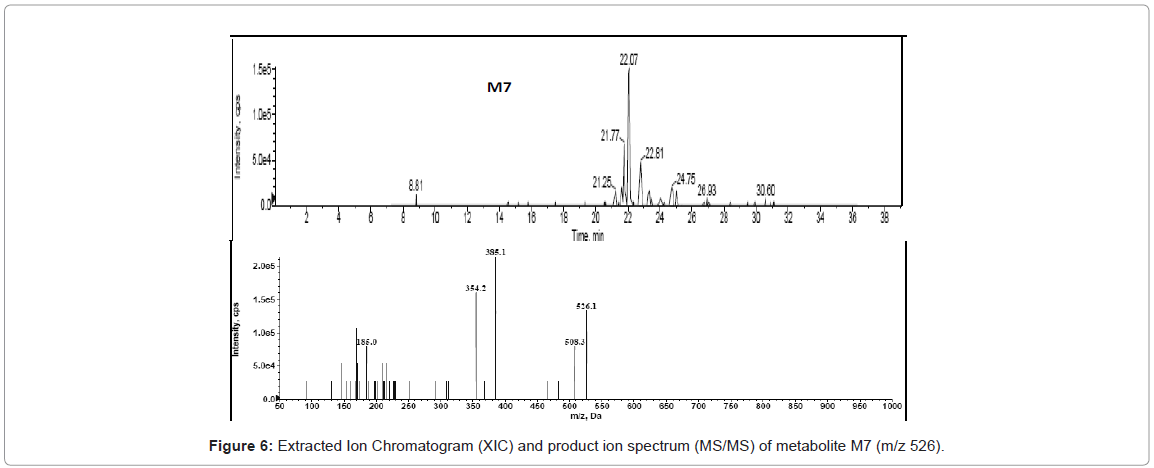
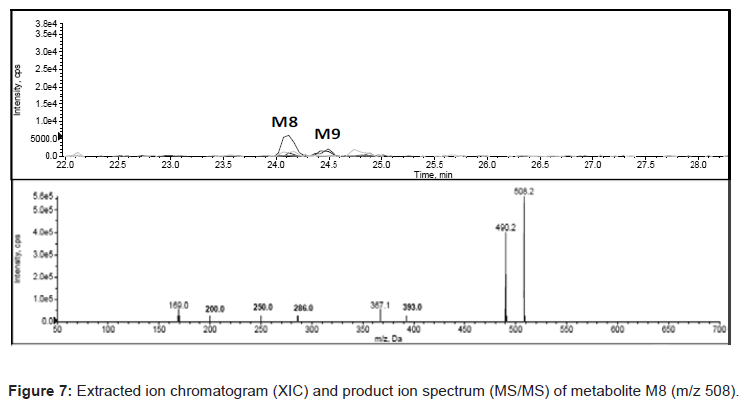
In the present study, Liquid Chromatography coupled with DAD detector coupled to Q-TRAP-MS/MS is utilized to analyze the formed metabolites (Figures 4-8) and its quantity. In our recent studies, we have identified the new metabolites of glyburide in human [5,6]. In the previous studies authentic standards of monohydroxylated metabolites were utilized to confirm the formed metabolites from hepatic and placental microsomes of human and baboon [4]. Various scan modes in mass spectrometry and the fragmentation pattern obtained from the mass spectrum was also used to confirm the formed metabolites [5,6]. In the present study glyburide was incubated with hepatic microsomes from various species such as mouse, rat, dog, monkey and the obtained results are compared with the human. Figures 4-7 shows the extracted ion chromatogram and corresponding product ion spectrum for molecular masses m/z 510 (mono-oxygenation), m/z 412 (loss of cyclohexyl ring), m/z 526 (di-oxygenation) and m/z 508 (mono oxygenation and dehydrogenation). The chromatograms (Figures 4-7) are obtained by incubation of glyburide with mouse liver microsomes. Detailed structural elucidation of these metabolites was carried out in the previous studies using human liver microsomes as a matrix [4-6]. Chromatograms obtained from the DAD detector is used to quantify the metabolites [7] formed in the system. Area o btained from the total ion chromatogram and extracted ion chromatograms from mass detector are influenced by the ionization efficiency of the drug and metabolites. Area obtained from the chromatogram of DAD detector which is not influenced by the ionizing efficiency of the compound is utilized to quantify the drug, metabolites from the drug metabolite ratio. Mass detector has been used to identify and confirm the structure of the metabolites (Figures 4-8) and DAD detector for quantifying the drug and metabolites present in the system.
Similarities in the metabolism of drug among different species
Sulfonylurea drug glyburide upon incubation with hepatic microsomes from human, monkey, dog, rat and mouse resulted in the formation of metabolites (Figures 1 and 2). In the case of human, mouse, rat, dog and monkey all the monohydroxylated metabolites (M1, M2a, M2b, M3, M4 and M5) were identified.
Similarly, metabolite due to ring loss (M6) was also identified in human, mouse, rat, dog and monkey. Therefore, monohydroxylated metabolites and metabolite due to ring loss are common in all the species. Both the monohydroxylated metabolites and metabolite due to ring loss are confirmed by DAD chromatogram and mass spectrometry.
In our recent studies, details of the identification of these metabolites are discussed in detail [6]. These similarities in the formation of monohydroxylated metabolites and metabolite due to ring loss in all the species suggests that major enzymes CYP1A, CYP2C, CYP2D, CYP3A and CYP2E could be involved in the metabolism of glyburide.
Differences in the metabolism of glyburide among different species
As discussed in the previous section, even though metabolites such as monohydroxylated metabolites and metabolite due to ring loss are identified in all the species their quantities are different across the species. Drug to metabolite ratio shown in the table 1 implies the important differences in the quantity of identified metabolites across the species.
Metabolite due to dihydroxylation was identified in quantifiable amount in both human and mouse (Figure 1) but not in rat, dog and monkey (Figure 2). Metabolite due to hydroxylation and dehydrogenation was not identified in mouse, rat, dog and monkey but this particular metabolite was identified only in human (Figure 8).
Species resembling human in the metabolism of the sulfonylurea drug glyburide
Similarities and differences in the metabolism of glyburide across the species confirm that mouse is more akin to human in terms of metabolite formation. Except metabolite due to hydroxylation and dehydrogenation all the other metabolites i.e. monohydroxylated metabolite, metabolite due to ring loss and dihydroxylated metabolites are identified both in human and mouse. Among the small animals (rodents) mouse is better than rat for conducting all the preclinical studies for this particular sulfonylurea drug glyburide. Among the larger animals all the monohydroxylated metabolites (M1-M5) and metabolite due to ring loss (M6) was identified in both monkey and dog. Monkey had more metabolic turnover (formation of metabolites) compared to dog (Figure 2) and could be a preferred species for conducting various pharmacological and toxicological studies.
Thus, from the above drug metabolism study by LC-DAD-Q-TRAP-MS/MS it is clear that a mouse which is a small animal and monkey as a larger animal could be the most appropriate species to conduct various biological studies for glyburide. Conducting necessary studies on these species will be very edifying and safe before subjecting the drugs for clinical trials on humans.
Conclusions
Glyburide is extensively metabolized in human liver microsomes where cyclohexyl hydroxylated metabolites are predominantly found with respect to the parent and the other metabolites. Results from LC-DAD detector and Q-TRAP-MS/MS complement each other and confirm the metabolite formation. Liquid chromatography with DAD detector coupled to Q-Trap-MS/MS has been utilized to obtain drug to metabolite ratio for human, mouse, rat, dog and monkey. DAD spectra were used to quantify the metabolites formed with respect to that of the parent. Drug to metabolite ratio confirms that mouse and monkey resembled the glyburide metabolism in human. Mouse could be an ideal rodent species and monkey would be a non-rodent species to perform pharmacological and toxicological studies for glyburide.
Acknowledgements
The authors thank Sai Life Sciences Limited, India for financial support and providing necessary facility to carry out this work successfully. We thank Dr. Hitesh Patel, Sai Life Sciences Limited, for valuable discussions and intellectual input.
References
- Ravindran S, Basu S, Surve P, Lonsane G, Sloka N (2012) Significance of Biotransformation in Drug Discovery and Development. J Biotechnol Biomaterial S13:005.
- Vangala S, Pinjari J, Patole P, Ravindran S, Gangal R, et al. (2012) Translational Drug Discovery Research: Integration of medicinal chemistry, computational modeling, pharmacology, ADME, and toxicology. Encyclopedia of Drug Metabolism and Interactions 1-54.
- U.S Department of Health and Human Services (2008) Guidance for industry, Safety testing of drug metabolites. Food and Drug Administration, Center for Drug Evaluation and Research 279-280.
- Ravindran S, Zharikova OL, Hill RA, Nanovskaya TN, Hankins GD, et al. (2006) Identification of glyburide metabolites formed by hepatic and placental microsomes of humans and baboons. Biochem Pharmacol 72: 1730-1737.
- Ravindran S, Honrao C, Sahu R, Basit A, Madireddy S, et al. (2011) Optimal use of mass spec scan modes to identify an unknown metabolite. Drug Invention Today 3: 259-261.
- Ravindran S, Basu S, Gorti SKK, Surve P, Sloka N (2012) Metabolic profile of glyburide in human liver microsomes using LC-DAD-Q-TRAP-MS/MS. Biomed Chromatogr.
- Ravindran S, Honrao C, Sahu R, Basu S, Basit A, et al. (2011) Determining quantity of metabolites without synthetic standards: An approach using LC-PDA-MS. International Journal of Chemical and Analytical Science 2: 1219-1221.
- Lang T, Klein K, Fischer J, Nüssler AK, Neuhaus P, et al. (2001) Extensive genetic polymorphism in the human CYP 2B6 gene with impact on expression and function in human liver. Pharmacogenetics 11: 399-415.
- Gotoh O (1992) Substrate recognition sites in cytochrome P450 family 2 (CYP2) proteins inferred from comparative analyses of amino acid and coding nucleotide sequence. J Biol Chem 267: 83-90.
Relevant Topics
Recommended Journals
Article Tools
Article Usage
- Total views: 17124
- [From(publication date):
April-2013 - Oct 13, 2025] - Breakdown by view type
- HTML page views : 12224
- PDF downloads : 4900

