Research Article Open Access
Development and Validation of a Simple Method for the Detection of Fascaplysin in Plasma
Kenneth H Swartz1, Frederick A Valeriote1, Joseph Media1, Tyler A Johnson2, Karen Tenney2, Phillip Crews2 and Jiajiu Shaw3*
1Department of Internal Medicine, Henry Ford Health System, Detroit, Michigan, USA
2Department of Chemistry and Biochemistry and Institute for Marine Sciences, University of California, Santa Cruz, California, USA
321st Century Therapeutics Inc., Ferndale, Michigan, USA
- *Corresponding Author:
- Jiajiu Shaw
21st Century Therapeutics Inc.
Ferndale, Michigan 48220, USA
Tel: 1-248-545-0595
Fax: 1-248-545-0595
E-mail: jiajiushaw@gmail.com
Received date: September 27, 2012; Accepted date: October 23, 2012; Published date: October 29, 2012
Citation: Swartz KH, Valeriote FA, Media J, Johnson TA, Tenney K, et al. (2012) Development and Validation of a Simple Method for the Detection of Fascaplysin in Plasma. J Anal Bioanal Tech 3:150. doi: 10.4172/2155-9872.1000150
Copyright: © 2012 Swartz KH, et al. This is an open-access article distributed under the terms of the Creative Commons Attribution License, which permits unrestricted use, distribution, and reproduction in any medium, provided the original author and source are credited.
Visit for more related articles at Journal of Analytical & Bioanalytical Techniques
Abstract
Fascaplysin is a cytotoxic natural product isolated from a variety of Indo-Pacific marine organisms, primarily Fascaplysinopsis sponges and Didemnum tunicates. Positive xenograft studies involving this alkaloid structural class have indicated that fascaplysin may serve as an important lead compound for preclinical development. This study was undertaken as a prelude to a full pharmacokinetics and therapeutic assessment of fascaplysin. We describe here a simple plasma preparation and a rapid HPLC method for the detection of fascaplysin in mice. The method was validated by parameters including good linear correlation, a limit of quantification of 107.1 μg/mL, and a good precision with a coefficient of variation of 0.92% for 10 μg/mL. This method provides excellent sensitivity and visualization of fascaplysin as a single peak allowing for rapid analysis of plasma samples involving absorption, distribution, and metabolism studies. A preliminary pharmacokinetics study in C57Bl/6 mice using 20.6 mg/kg fascaplysin yielded a biphasic curve with T½α=16.7 min, T½β=11.7 h, and C0 of 17.1 μg/mL.
Keywords
Fascaplysin; HPLC analysis; Plasma samples; Pharmacokinetics
Introduction
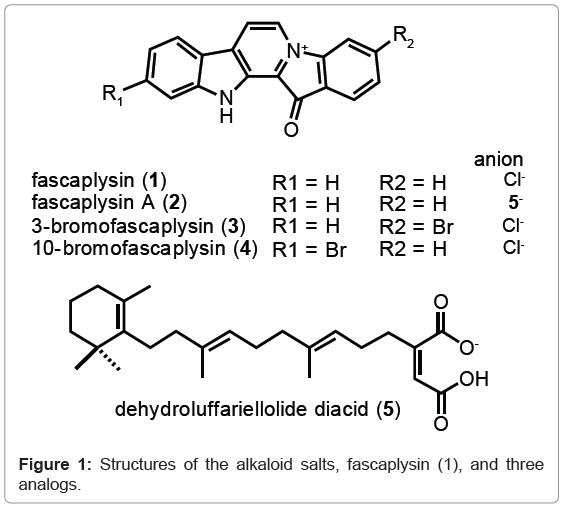
Fascaplysin (1), a pigment first reported in 1988 from the marine sponge Fascaplysinopsis [1], is the parent compound of a uniquely marine-derived structural class (Figure 1). Most members of this family possess a framework consisting of a planar, fused-pentacyclic alkaloid often as a quaternary salt. To date 27 analogs of fascaplysin (1) have been reported [2-9] and several studies have described a broad range of bioactivity properties for this class including antiangiogenesis [10], antibacterial [1], antimalarial [11] and cytotoxicity against various cancer cell lines [1-3,6,9]. A few specific targets for these biological activities have been defined, including DNA binding (possibly intercalation) [12] as well as inhibition of Cdk4 kinase [13], the latter leading to G1 phase arrest and apoptosis [14]. Our interest in the fascaplysin family is a consequence of their in vitro solid tumor selectivity, which we have noted for the parent compound 1 and analogs such as 3- and 10-bromo fascaplysin, compounds 3 and 4 respectively, as well as fascaplysin A (2) [2,3]. Our recent studies using fascaplysin A (2) demonstrated its in vivo therapeutic efficacy in a xenograft model [15]; thereby making this class of compounds ideal candidates for further preclinical development and eventual clinical trials.
The natural history associated with the occurrence of fascaplysin (1) is somewhat unusual. It has been isolated from four different Indo- Pacific sponge species, all belonging to the Thorectidae, including Fascaplysinopsis reticulata, F. sp., Hyrtios cf. erecta, and a partially classified Thorectandra. Analogs have also been isolated from two distinct Didemnum tunicates [2]. The circumstance of this compound being observed from multiple marine invertebrates in different marine phyla is noteworthy and currently remains unexplained though parallel biosynthetic machinery obviously exists in these biosynthetically disparate taxa. Coincidentally, the isolated yields of fascaplysin analogs reported from sponges and tunicates are high, suggesting that the biosynthetic enzymes are robustly independent of invertebrate phyla or taxonomic species [3]. The circumstance of having multiple natural sources for a variety of fascaplysins greatly facilitates the next steps in the pre-clinical evaluation of this class. Alternatively, these compounds are also available from total synthesis [16-22], which if warranted could be used to supply material for therapeutic evaluations. At this juncture, the next step in the therapeutic evaluation of the fascaplysin class consists of a rigorous pharmacokinetics assessment followed by careful in vivo bioactivity studies. We describe below a validated method to determine fascaplysin (1) concentration and stability in mouse plasma. The process consists of a simple extraction of plasma samples followed by isocratic HPLC analysis with UV detection of 1.
Materials and Methods
Instruments
A Waters Alliance HPLC system [including a Waters 2690 Separations Module, a Waters 2996 Photodiode Array Detector, a Waters Symmetry Shield RP 18 reversed-phase column (3.9×150 mm, 10 μm), and the Waters Empower software] (Milford, Massachusetts, USA), was used in this study for the determination of fascaplysin (1) in mouse plasma. A Beckman Coulter Allegra 21R Centrifuge (Fullerton, California, USA) was used to prepare the plasma and red blood cell samples for HPLC injection.
Reagents
Fascaplysin (1) (HPLC peak purity >99%) was isolated as previously described [3]. All solvents were HPLC grade and obtained from Burdick & Jackson (Muskegon, Michigan, USA).
Preparation of Plasma and Red Blood Cell (RBC) Samples
Mouse blood samples were collected by cardiac puncture using a 1mL syringe (with a 25-gauge needle) containing heparin as anticoagulant. Once the maximum amount of blood was collected, it was transferred to a 1.5 mL conical centrifuge tube and centrifuged at 14,000 rpm (equivalent to 19,000 g) at 4°C for 15 min to separate plasma and RBC. Plasma and RBC were separately transferred and stored in a freezer at -20°C. To prepare individual spiked standards, 20 μL of fascaplysin stock solutions in water were added to 230 μL of plasma samples, 500 μL of methanol was added to each, inverted and vortexed for 1 min, and centrifuged at 19,000 g at 4°C for 30 min. The supernatant was added to 2.0 ml of water and the mixture was passed through a Sep-Pak® Vac 1 cc (100 mg) C8 cartridge. Fascaplysin (1) was eluted with 1.0 mL of methanol and evaporated to dryness using an Eppendorf Vacufuge® at 45°C. 100 μL of mobile phase buffer was added to each sample. The same procedure was used to prepare RBC samples for HPLC analysis.
HPLC procedure
Fascaplysin (1) in the eluted fraction was determined using a Waters SymmetryShield RP18 reversed-phase column (3.9×150 mm) with a 5 μm particle size. The injection volume was 70 μL. The column oven was room temperature. The mobile phase was phosphoric acid/methanol/water (1/20/79 v/v/v) at a flow rate of 1.0 mL/min. Detection was done at 302 nm. The results of the analysis are expressed in nanograms of fascaplysin (1) per mL of plasma.
Calibration curve
A stock solution of 20 μg/mL of fascaplysin (1) was prepared in water. The calibration curve was obtained with mouse plasma spiked with known amounts of the stock solution. The analyte was extracted according to the protocol described above. The calibration curve was obtained by plotting the peak area of fascaplysin (1) against its concentration in 7 spiked plasma standards (20, 10, 1, 0.5, 0.25, 0.1, and 0.05 μg/ml) and performing a linear regression analysis.
Pharmacokinetics study
Fascaplysin (1) was administered i.v. to C57Bl/6 female mice at 20.6 mg/kg in a volume of 0.25 mL saline, containing 5% DMSO and 5% Cremophor/Propylene glycol (60/40, v/v); two animals per time point were sacrificed at 5 min., 0.5, 1, 2, 4, and 24 hr after drug administration. Blood samples were collected and analyzed as described above. Animal treatment was in full accordance with the Institutional Animal Care and Use Committee (IACUC) Guidelines for the care and management of laboratory animals.
Results and Discussion
The data gathered allows detection of fascaplysin (1) over a wide range of concentrations. The method developed here was validated according to the U.S. Pharmacopoeia [23] and the analytical performance parameters considered were selectivity, linearity, accuracy, precision, sensitivity, ruggedness, and peak symmetry [24].
Somewhat similar to a past study [25], seven parameters are used to validate the method and the analytical details are as follows:
Selectivity
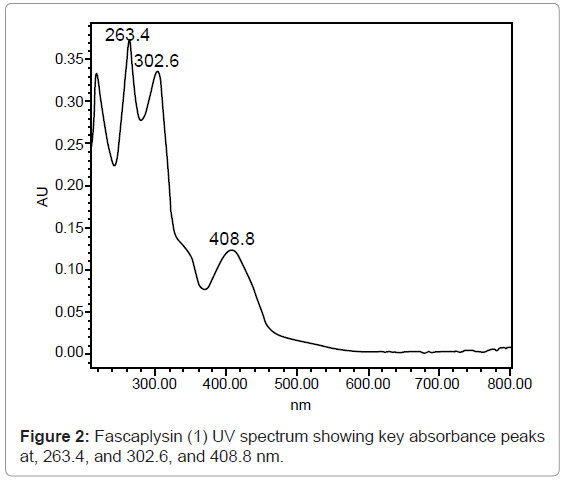
The absorption spectrum for fascaplysin (1) (Figure 2) demonstrated the potential wavelength for quantitative analysis: 263.4, 302.6, and 408.8 nm. In all further studies, 302 nm was chosen. A typical chromatogram at 302 nm (Figure 3) for spiked plasma indicated that fascaplysin (1) was well-resolved and free from interference peaks. The use of a UV photodiode array detector allowed the confirmation of the identity of the chromatographic peak for fascaplysin (1) both by its retention time and UV spectrum.
Linearity
Calibration curves of fascaplysin (1) were prepared to determine the linearity of the method over the range of 50-20,000 ng/mL. Integrated peak areas were plotted against analyte concentration, and linear regression was performed by the least-squares method. The calibration curve generated using plasma as matrix showed a square of correlation coefficient of 0.998 (Figure 4).
Accuracy
The accuracy of the analytical method was determined by application of the method to analytes of known concentrations. Three spiked plasma samples (0.25, 10 and 20 μg/ml were prepared in triplicate and analyzed. The assay results were 0.253, 9.82, and 20.01 ng/mL, indicating a recovery of 100.4%, 98.2%, and 101.2%, respectively for these samples. Therefore, the method is accurate (Table 1).
| Fascaplysin (μg/ml) | Average Peak Area | Average Computed Concentration | Average % Recovery |
|---|---|---|---|
| 0.25 | 1023 | 0.253 | 100.4 |
| 10 | 50725 | 9.82 | 98.2 |
| 20 | 104033 | 20.01 | 101.2 |
Table 1: Average peak areas of three fascaplysin (1) standard concentrations and percent recoveries (n=3).
Precision
The precision of the analytical method was determined by analyzing a plasma sample spiked with 10 μg/ml of fascaplysin (1) injected ten times. Peak areas were considered for the determination. The precision, expressed as the percent coefficient of variation (CV), was 0.92% indicating that the method is precise (Table 2) [26].
| Peak Area 10 μg/ml |
| 122845 |
| 122699 |
| 124585 |
| 122793 |
| 126075 |
| 123619 |
| 124075 |
| 125807 |
| 124243 |
| 124777 |
| Average=124151.8 |
| SD=1139.3 |
| CV=0.92% |
Table 2: Replicate precision in the peak area determinations for 10 μg/ml fascaplysin (1) concentration.
Sensitivity
The limit of detection (LOD) and the limit of quantification (LOQ) were obtained by running six replicates of each standard for a full standard curve. A linear regression was performed on each standard curve and the standard deviation of the y-intercepts was computed. The LOD was computed by multiplying the standard deviation by 3.3, adding that number to the average y-intercept value and dividing by the average slope. Similarly, the LOQ was computed by multiplying the standard deviation by 10, adding that number to the average y-intercept value and dividing by the average slope (Table 5). The LOD for this method is 0.019 μg/ml and the LOQ is 0.92 μg/ml.
Ruggedness
Ruggedness was shown by assaying 3 replicates of spiked plasma samples using 3 fascaplysin (1) concentrations on two consecutive days employing the corresponding linearity curve generated on the day the sample was assayed. As shown in (Table 3), intra- and inter-day assay results of a particular sample are essentially the same, indicating an acceptable ruggedness of the method for intra- and inter-day assay studies. In addition, three spiked samples (100, 250, and 500 ng/mL) were analyzed using slightly modified flow rates. As shown in (Table 4), when the flow rate was reduced or increased to 0.9 or 1.1 mL/min, respectively, as compared to the normal 1mL/min. The assay results showed CV values of 2.1%, 2.0%, and 0.6%, further indicating that the present method is rugged with respect to minor changes of the flow rate.
| Fascaplysin Concentration (µg/ml) | Peak Area | Average | S.D. | CV (%) | ||
|---|---|---|---|---|---|---|
| Day 1 | Replicate 1 | Replicate 2 | Replicate 3 | |||
| 20 | 100171 | 108079 | 104033 | 104094 | 3954 | 3.80 |
| 10 | 49472 | 50855 | 51848 | 50725 | 1193 | 2.35 |
| 0.25 | 1052 | 997 | 1020 | 1023 | 27.6 | 2.70 |
| Day 2 | ||||||
| 20 | 103266 | 99336 | 102708 | 101770 | 2126 | 2.08 |
| 10 | 50027 | 49735 | 50486 | 50083 | 379 | 0.76 |
| 0.25 | 1011 | 997 | 1022 | 1010 | 12.5 | 1.24 |
Table 3: Assay of a fascaplysin (1) standard sample over a period of 2 days.
| Effect Flow Rate Variation on Assay (ng/mL) | ||||
|---|---|---|---|---|
| Flow Rate (mL/min) | Change Level | 100 ng/mL | 250 ng/mL | 500 ng/mL |
| 0.9 | -0.1 | 101 | 243 | 501 |
| 1.0 | 0 | 98 | 249 | 505 |
| 1.1 | +0.1 | 97 | 253 | 499 |
| Avg ± SD | 99 ± 2.08 | 258 ± 5.03 | 501 ± 3.06 | |
| CV (%) | 2.1 | 2.0 | 0.6 | |
Table 4: Assay results of three samples with known concentrations under different flow rates.
| Curve | Slope | y-intercept | |
|---|---|---|---|
| 1 | 16013 | 6330 | |
| 2 | 15581 | 4712 | |
| 3 | 15730 | 6325 | |
| 4 | 16089 | 4334 | |
| 5 | 16322 | 4958 | |
| Avg. | 15947 | 5332 | |
| SD | 936 | ||
| SD * 3.3 | 3088 | LOD=0.53 | |
| SD * 10 | 9357 | LOQ=0.92 |
Table 5: Slopes and y-intercepts of five standard curves used to compute the LOD and LOQ.
Peak symmetry
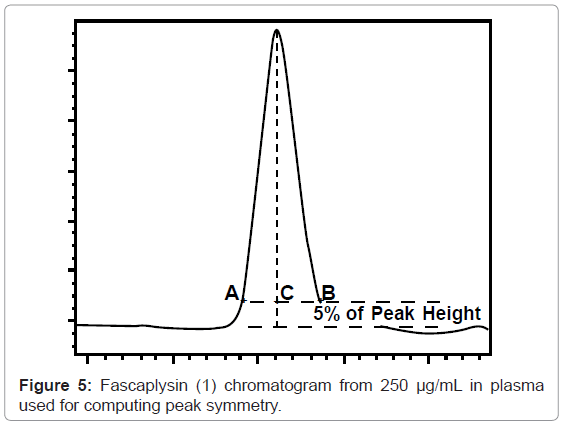
Tailing factor is defined as the distance from the front slope of the peak to the back slope (AB) divided by twice the distance from the center line of the peak to the front slope (2AC), with all measurements made at 5% of the maximum peak height [23] (Figure 5). The tailing factor computed for the fascaplysin peak (250 μg/mL) equals 1.08 indicating that the peak symmetry is good.
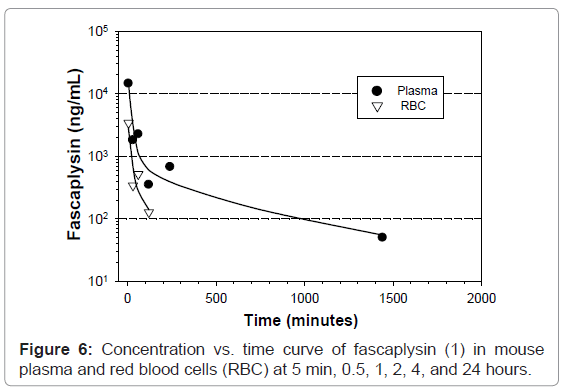
A preliminary PK assessment was carried out in C57Bl/6 mice injected i.v. with 20.6 mg/kg (0.4 mg/mouse) of 1. The results are shown in (Figure 6), where the plasma level at 5 min was 14,533 ng/mL, decreasing to 1809 ng/mL at 30 min, 351 ng/mL at 2 hr and then 50 ng/mL at 24 hr. The T½α (17min) was calculated between 5 min and 30 min; T½β (11.7 hr) was calculated between 60 min and 1440 min); C0 was 17.1 μg/mL. Fascaplysin (1) levels in red blood cells (RBC) were also analyzed; 3.4 μg/mL at 5min decreasing to 127 ng/mL at 2 hr; after 2 hr, the RBC concentration of fascaplysin (1) was not detectable.
In summary, we have shown that each of the seven parameters discussed above provide a good basis for further biological evaluation of fascaplysin (1). The method described herein is suitable for analyzing plasma samples of fascaplysin (1). We have successfully developed a simple method to determine fascaplysin (1) in plasma, and present for the first time the absorption values of this compound in mouse blood from 5 min to 24 hr. Until now, no data have been published concerning absorption, bioavailability, and tissue distribution of fascaplysin (1). Future studies will evaluate both the pharmacokinetics and therapeutic efficacy of fascaplysin (1) in tumor-bearing mice.
Acknowledgements
This work was supported by grant NIH RO1-CA47135.
References
- Roll DM, Ireland CM, Lu HSM, Clardy J (1988) Fascaplysin, an unusual antimicrobial pigment from the marine sponge Fascaplysinopsis sp. J Org Chem 53: 3276-3278.
- Segraves NL, Lopez S, Johnson TA, Said SA, Fu X, et al. (2003) Structures and cytotoxicities of fascaplysin and related alkaloids from two marine phyla-Fascaplysinopsis sponges and Didemnum tunicates. Tetrahedron Lett 44: 3471-3475.
- Segraves NL, Robinson SJ, Garcia D, Said SA, Fu X, et al. (2004) Comparison of fascaplysin and related alkaloids: a study of structures, cytotoxicities, and sources. J Nat Prod 67: 783-792.
- Lu Z, Ding Y, Li XC, Djigbenou DR, Grimberg BT, et al. (2011) 3-bromohomofascaplysin A, a fascaplysin analogue from a Fijan Didemnum sp. Ascidian. Bioorg Med Chem 19: 6604-6607.
- Kamel HS, Ferreira D, Gracia-Fernandez LF, Slattery M (2007) Cytotoxic Diterpenoids from the Hybrid Soft Coral Sinularia maxima × Sinularia polydactyla. J Nat Prod 70: 1223-1227.
- Charan RD, McKee TC, Gustafson KR, Pannell LK, Boyd MR (2002) Thorectandramine, a Novel beta-Carboline Alkaloid from the Marine Sponge Thorectandra sp. Tetrahedron Lett 43: 5201-5204.
- Jimenez C, Quinoa E, Adamczeski M, Hunter LM, Crews P (1991) Novel sponge-derived amino acids. 12. Tryptophan-derived pigments and accompanying sesterterpenes from Fascaplysinopsis reticulate. J Org Chem 56: 3403-3410.
- Jimenez C, Quinoa E, Crews P (1991) Novel marine sponge alkaloids 3. ß-carbolinium salts from Fascaplysinopsis reticulate. Tetrahedron Lett 32:1843-1846.
- Charan RD, McKee TC, Boyd MR (2004) Cytotoxic alkaloids from the marine sponge Thorectandra sp. Nat Prod Res 18: 225-229.
- Jing L, Yan XJ, Chen HM (2007) Fascaplysin, a selective CDK4 inhibitor, exhibit anti-angiogenic activity in vitro and in vivo. Cancer Chem Pharmacol 59: 439-445.
- Kirsch G, Köng GM, Wright AD, Kaminsky R (2000) A new bioactive sesterterpene and antiplasmodial alkaloids from the marine sponge hyrtios cf. erecta. J Nat Prod 63: 825-829.
- Hormann A, Chaudhuri B, Fretz H (2001) DNA binding properties of the marine sponge pigment fascaplysin. Bioorg Med Chem 9: 917-921.
- Soni R, Muller L, Furet P, Schoepfer J, Stephan C, et al. (2000) Inhibition of cyclin-dependent kinase 4 (Cdk4) by fascaplysin, a marine natural product. Biochem Biophys Res Comm 275: 877-884.
- Zheng YL, Lu XL, Lin J, Chen HM, Yan XJ, et al. (2010) Biomed Pharmacother 64: 527-533.
- Subramanian B, Nakeff A, Tenney K, Crews P, Gunatilaka L, et al. (2006) A new paradigm for the development of anticancer agents from natural products. J Exp Therap Oncol 5: 195-204.
- Waldmann H, Eberhardt L, Wittstein K, Kumar K (2010) Silver catalyzed cascade synthesis of alkaloid ring systems: concise total synthesis of fascaplysin, homofascaplysin C and analogues. Chem Commun (Camb) 46: 4622-4624.
- Zhidkov ME, Baranova OV, Kravchenko NS, Dubovistkii SV (2010) A new method for the synthesis of the marine alkaloid fascaplysin. Tetrahedron Lett 51: 6498-6499.
- Garcia MD, Wilson AJ, Emmerson DP, Jenkins PR, Mahale S, et al. (2006) Synthesis, crystal structure and biological activity of beta-carboline based selective CDK4-cyclin D1 inhibitors. Org Biomol Chem 4: 4478-4484.
- Radchenko OS, Novikov VL, Elyakov GB (1997) ChemInform Abstract: A Simple and Practical Approach to the Synthesis of the Marine Sponge Pigment Fascaplysin and Related Compounds. Cheminform 28: 5339-5342.
- Molina P, Fresneda, PM, Garcia-zafra S, Almendros P (1994) ChemInform Abstract: Iminophosphorane-Mediated Syntheses of the Fascaplysin Alkaloid of Marine Origin and Nitramarine. Cheminform 26: 8851-8854.
- Rocca P, Marsais F, Godard A, Quenguiener G (1994) ChemInform Abstract: A Short Synthesis of the Antimicrobial Marine Sponge Pigment Fascaplysin. Cheminform 25: 7917-7918.
- Gribble GW, Pelcman B (1992) Total syntheses of the marine sponge pigments fascaplysin and homofascaplysin B and C. J Org Chem 57: 3636-3642.
- U.S. Pharmacopoeial Convention (2000) USP-NF.
- Rambla-Alegre M, Esteve-Romero J, Carda-Broch S (2012) Is it really necessary to validate an analytical method or not? That is the question. J Chromatogr A 1232: 101-109.
- Shaw J, Valeriote FA, Media J,Johnson TA, Amagata T, et al. (2010) Development and validation of a rapid method for the detection of latrunculol A in plasma. Anal Bioanal Chem 396: 1741-1744.
- U.S. Department of Health and Human Services Food and Drug Administration (2000) Guidance for Industry, Analytical Procedures and Methods Validation, Chemistry, Manufacturing, and Controls Documentation. U.S. Department of Health and Human Services, Food and Drug Administration, Center for Drug Evaluation and Research (CDER), Center for Biologics Evaluation and Research (CBER).
Relevant Topics
Recommended Journals
Article Tools
Article Usage
- Total views: 14116
- [From(publication date):
November-2012 - Apr 07, 2025] - Breakdown by view type
- HTML page views : 9514
- PDF downloads : 4602


