Research Article Open Access
Determination of Tacrolimus in Rat Whole Blood Utilizing Triple Quadrupole LC/MS
A. R. Suresh Babu*, B. Thippeswamy and A. B. VinodA.R.Suresh Babu, Department of Bioanalytical, G7Synergon Pvt Ltd, No537, 9th cross, 5th main, Tatanagar, Sahakaranagar post, Bangalore-560092, India
- *Corresponding Author:
- Dr. A.R.Suresh Babu
Department of Bioanalytical
G7Synergon Pvt Ltd,
No537, 9th cross, 5th main, Tatanagar
Sahakaranagar post, Bangalore-560092, India
Tel: +91 080-22172700
E-mail: arsureshbabu@rediffmail.com ,sureshbabu.ar@g7synergon.in
Received date: January 31, 2011; Accepted date: March 26, 2011; Published date: March 30, 2011
Citation: Babu ARS, Thippeswamy B, Vinod AB (2011) Determination of Tacrolimus in Rat Whole Blood Utilizing Triple Quadrupole LC/MS. J Anal Bioanal Tech 2:118. doi: 10.4172/2155-9872.1000118
Copyright: © 2011 Babu ARS, et al. This is an open-access article distributed under the terms of the Creative Commons Attribution License, which permits unrestricted use, distribution, and reproduction in any medium, provided the original author and source are credited.
Visit for more related articles at Journal of Analytical & Bioanalytical Techniques
Abstract
A simple, sensitive and rapid method was developed for quantitation of tacrolimus in rat whole blood utilizing triple Quadrupole LC/MS. An aliquot of 0.1 mL of whole blood sample was extracted with t-butyl methyl ether using a Heidolph vortexer. The chromatographic separation was performed by using chromolith fast gradient HPLC RP 18e (2mmX50mm.i.d) column with a mobile phase of 90% methanol and 10% 2mM ammonium acetate buffer followed by MS/MS detection. The analyte was quantitated in negative ionization mode. Multiple reaction monitoring (MRM) using the transition m/z 802.4→560.2 and m/z 808.4→548.6 was performed to quantify tacrolimus with IS (pimecrolimus), respectively. The method had a total chromatographic run time of 2.5 min; and linear calibration curves over the concentration range of 20.931 -1000.703 ng/mL.The lower limit of quantification (LLOQ) was 20.931 ng/mL. Use of sodium citrate (3.85%) as an anticoagulant in rat whole blood and samples were stable for at least the time required to assay the number of samples that could be placed in the auto sampler which is maintaining temperature of 10°C. The between and within batch precision and accuracy of the method were determined by using 6 quality control samples. The highest %CV 478.908 ng/mL (8.01% within run & 3.07 between run), with other %CV<5%. The recovery ranged 23.92% for tacrolimus over range of 50.285 to 798.179 ng/mL and was 18.52% for pimecrolimus respectively. The validated method was successfully applied to the quantification of tacrolimus concentration in rat whole blood.
Keywords
Tacrolimus; Rat whole blood; Triple quadrupole LCMS; Pimecrolimus; Sodium citrate
Introduction
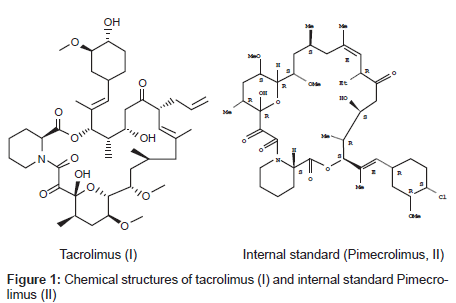
Tacrolimus is an immunosuppressive agent (Figure 1) isolated from streptomycin tsukubaensis [1]. It is a macrolide lactone with a hemiketal masked α, β-di-ketoamide and a molecular mass of 803.5 Da [2]. It is the basis of immunosuppressive drug regimens after liver & kidney transplantation & it has also been used for heart, pancreas, bone marrow, small bowel, lung transplant & for the treatment of T-cell mediated autoimmune diseases such as allergic encephalomyelitis [1,3]. Therapeutic drug monitoring is recommended for monitoring trough blood/plasma tacrolimus levels as an aid in adjusting the dose to prevent rejection with toxicity. Two commercially available assays are used to monitor tacrolimus levels, especially in whole blood. Abbott 1Mx® & PRO-TRAC™ by incstar [4-6]. In general, clearance and volume of distribution are higher when calculated using plasma drug concentrations than when whole blood is used. This is because drug concentrations are significantly higher in the whole blood as results of extensive drug binding to erythrocytes in patients with transplants [7]. Whole blood is recommended medium than plasma for assessing the pharmacokinetics of tacrolimus[8].The average bioavailability of tacrolimus was reported to be approximately 20-25% in healthy human subjects [9-10]. Tacrolimus is a potent substrate of cytochrome P450 and CYP3A4 enzymes efficiently metabolize tacrolimus in the small intestine as well as in the liver [11,12]. Many studies have suggested that tacrolimus is a potent substrate of P-glycoprotein (P-gp) and that an active secretory transport mediated by intestinal P-gp is largely responsible for the low oral bioavailability of tacrolimus [13-17].
A survey of the literature indicates that immunoassays often lack specificity, especially for drugs which are extensively metabolized, the cross-reactivity affecting some immunoassays more than others [18-21]. For tacrolimus and cyclosporine the cross-reactivity of the metabolites causes a very significant (up to 60%) and unpredictable overestimation of the concentrations [20-23]. Assay techniques that provide specific tacrolimus concentration measurement with greater sensitivity, such as liquid chromatography-tandem mass spectrometry (LC-MS/ MS) are now widely employed [24-28].
In recent years, a number of laboratories have reported for the use of high throughput bioanalytical procedures using LC-MS-MS. So our method is simple, rapid, sensitive, specific, robust and novel that makes it an attractive procedure in high throughput.
Experimental
Reagents
The pure substances of tacrolimus with pimecrolimus (internal standard; IS) were obtained from Biocon India. Chemical structures are presented in (Figure 1) Stock solutions of tacrolimus (1 mg/mL) & IS (1 mg/mL) were separately prepared in 5mL volumetric flasks with methanol. HPLC grade methanol from JT Baker, t-butyl methyl ether & ammonium acetate were from Merck (Worli Mumbai India), HPLC type 1 water from milli Q system (Millipore, Bedford. MA USA) was used and blank rat whole blood from healthy albino Wistar rats was obtained from blood service centre of Bioneeds, Bangalore (India).
Apparatus / instrumentation
Chromatographic analysis was performed using an Agilent 1200 Series LC System (Agilent technologies, INC; VBA) equipped with G1312B Binary pump, G1315C UV detector, G1316B thermostatic column compartment, G1329B auto sampler equipped with a G1330B thermostat. Mass spectrometric detection was performed in Triple Quadrupole LCMS 6410 instrument with Agilent technologies USA using MRM. A turbo electrospray interface in negative ionization mode was used. Mass data acquisitions with integration were controlled by Agilent mass hunter chemstation (B.01.03) software.
LC-MS/MS conditions
Chromatography was performed on Chromolith Fast Gradient RP 18e HPLC Column (2x50mm), maintained at 40°C. The mobile phase composition was 2mM ammonium acetate buffer: methanol 10:90 v/v (Binary Flow) which was pumped at flow-rate of 0.2 mL/min without splitter. The auto sampler temperature was set at 10°C. The main working parameters of the mass spectrometer are summarized in Table 1.
| Parameter | Value |
|---|---|
| Source temperature (°C) | 350 |
| Dwell time per transition (milli seconds) | 200 |
| Gas flow/Drying Gas (L/min) | 6 |
| Nebulizer gas (psi) | 25 |
| Fragmentor (V) | 200 |
| Collision energy (V) | −10 |
| Ion spray voltage (V) | −5500 |
| Mode of analysis | Negative |
| Ion transition for Tacrolimus | m/z 802.4→560.2 |
| Ion transition for Pimecrolimus | m/z 808.4→548.2 |
Table 1: Tandem mass spectrometer main working parameters.
Preparation of standard and quality control (QC) samples
Stock solutions of tacrolimus at a concentration of 1mg/mLwere prepared by dissolving the accurately weighed reference substance in methanol. The stock solution was then serially diluted with methanol water (50:50v/v) to give working solutions at the following concentrations: 20.931, 41.861, 49.835, 99.670, 240.169, 480.337, 800.562 and1000.703 ng/mL. The other stock solution was independently diluted in a similar way to achieve QC solution at concentrations of 21.120 (LLOQ), 50.285 (low), 478.908 (medium) and 798.179 ng/mL (high). Internal standard working solution (5 µg/mL) was prepared by diluting the 1mg/mL stock solution of pimecrolimus with methanol water (50:50v/v). All the solutions were kept at 4°C -8°C and were brought to room temperature before use.
Both the calibration standard samples and the quality control samples which were used in the pre-study validation and during the pharmacokinetic study were prepared by spiking 100 µL blank whole blood with 50 µLworking solutions correspondingly.
Extraction procedure for plasma samples
A 0.1 mLvolume of whole blood sample was transferred to 2 mL RIA(Radio Immune Assay) vial and then 50 µL of the internal work solution (5 µg/mL methanol water 50:50v/v) was spiked. The mixture was vortexed for 30s; 0.5 mL aliquot of extraction solvent (t-butyl methyl ether) was added using dispensette organic (Brand GmbH, Postfach, Germany).The analyte and IS were extracted from whole blood by vortexing for 10 min using heidolph vibramax 110 (Germany). Then sample was centrifuged using micro centrifuge (5415R Eppendorf) for 5min at 10000 rpm. Following centrifugation the supernatant was transferred to clean glass test tubes and then evaporated to dryness using TurboVap LV Evaporator (Zymark, Hopkinton, MA, USA) at 40°C under a stream of nitrogen. The residues were reconstituted with 100 µL of mobile phase and aliquots of 20 µL were injected into the Chromatographic system.
Bioanalytical method validation
Selectivity and lower limit of quantification (LLOQ): To investigate the selectivity of the method, rat whole blood blank samples from 6 different lots were pretreated and analyzed at LLOQ.
Calibration curve: A calibration curve was constructed from a blank sample (a whole blood processed without an IS), a zero sample (a whole blood processed with IS) and eight non-zero samples covering the total range (20.931-1000.703 ng/mL), including LLOQ. Eight samples of each concentration were measured and the curves were fitted by a linear weighted (1/x2) least squares regression method through the measurement of the peak-area ratio of the analyte to IS. The calibration curve had to have a correlation coefficient (r2) of 0.999 or better. The acceptance criterion for each back-calculated standard concentration was 15% deviation from the nominal value except LLOQ, which was set at 20%.
Recovery: The extraction recoveries were determined at three concentration levels (50.285, 478.908 and 798.179 ng/mL) for tacrolimus by comparing the analyte peak areas obtained from the quality control samples (n = 6) after extraction with those obtained from the corresponding unrestricted reference standards prepared at the same concentrations. Recovery of IS was evaluated by comparing the mean peak areas of 6 extracted Blank+IS samples to mean peak areas of 6 neat reference solutions (unprocessed) of the same concentration.
Precision and Accuracy: To evaluate the precision and accuracy of the method, QC samples at four concentration levels (21.120, 50.285, 478.908 and 798.179 ng/mL) were analyzed in six replicates on three validation days. The assay precision was calculated by using the relative standard deviation (RSD).The assay accuracy was expressed as relative error (RE %), i.e. (measured concentration-nominal concentration)/ (nominal concentration) ×100.
Stability: The stability of the stock solutions and working solutions of tacrolimus and IS, which were stored at 4°C -8°C for 15 days and at room temperature (25°C) for 5 h, was tested by comparing the instrument response with that of freshly prepared solutions. The analytes were considered stable when the intensities ranged between 85% and 115% of the initial solutions. The stability of tacrolimus in rat whole blood was evaluated by analyzing replicates (n=6) of whole blood samples that were exposed to different conditions (time and temperature) at two concentrations (50.285 and 798.179 ng/mL). These results were compared with those results obtained from freshly prepared whole blood samples. The analyte was considered to be stable in biological matrix and acceptance criteria is ±15%.The long term stability was determined after exposure of the spiked samples at -20°C for 10 days. The freeze thaw stability was evaluated after complete three freeze thaw cycles (-20 °C to -25°C) on consecutive days.
Matrix effects: According to the method described by Matuszewski et al. [29], assessed the matrix effects (MEs), whether the potential ion suppression or enhancement owing to the co-eluting matrix components existed in the present experiment. The corresponding peak areas of tacrolimus from the spike-after-extraction samples at one concentration level (50.285 ng/mL) were then compared to those of the respective unprocessed or aqueous standard. Matrix effects of IS were investigated at concentration level (5 µg/mL) in similar way.
Results and Discussion
LC-MS/MS Optimization
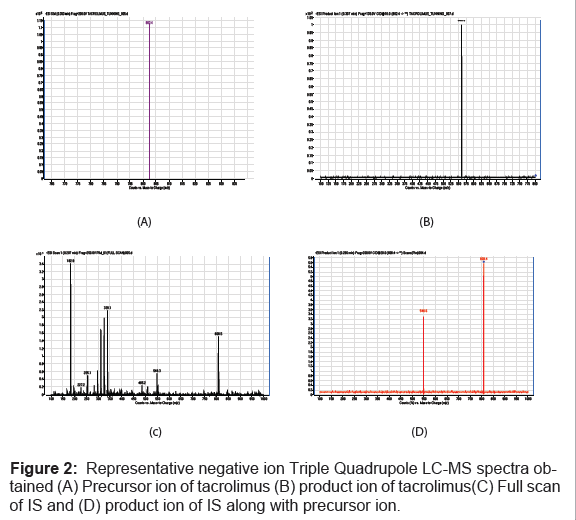
Electrospray MS-MS was used to analyze the compound tacrolimus. Negative ionization was selected to quantify the analyte because negative ion mass spectrometry gave a deprotonated molecular ion without adduct formation over positive ionization (Figure 2). The combination of chromatographic separation by HPLC and successive mass filtrations by monitoring the transition of the deprotonated ion to product ion provided excellent specificity for tacrolimus and internal standard. The negative ion electro-spray mass spectrum of the analyte and IS gave a deprotonated molecular ions at m/z 802.4, m/z 808.4 and product ions at m/z 560.2, m/z 548.6 respectively.
| Nominal concentration (ng/ml) |
n | Precision (%) | Accuracy (%) |
|---|---|---|---|
| 20.931 | 5 | 1.93 | 102.6 |
| 41.861 | 5 | 3.45 | 96.45 |
| 49.835 | 5 | 0.92 | 99.45 |
| 99.169 | 5 | 1.02 | 97.50 |
| 240.169 | 5 | 2.17 | 97.60 |
| 480.337 | 5 | 0.28 | 101.60 |
| 800.703 | 5 | 1.48 | 100.15 |
| 1000.703 | 5 | 1.55 | 104.75 |
Table 2: Precision and accuracy data of back-calculated concentrations of calibration samples for tacrolimus in rat whole blood.
Thus, the MRM technique was chosen for the assay development. The MRM state file parameters were optimized to maximize the response for the analyte. The approach applied to the development of this method was based on the literature survey done on tacrolimus, which form adducts for the quantization by LC-MS/MS [30-34]. Signal intensities are affected by the presence of ion in the mobile phase concentrations. Signal intensities are also affected by the type of adduct formed.
Taylor and Johnson [33] state that the resultant product ion spectra of the sodium adduct contains more fragmentation and thus gives a less sensitive response for selected reaction monitoring. Sodium adduct of sirolimus is more stable than the ammonium adduct and thus requires more energy to produce fragmentation. So they added ammonium acetate to the mobile phase in order to produce ammoniated species, [M + NH4] + for mass spectrometric detection of sirolimus using selected reaction monitoring.
But in case of Christians et al. [2] method, even if 2mM ammonium acetate was added to the mobile phase to induce formation of [M +NH4]+ at the expense of other ion species, [M+Na]+ still gave a significant signal. Addition of sodium ions to the mobile phase almost completely suppressed formation of other ions. So, they added sodium formate to the mobile phase for mass spectrometric detection of cyclosporine, tacrolimus, sirolimus and everolimus using selected ion monitoring. Therefore, sensitivity, robustness and ruggedness of the method are questionable. There is a need of rugged method in high-throughput bioanalysis. This method is robust, simple and rapid which makes it an attractive procedure in high-throughput bioanalysis.
Selection of mobile phase and internal standard
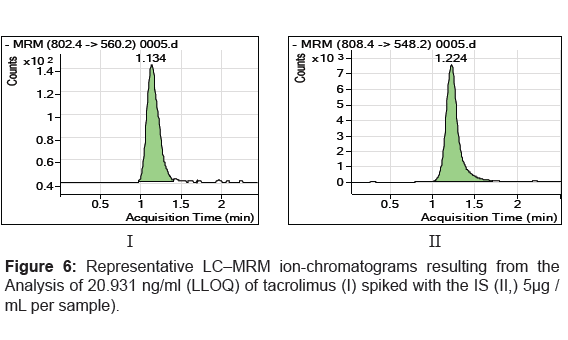
Different mobile phases were evaluated to improve HPLC separation and enhance sensitivity in MS. A binary system using a mobile phase of 90% methanol and 10% 2mM of ammonium acetate buffer was optional for the analyte with respect to peak shape and mass spectral response. Under this condition, the retention times of both analyte and IS were approximately 1.134 and 1.230 min respectively. The mobile phase used guaranteed good repeatability of retention times. The total run time for each sample was 2.5 min.
The use of an internal standard was required in the LC-MS/MS assay for two reasons: to compensate for loses during extraction and to compensate for the variable detection sensitivity of the MS. The more samples we ran on the MS, the more the skimmers and the MS source were contaminated, and more the sensitivity decreased. Thus, Pimecrolimus good choice as the IS for tacrolimus since being an acid with pKa value, its solubility in mobile phase, its chromatographic and extraction properties, which are similar to tacrolimus. It was expected to give similar recovery on Liquid-Liquid extraction and MS/MS response in the negative ion mode.
Calibration curves
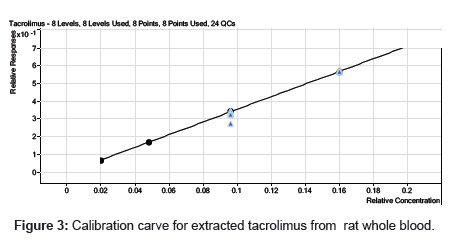
Calibration curve was linear over the concentration range of 20.931 -1000.703 ng/mL for the analyte. The eight-point calibration curve gave acceptable results for the analyte and was used for all the calculations. The mean correlation coefficient of the weighted (1/x2) calibration curve generated during the validation was 0.999 for the analyte (Figure 3). Table 2 summarizes the calibration curve results for the analyte. The precision and accuracy for the analyte covering the concentration of 20.931 -1000.703 ng/mL ranged from 0.28 to 3.45 and 96.45 to 104.75%, respectively. The calibration curve obtained as described above was suitable for generation of acceptable data for the concentrations of the analyte in the samples during the validations for tacrolimus in rat whole blood.
Specificity
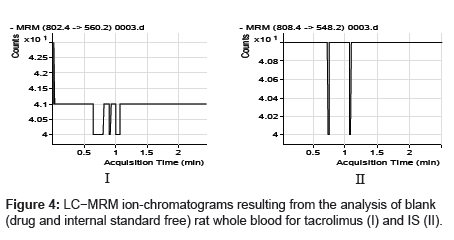
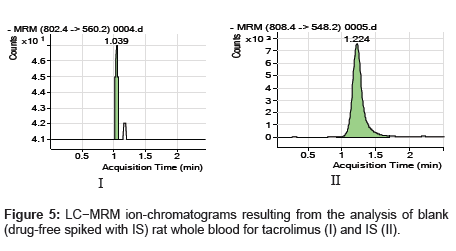
The specificity of the method was examined by analyzing the blank whole blood extract (Figure 4) and spiked only with the internal standard (Figure 5). As shown in (Figure 4), no significant interference in the blank Whole blood traces was seen from endogenous substances in drug-free rat whole blood at the retention time of the analyte. Figure 5 shows the absence of interference from the internal standard to the MRM channels of the analyte. Figure 6 depicts a representative ionchromatogram for the LLOQ (20.931 ng/mL) of the calibration curve. Excellent sensitivity was observed for 20 µL injection volume corresponding to 20.931 ng/mL on-column.
Recovery
The extraction recovery of tacrolimus was 23.92% on average and the recovery of IS was 18.52% at the concentration used in the assay (5 µg/mL). Recovery of analyte and IS were low but it was consistent, precise and reproducible.
Lowest concentration
The LLOQ of tacrolimus in rat whole blood assay was 20.195 ng/ mL. Although peaks were detected at the concentration of 10 ng/mL with a signal-to-noise ratio above 5, the precision and accuracy did not meet the acceptance criteria (<±20%). The between-batch precision at the LLOQ-expressed as RSD was 1.20%. The between-batch accuracy expressed as relative error (RE) was 107.98% (Table 3). The withinbatch precision was 9.5% and the accuracy was 106.2% for tacrolimus.
| Nominal concentration (ng/ml) |
n | Precision (%) | Accuracy (%) |
|---|---|---|---|
| LLOQ (21.120) | 24 | 1.20 | 107.98 |
| Low concentration (50.285) |
24 | 1.94 | 100.20 |
| Medium concentration (478.908) |
24 | 8.01 | 95.47 |
| High concentration (798.179) |
24 | 1.07 | 100.18 |
Table 3: Precision and accuracy data from between-batch experiment for tacrolimus in rat whole blood.
Precision and accuracy
All the values are summarized in Table-3. The middle and upper quantitation levels of tacrolimus ranged from 50.285 to 798.179 ng/mL in rat whole blood. For the between batch experiment, the precision ranged from 1.07 to 8.01%. For the within batch experiment, the precision and accuracy for the analyte met the acceptance criteria (<±15%) and precision was below 4.88% at all concentrations tested.
Freeze -thaw stability
The freeze-thaw stability of the analyte was determined by measuring the assay precision and accuracy for the samples which underwent three freeze-thaw cycles. The stability data were used to support repeat analysis. The frozen whole blood samples containing the analyte was thawed at room temperature for 2-3 h, refrozen for 12-24 h, thawed for 2-3 h, refrozen for 12-24 h, thawed and then analyzed. The results showed that the analyte was stable in rat whole blood through three freeze-thaw cycles. The precision ranged from 2.55 to 4.24% and the accuracy ranged from 103.58 to 105.36% (Table 4). The results demonstrated that, rat whole blood samples could be thawed and refrozen without compromising the integrity of the samples.
| Spiked concentration (ng/ml) | n | Precision (%) | Accuracy (%) |
|---|---|---|---|
| Freeze-thaw stability | |||
| 50.285 (LQC) | 6 | 4.24 | 103.58 |
| 798.179 (HQC) | 6 | 2.55 | 105.36 |
| Long-term frozen storage stability | |||
| 50.285 (LQC) | 6 | 4.72 | 103.96 |
| 798.179(HQC) | 6 | 2.48 | 103.14 |
Table 4:Stability of rat whole blood samples of tacrolimus.
Long-term storage stability
The storage time in long-term stability evaluation, the time between the first sample collection and the last sample analysis. The sample long-term storage stability at -20°C was evaluated to establish acceptable storage conditions for Pharmacokinetic samples. Aliquots of rat whole blood samples spiked with analyte at concentrations of 50.285 and 798.179 ng/mL were analyzed on day 1. Then the samples from the same pools were analyzed against calibration curves from freshly prepared standards after storage at -20°C for 10 days. The precision and accuracy for the analyte on day 10 ranged from 2.48 to 4.72 and 103.14 to 103.96%, respectively
Conclusions
In summary, tacrolimus is quantified in rat whole blood by Triple Quadrupole LCMS negative ionization mode without adduct formation using MRM.The method described is simple, rapid, sensitive, specific and fully validated as per FDA guidelines. The cost effectiveness, simplicity and speed of liquid-liquid extraction and sample total run time of 2.5 mins per sample make it an attractive procedure. The validated method allows quantization of tacrolimus in the 20.931 to 1000.703 ng/mL range.
Acknowledgements
Authors wish to acknowledge the support received from Mr.Balaji Karthikeyan, Vice President, G7Synergon Pvt Ltd, Tatanagar, Bangalore. India.
References
- Wong SHY (2001) Therapeutic drug monitoring for immunosuppressants. Clin Chim Acta 313: 241-253
- Christians U, Jacobsen W, Serkova N, Benet L Z, Vidal C, et al. (2000) Automated, fast and sensitive quantification of drugs in blood by liquid chromatography- mass spectrometry with on-line extraction: immunosuppressants. J Chromatography B 748: 41-53.
- Spencer CM, Goa KL, Gillis JC (1997) Tacrolimus. An update of its pharmacology and clinical efficacy in the management of organ transplantation. Drugs 54: 925-975.
- Jusko WJ, Thomson AW, Fung J, McMaster P, Wong S (1995) Consensus document: therapeutic monitoring of tacrolimus (FK-506). Ther Drug Monit 17: 606-614.
- Jusko WJ (1995) Analysis of tacrolimus (FK 506) in relation to therapeutic drug monitoring. Ther Drug Monit 17: 596-601.
- McMaster P, Mizra DF, Ismail T, Vennarecci G, Patapis P, et al. (1995) Therapeutic drug monitoring of tacrolimus in clinical transplantation. Ther Drug Monit 17: 602-605.
- Venkataraman R, Swaminathan A, Prasad T, Jain A, Zuckerman S, et al. (1995) Clinical pharmacokinetics of tacrolimus. Clin Pharmacokinet 29: 404.
- Jusko WJ, Thomson AW, Fung JJ, McMaster P, Wong PH, et al. (1995) Consensus document: therapeutic monitoring of tacrolimus (FK-506). Ther Drug Monit 17: 606-614.
- Moller A, Iwasaki K, Kawamura A, Teramura Y, Shiraga T, et al. (1999) The disposition of 14C-labeled tacrolimus after intravenous and oral administration in healthy human subjects. Drug Metab Dispos 27: 633-636.
- Bekersky I, Dressler D, Alak A, Boswell GW, Mekki QA (2001). Comparative tacrolimus pharmacokinetics: normal versus mildly hepatically impaired subjects. J Clin.Pharmacol 41: 628-635.
- Sattler M, Guengerich FP, Yun C, Christians U, Sewing K (1992) Cytochrome P-450 3A enzymes are responsible for biotransformation of FK506 and rapamycin in man and rat. Drug Metab Dispos 20: 753-761.
- Shiraga T, Matsuda H, Nagase K, Iwasaki K, Noda K, et al. (1994) Metabolism of FK506, a potent immunosuppressive agent, by cytochrome P450 3A enzymes in rat, dog, and human liver microsomes. Biochem Pharmacol 47: 727-735.
- Saeki T, Ueda K, Tanigawara Y, Hori R, Komano T (1993) Human P- glycoprotein transports cyclosporine A and FK506. J Biol Chem 268: 6077-6080.
- Kaplan B, Lown K, Craig R, Abecassis M, Kaufman D, et al. (1999) Low bio ability of cyclosporine micro emulsion and tacrolimus in a small bowel transplant recipient. Transplantation 67: 333-338.
- Yokogawa K, Takahashi M, Tamai I, Konishi H, Nomura M (1999) P-Glycopro tein-dependent disposition kinetics of tacrolimus: studies in mdr1a knockout mice. Pharm Res 16: 1213-1218.
- Arima H, Yunomae K, Hirayama F, Uekama K (2001) Contribution of P- lycoprotein to the enhancing effects of dimethyl-cyclodextrin on oral bioavailability of tacrolimus. J Pharmacol Exp Ther 297: 547-555.
- Tamura S, Ohike A, Ibuki R, Amidon GL, Yamashita S (2002) Tacrolimus is a class II low-solubility high-permeability drug: the effect of P-glycoprotein efflux on regional permeability of tacrolimus in rats. J Pharm Sci 91: 719-729.
- Soldin SJ, Papanastasiou DA, Heyes J, Lingwood C, Olley P (1984) Are immunoassays for digoxin reliable? Clin Biochem 17: 317-320.
- Soldin SJ (1986) Digoxin-issues and controversies. Clin Chem 32: 5-12.
- Salm P, Taylor PJ, Clark A, Balderson GA, Grygotis A, et al. (1997) High-per formance liquid chromatography-tandem mass spectrometry as a reference for analysis of tacrolimus to assess two immunoassays in patients with liver and renal transplants. Ther Drug Monit 19: 694.
- Dusci LJ, Hackett P, Chiswell GM, Ilett KF (1992) Comparison of Cyclosporine Measurement in Whole Blood by High-Performance Liquid Chromatography, Monoclonal Fluorescence Polarization Immunoassay, and Monoclonal Enzyme-Multiplied Immunoassay. Ther Drug Monit 14: 327.
- Warty V, Zuckerman S, Venkataramanan R, Lever J, Chao J, et al. (1995) Ta crolimus analysis: a comparison of different methods and matrices. Ther Drug Monit 17: 159-167
- Murthy JN, Davis DL, Yatskoff RW, Soldin SJ (1998) Tacrolimus metabolite cross-reactivity in different tacrolimus assays. Clin Biochem 31: 613-617.
- Volosov A, Napoli KL, Soldin SJ (2001) Simultaneous simple and fast quantification of three major immunosuppressants by liquid chromatography--tandem mass-spectrometry. Clin Biochem 34: 285-290.
- Taylor PJ, Jones A, Balderson GA, Lynch SV, Norris RL, et al. (1996) Sensitive, specific quantitative analysis of tacrolimus (FK506) in blood by liquid chromatography- electrospray tandem mass spectrometry. Clin Chem 42: 279-785.
- Taylor PJ, Hogan NS, Lynch SV, Johnson AG, Pond SM (1997) Improved therapeutic drug monitoring of tacrolimus (FK506) by tandem mass spectrometry. Clin Chem 43: 2189-2190.
- Zhang Q, Simpson J, Aboleneen HI (1997) A specific method for the measurement of tacrolimus in human whole blood by liquid chromatography/tandem mass spectrometry. Ther Drug Monit 19: 470.
- Alak AM, Moy S, Cook M, Lizak P, Niggebiugge A, et al. (1997) Determination of omeprazole in pharmaceuticals by derivative spectroscopy. J Pharm Biomed Anal 16: 347-342.
- Matuszewski BK, Constanzer ML, Chavez-Eng CM (2003) Monolithic silicabased capillary reversed-phase liquid chromatography/electrospray mass spectrometry for plant metabolomics. Anal Chem 75 :3019-3030.
- Lensmeyer GL, Poquette MA (2001) Clinically important drug interactions in epilepsy: interactions between antiepileptic drugs and other drugs. Ther Drug Monit 23: 473-481.
- Streit F, Christians U, Schiebel HM, Napoli KL, Ernst L, et al. (1996) Validation of an assay for routine monitoring of sirolimus using HPLC with mass spectrometric detection. Clin Chem 42: 1417- 1425.
- Kirchner GI, Vidal C, Jacobsen W, Franzke A, Hallensleben K, et al. (1999) The quantification of sirolimus by high-performance liquid chromatography-tandem mass spectrometry and microparticle enzyme immunoassay in renal transplant recipients. J Chromatogr B 721: 285-294.
- Taylor PJ, Johnson AG (1998) Matrix effects: the Achilles heel of quantitative high-performance liquid chromatography-electrospray-tandem mass spectrometry. J Chromatogr B 718: 251.
- Salm P, Taylor PJ, Lynch SV, Pillans PI (2002) Quantification and stability of everolimus (SDZ RAD) in human blood by high-performance liquid chromatography- electrospray tandem mass spectrometry. J Chromatogr B 772: 283.
Relevant Topics
Recommended Journals
Article Tools
Article Usage
- Total views: 20631
- [From(publication date):
April-2011 - Apr 11, 2025] - Breakdown by view type
- HTML page views : 15441
- PDF downloads : 5190

