Research Article Open Access
Control of Singular Cell Cycle Synchronization of Mouse ES Cells for Hepatocyte Differentiation on E-Cadherin Substratum
Dragomirka Jovic1, Amranul Haque1, Bayar Hexig1, Masato Nagaoka1,2 and Toshihiro Akaike3*1Graduate School of Bioscience and Biotechnology, Tokyo Institute of Technology, B-57, 4259 Nagatsuta-cho, Midori-ku, Yokohama 226-8501, Japan
2Department of Cell Biology, Neurobiology & Anatomy, Medical College of Wisconsin, Milwaukee, WI 53226,USA
3Frontier Research Center, Tokyo Institute of Technology, 4259 Nagatsuta-cho, Midori-ku, Yokohama, 226-8503, Japan
- Corresponding Author:
- Toshihiro Akaike
Frontier Research Center, Tokyo Institute of Technology
4259 Nagatsuta-cho, Midori-ku
Yokohama, 226-8503, Japan
Tel: +81-45-924-5790
Fax: +81-45-924-5815
E-mail: takaike@bio.titech
Received date: July 28, 2011; Accepted date: August 25, 2011; Published date: August 27, 2011
Citation: Jovic D, Haque A, Hexig B, Nagaoka M, Akaike T (2011) Control of Singular Cell Cycle Synchronization of Mouse ES Cells for Hepatocyte Differentiation on E-Cadherin Substratum. J Biotechnol Biomaterial 1:113. doi:10.4172/2155-952X.1000113
Copyright: © 2011 Jovic D, et al. This is an open-access article distributed under the terms of the Creative Commons Attribution License, which permits unrestricted use, distribution, and reproduction in any medium, provided the original author and source are credited.
Visit for more related articles at Journal of Biotechnology & Biomaterials
Abstract
Stem cells have enormous potential for therapeutic applications due to their ability to differentiate into diverse cell types. However, preparation of specific lineages at high purity from embryonic stem cells remains a challenge. We have previously reported that embryonic stem (ES) cells on E-cadherin substratum form single-cell scattering morphology. In this study, we report the effect of the hydroxyurea on singular ES cell cycle synchronization to achieve homogeneous population of differentiated cells on E-cadherin substratum. ES cells were successfully arrested in G1 phase with the administration of hydroxyurea and subsequently induced to differentiate into hepatocyte-like cells. The homogeneous population of cells on E-cadherin substratum from synchronized ES cells have higher capability to differentiate into hepatocytes-like cells than unsynchronized ES cells. Moreover, synchronized cells re-enter into the normal cell cycle with the elimination of hydroxyurea for differentiation. Our strategy for ES cell cycle synchronization before differentiation induction possibly helps to increase the yield of hepatocyte-like cells under homogeneous culture condition.
Keywords
Single cells; ES cell cycle synchronization; Extracellular matrix; E-cadherin; Hepatic differentiation
Introduction
The greatest potential of embryonic stem cells to proliferate and differentiate into diverse cell types including hepatocytes, represents a promising source. Proliferation and differentiation are two inversely correlated processes, which include diversity in cell cycle, morphology, and functions [1-7]. Mouse embryonic stem (mES) cells have unusual cell cycle structure characterized by a short G1 phase and a proportionally long S phase. ES cells typically make decision to differentiate, proliferate, become quiescent, or undergo apoptosis in G1 phase [8-12]. The early studies suggest that mES cells typically respond to growth factors or other external stimuli in G1 phase [13-15]. However, this is very difficult to reveal the close link between cell cycle regulation, arresting cells in G1 phase, and induction of differentiation due to complicated microenvironment in the conventional ES cell culture systems.
In our previous studies, we reported that neither colony formation nor feeder layer is necessary for the maintenance of ES cell self-renewal and differentiation [16,17]. Mouse ES cells on our unique cell recognizable matrix, E-cad-Fc formed single cell scattering morphology. Considering this phenomena, we controlled cell cycles of individual cells on E-cad-Fc substratum in order to improve the efficiency of hepatocyte differentiation. We considered G1 to be the most suitable phase to synchronize ES cells in order to achieve optimal response to growth factors for differentiation. To the best of our knowledge, this is the first report to analyze mES cells under single cell culture conditions for monitoring the effect of cell cycle synchronization on targeted differentiation.
Materials and Methods
Preparation of E-cad-Fc-coated dishes
In our previous studies, expression and purification of E-cad-Fc chimera protein has been described elsewhere [16]. In brief, E-cad-Fc fusion protein was generated using the E-cadherin extracellular domain cDNA from mouse E-cadherin full-length cDNA provided by the RIKEN BRC DNA Bank (code 1184), and mutated mouse IgG1 Fc domain cDNA (T252M/T254S). To prepare the E-cad-Fc-coated surface, purified E-cad-Fc solution was directly added to non-treated polystyrene plates. After 2 hours of incubation at 37°C, plates were washed with PBS once, and then cells were seeded. Characteristic single-cell scattering morphology was observed after 20 h of incubation at 37°C.
Cell culture
For all cultures, feeder-free mouse embryonic stem cells (EB3 line) were used. Mouse embryonic stem cells were cultured on 0.1% gelatin and E-cad-Fc-coated dishes in Glasgow minimum essential medium (GMEM; Sigma-Aldrich) supplemented with 10% (v/v) fetal bovine serum (FBS), 1 mM L-glutamine (Millipore), 1% non essential amino acids (Gibco, Invitrogen), 0.1 mM β-mercaptoethanol (Sigma Chemical), and 1,000 units/ml ESGRO (Chemicon). Mouse ES cells were passaged every two or three days using accutase (Millipore). The cells were incubated at 37°C in a humidified 5% CO2-containing atmosphere.
Cell synchronization
For mES cell cycle synchronization on E-cadherin substratum, various concentrations of hydroxyurea (Sigma) were used for 6, 12, and 18 h. The following concentrations of hydroxyurea were selected: 0.5, 5, and 50 μg/ml. The 50 μg/ml hydroxyurea for 18 h of treatment was optimized for cell cycle synchronization using FACS analysis (data not shown). Control cultures on 0.1% gelatin-coated dishes with or without hydroxyurea were always grown in parallel. For cell cycle re-entry analysis, synchronized cells were washed three times with PBS to remove hydroxyurea. Fresh new medium were added and DNA content was analyzed by FACS at three different time points.
Mouse ES cell differentiation in vitro
We prepared three types of hepatocytes differentiation medium. We categorized differentiation medium depending on the types of growth factors added in basal medium. The composition of differentiation medium was identical to that described above for ES cell culture medium except that FBS concentration was reduced to 1% and 10% (v/v) knockout serum replacement (KSR; Invitrogen) were added and ESGRO was omitted. By convention, this medium was designated as basal medium. For differentiation medium I, the basal medium was supplemented with 0.2% DMSO (Sigma) and cells were treated for two days. Then DMSO was removed and 15 μg/ml sodium butyrate (Sigma Aldrich) was added for next six days. This medium was designated as differentiated medium II. For further maturation, cells at this stage were dissociated with accutase (Millipore) and reseeded again onto 35 mm E-cad- Fc-coated dishes at a density of 10,000 cells. We cultured the cells for another two weeks in differentiation medium III containing 10 ng/ml hepatocyte growth factor (HGF, Sigma), 10 ng/ml oncostatin M (OSM, Sigma) and 1 μM dexamethasone (DEX, Sigma). Fresh medium was added in every two days.
Flow cytometry analysis of cell cycle distribution
Propidium iodide solution (50 μg/ml) (Sigma-Aldrich) with 10 μg/ ml RnaseA was added to harvested fixed cells 30 min before analysis. Stained cells were analyzed within 24 h. The cells were transferred to Falcon tubes and analyzed on Beckman coulter Epics XL FACS machine, adapted for excitation with 582/42-hm. FlowJo software (Tree Star) and WinMDI were used for data analysis.
Immunofluorescence
Cells were fixed, permeabilized, and incubated with polyclonal primary antibodies that were detected with secondary antibodies as previously described [17]. Nuclei were stained with DAPI (Sigma), and examined by fluorescent inverted microscope (Olympus, Tokyo, Japan).
Semi-quantitative reverse transcriptase polymerase chain reaction (RT-PCR)
Total RNA was extracted from cells using Trizol reagent (Invitrogen). RNA was reverse-transcribed into cDNA with an oligo-dT primer using Moloney murine leukemia virus (M-MLV) reverse transcriptase (Invitrogen). PCR was performed with TopTaq polymerase (Qiagen) in PCR buffer containing 0.2 mm dNTPs (Takara). The following primer pairs were used: Oct3/4 (forward: 5’-CTGAGGGCCAGGCAGGAGCGAC- 3’, reverse: 5’-CTTTGGACCCTCTTCTGTGA -3’); AFP (forward: 5’-CACTGCTGCAACTCTTCGTA-3’, reverse: 5’-CTTTGGACCCTCTTCTGTGA-3’); ALB (forward: 5’-TCTTCGTCTCCGGCTCTG- 3’, reverse: 5’-CTGGCAACTTCATGCAAAT-3’); HNF3β (forward: 5’-GACCTCTTCCCTTTCTACCG-3’, reverse: 5’-TTGAAGGCGTAATGGTGC- 3’); HNF4α (forward: 5’- CTTCCAAGAGCT GCAGATTG-3’, reverse: 5’- CTTGTAGGATTCAGATCCCG-3’); E-cadherin (forward: 5’-AAACTTGGGGACAGCAACATCAG-3’, reverse: 5’-TCTTTTGGTTTGCAGAGACAGGG-3’); Sox17 (forward: 5’-TTTGTGTATAAGCCCGAGATGG-3’, reverse: 5’-AAGATTGAGAAAACACGCATGAC- 3’); β-actin (forward: 5’-CCTAAGGCCAACCGTGAAAAG- 3’, reverse: (5’-TCTTCATGGTGCTAGGAGCCA-3’). Mouse primary hepatocytes were used as control for RT-PCR and FACS analysis.
Results and Discussion
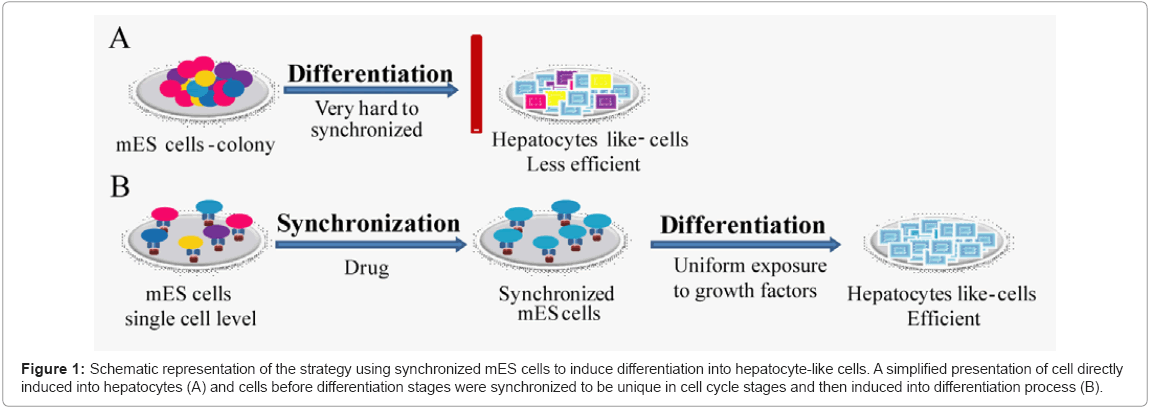
Here, we designed a unique protocol, which is based on cell cycle synchronization of singular ES cells. Synchronized scattered cells on Ecadherin substratum were checked for their capability to differentiate into hepatocyte-like cells in presence of soluble factors. The scheme is illustrated in Figure 1.
Figure 1: Schematic representation of the strategy using synchronized mES cells to induce differentiation into hepatocyte-like cells. A simplified presentation of cell directly induced into hepatocytes (A) and cells before differentiation stages were synchronized to be unique in cell cycle stages and then induced into differentiation process (B).
Cell Cycle Synchronization
Cell cycle control with a drug in scattered mES cells
Stem cell fate that is proliferation, differentiation, or apoptosis is regulated by the transition of cell cycle from G0 into G1 phase [18,19]. It is essential for directed differentiation that large percentage of ES cells stays in G1 phase to receive maximum exposure of growth factors for considerable period of time. Treatments with drugs or serum deprivation are methods commonly used to synchronize cell lines into the G1 phase [20]. However, each protocol has several limitations, including presence of xenogenetic compounds, undefined culture condition, dependency on feeder cells, necessity of relatively high concentration of drugs for treatment, and chance of pathogen transmission [21]. Moreover, the synchronization based on the serum starvation was abandon because ES cells lack on dependency on serum stimuli [10].
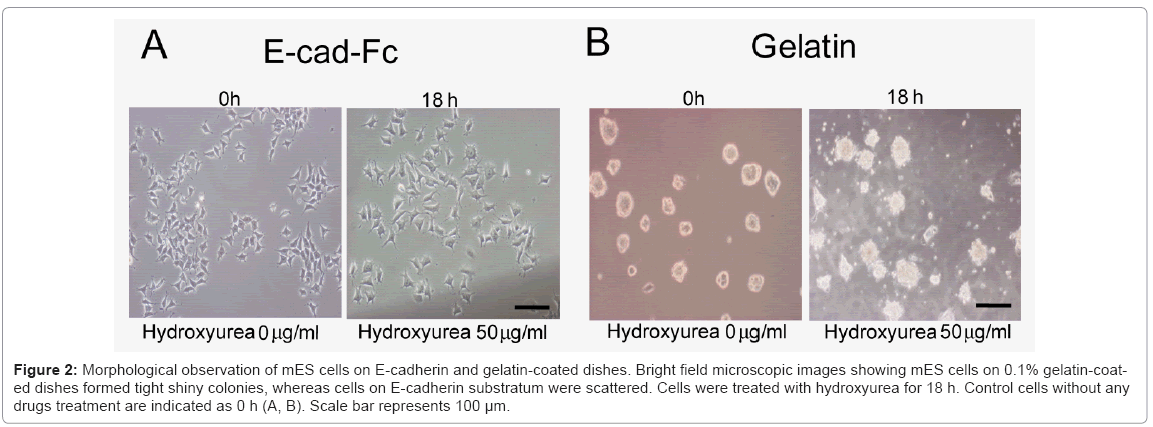
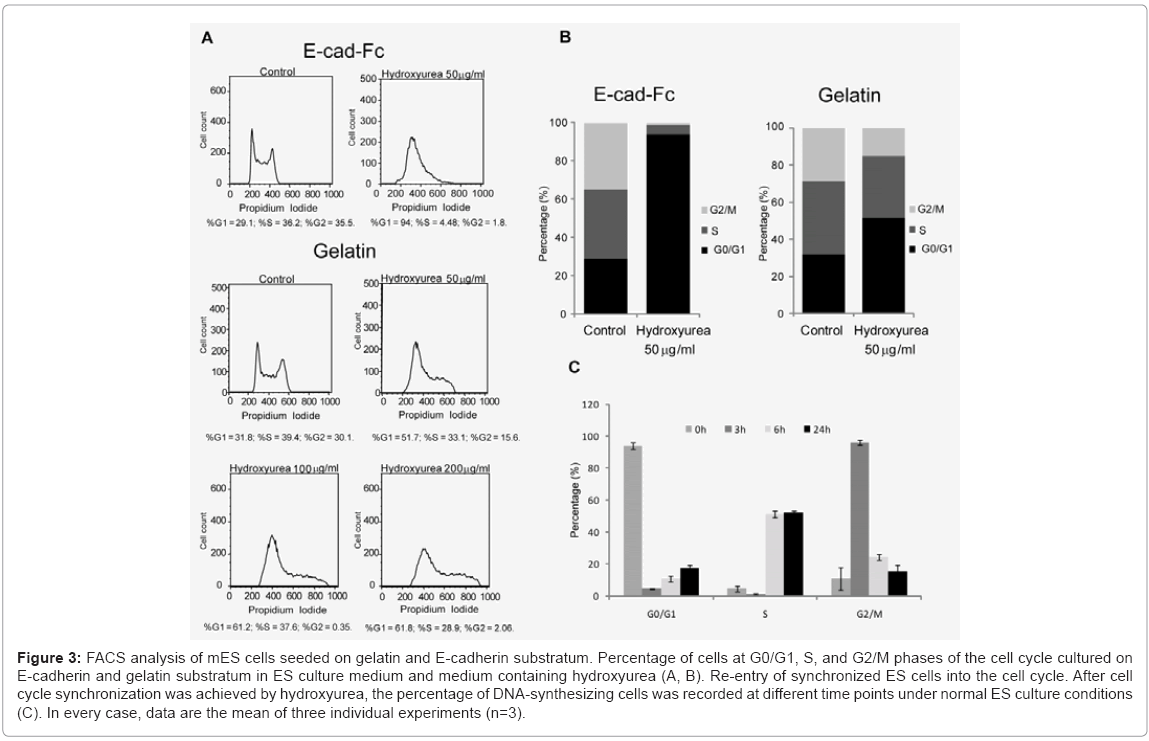
Considering these limitations, here, we used hydroxyurea to synchronize scattered single cells in G1 phase prior to induction of differentiation. First, we optimized the dose and time dependency of hydroxyurea. We analyzed the effect of hydroxyurea on mES cells at three different concentrations (0.5, 5, 50 μg/ml) in three different time points (6, 12, and 18 h) (data not shown). The optimized treatment time and dose of hydroxyurea for cell cycle synchronization was 50 μg/ml for 18 h. Cells morphology was evaluated microscopically Figure 2(A) and Figure 2(B), and cells viability was determined using AlamarBlue assay (data not shown). In contrast to E-cadherin substratum, numerous cell deaths were observed on gelatin-coated dishes. To evaluate drug effect on ES cell cycle, we performed FACS analysis. The DNA of cells were stained with propidium iodide and quantified by FlowJo software. The cell cycle distribution of unsynchronized ES cells on E-cad-Fc matrix was %G1=29.1; %S=36.2; %G2=35.5. By 18 h of drug administration (50 μg/ml of hydroxyurea), high proportion of ES cells (%G1=94; %S=4.48; %G2=1.8) were arrested in G1 phase. The 50 μg/ml hydroxyurea for 18 h of treatment was optimized for cell cycle synchronization. In contrast to cells on E-cad-Fc, distribution of cell cycle of mES cell on gelatin was (%G1=51.7; %S=33.1; %G2=15.6) suggested that homogeneous population of ES cells on E-cad-Fc matrices facilitates the analysis of cell cycle simple and convenient Figure 3(A) and 3(B). Most ES cells on E-cadherin substratum were arrested in the G1 phase with least effect on their survivability with the treatment of very low concentration (50 μg/ml) of drug. On the other hand, cells on gelatincoated dishes did not show any big alteration in cell cycle distribution even with the treatment of high drug concentration (100 or 200 μg/ml) Figure 3(A). Therefore, even though drug administration had a deleterious effect on the cells, we successfully established the strategy for ES cell cycle synchronization with relatively high rate of survivability. The highly regulated ES cell cycle phenomenon on E-cad-Fc matrix extends differences between single and colony forming cells. Next, we investigated the ability of synchronized ES cells to re-enter into the cell cycle. DNA synthesis released from blocked cells was measured by FACS after exposure to normal ES culture conditions. The results suggest that mES cell cycles could be released from their blocked state and mitotic cells were detected in the time course Figure 3(C).
Figure 2: Morphological observation of mES cells on E-cadherin and gelatin-coated dishes. Bright field microscopic images showing mES cells on 0.1% gelatin-coated dishes formed tight shiny colonies, whereas cells on E-cadherin substratum were scattered. Cells were treated with hydroxyurea for 18 h. Control cells without any drugs treatment are indicated as 0 h (A, B). Scale bar represents 100 μm.
Figure 3: FACS analysis of mES cells seeded on gelatin and E-cadherin substratum. Percentage of cells at G0/G1, S, and G2/M phases of the cell cycle cultured on E-cadherin and gelatin substratum in ES culture medium and medium containing hydroxyurea (A, B). Re-entry of synchronized ES cells into the cell cycle. After cell cycle synchronization was achieved by hydroxyurea, the percentage of DNA-synthesizing cells was recorded at different time points under normal ES culture conditions (C). In every case, data are the mean of three individual experiments (n=3).
Differentiation of synchronized cells into hepatocytes
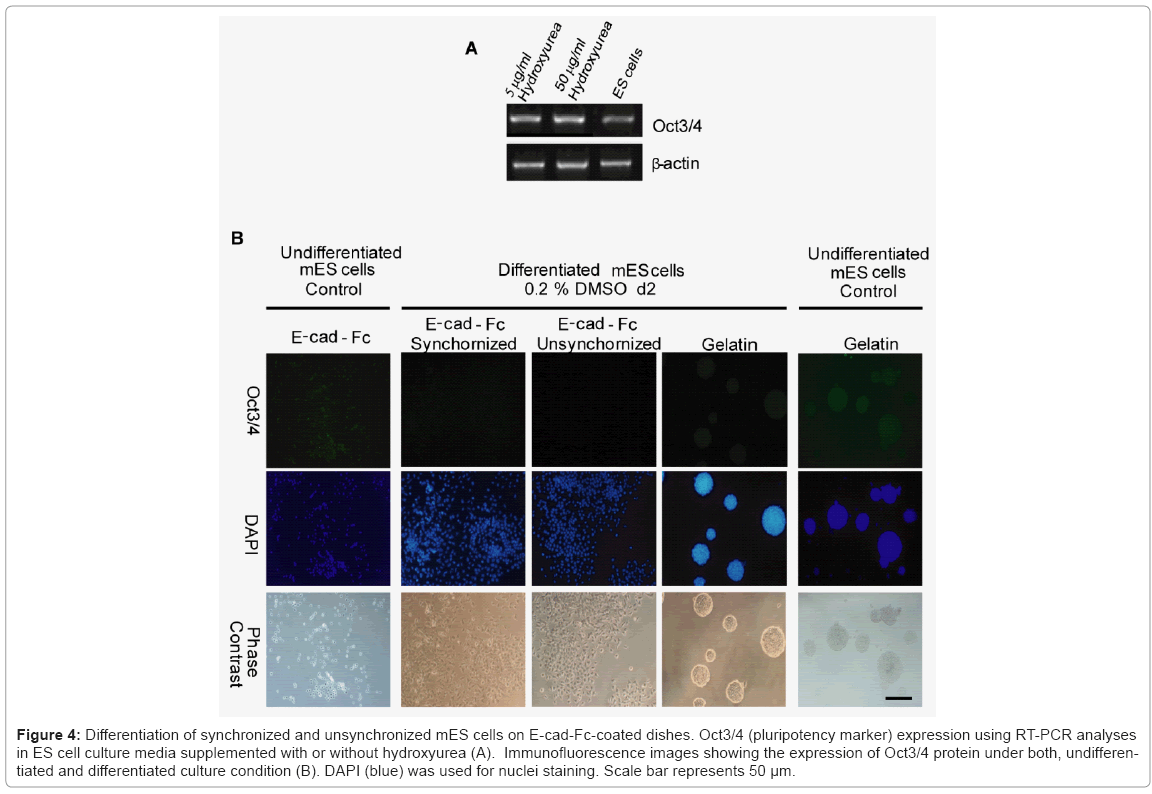
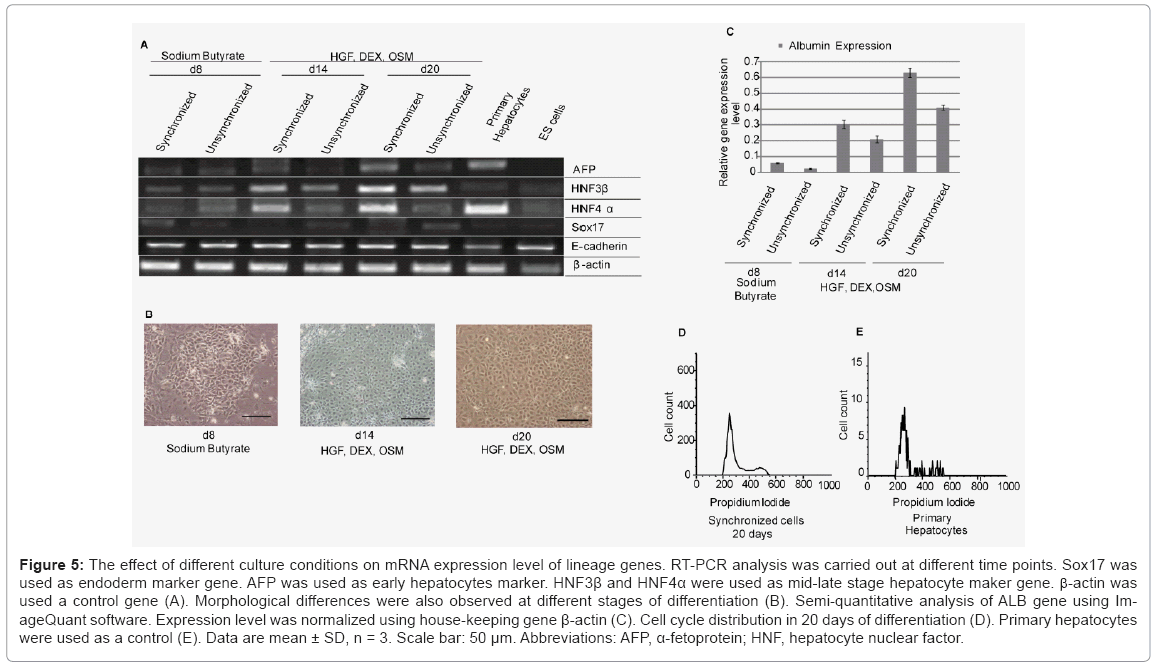
To evaluate whether synchronized mES cells have differentiation capability, we used combinations of cytokines and soluble inducers. We targeted hepatocytes, because in our previous study we showed the potential of E-cadherin substratum to support differentiation of mES cells into endoderm and hepatocyte-like cells [17]. Before starting differentiation, we confirmed that mES cells did not lose their pluripotency after a treatment with drug for synchronization. The expression level of undifferentiated gene Oct3/4 in both synchronized and unsynchronized ES cells were comparable Figure 4(A). We used combination of cytokines, sodium butyrate, and DMSO for differentiation. First, synchronized mES cells were treated with 0.2% DMSO for 2 days. In contrast to cells on gelatin, Oct3/4 expression on E-cadherin substratum was decreased dramatically in presence of DMSO within two days of differentiation Figure 4(B). For next six days, we treated the cells with sodium butyrate followed by addition of media supplemented with HGF, OSM, and DEX for another two weeks. We used RT-PCR assay to determine whether the synchronized ES cell-derived hepatic cells expressed typical differentiation markers, Sox17 (sex determining region Y box 17), AFP (α-fetoprotein), hepatocyte nuclear factor 3β and 4α (HNF3β, HNF4α), and albumin (ALB). First, we showed that the expression of definitive endoderm marker Sox17 decreased gradually after 8 days of differentiation. Later, we checked stage specific hepatic progenitor cell markers AFP, HNF3β and hepatocytes marker HNF4. We found that synchronized cells have a higher expression of AFP, HNF3β and HNF4α than unsynchronized cells at different stages of differentiation Figure 5(A). As adherence of differentiated cells on E-cad-Fc matrix is depending on E-cadherin mediated homophilic interaction, we confirmed the expression of E-cadherin throughout all stages of differentiation. Moreover, we observed the changes in morphology of differentiated cells with differentiation time Figure 5(B). We also checked the expression of typical hepatocyte marker, albumin (ALB) using RT-PCR analysis Figure 5(C). We found that ALB expression starts from 8 days of differentiation and reached maximum level on day 20. At all stages of differentiation, synchronized cells expressed higher level of ALB than unsynchronized cells. To check cell cycle distribution during proliferative stage and differentiation process we performed FACS analysis at d0, d8, and d20. Cell cycle re-distribution into G0/G1 phase was observed in day 8, 20 and 27 (data not shown). Cell cycle distribution of differentiated hepatocyte- like cells on day 20 resembled to mouse primary hepatocytes that are used as positive control Figure 5(D,E). Our results demonstrate that synchronization has a positive influence on ES cell differentiation into hepatocyte-like cells especially under single cell level. Differentiated cells from synchronized ES cells had higher capability to differentiate into hepatocyte-like cells than those from unsynchronized ES cells after culturing for 20 days. The ES-cell derived hepatocyte-like cells also showed similar cell cycle profile to that of mouse primary hepatocytes indicating the normal distribution of cell cycle at late stages of differentiation Figure 5(D).
Figure 4: Differentiation of synchronized and unsynchronized mES cells on E-cad-Fc-coated dishes. Oct3/4 (pluripotency marker) expression using RT-PCR analyses in ES cell culture media supplemented with or without hydroxyurea (A). Immunofluorescence images showing the expression of Oct3/4 protein under both, undifferentiated and differentiated culture condition (B). DAPI (blue) was used for nuclei staining. Scale bar represents 50 μm.
Figure 5: The effect of different culture conditions on mRNA expression level of lineage genes. RT-PCR analysis was carried out at different time points. Sox17 was used as endoderm marker gene. AFP was used as early hepatocytes marker. HNF3β and HNF4α were used as mid-late stage hepatocyte maker gene. b-actin was used a control gene (A). Morphological differences were also observed at different stages of differentiation (B). Semi-quantitative analysis of ALB gene using ImageQuant software. Expression level was normalized using house-keeping gene β-actin (C). Cell cycle distribution in 20 days of differentiation (D). Primary hepatocytes were used as a control (E). Data are mean ± SD, n = 3. Scale bar: 50 μm. Abbreviations: AFP, α-fetoprotein; HNF, hepatocyte nuclear factor.
Conclusion
Cell cycle synchronization under homogeneous culture condition will allow ES cells to undergo efficient differentiation into specific lineages of cells for transplantation. Moreover, using this method it is possible to decrease the deleterious effect of drugs or enzymatic effect on differentiated hepatocyte-like cells. Our newly designed E-cadherin substratum can act as a ‘cell-cooking plate’ to regulate embryonic stem cell cycle, proliferation, and directed differentiation to specific lineages of cells for transplantation. In the future, single-cell analysis by visualizing different stages of cell cycle would give us the opportunity to understand the pathways that determine stem cell fate.
Acknowledgements
The authors thank Dr Seiichi Tada for his advices on FACS and cell cycle analysis.
References
- Evans MJ, Kaufman MH (1981) Establishment in culture of pluripotential cells from mouse embryos. Nature 154-156.
- Martin GR (1981) Isolation of pluripotent cell line from early mouse embryos cultured in medium conditioned by teratocarcinoma stem cells. Proc Natl Acad Sci USA 78: 7634-7638.
- Zhu L, Skoultchi AI (2001) Coordinating cell proliferation and differentiation. Curr Opin Genet Dev 11: 91-97.
- Singh MA, Dalton S (2009) The cell cycle and myc intersect with mechanism that regulates pluripotency and reprogramming. Cell Stem Cell 141-149.
- Banas A, Yamamoto Y, Teratani T, Ochiya T (2007) Stem cells plasticity: Learning from hepatogenic differentiation strategies. Dev Dyn 236: 3228-3241.
- Takenaga M, Fukumoto M, Hori Y (2007) Regulated nodal signalling promotes differentiation of the definitive endoderm and mesoderm from ES cells. J Cell Sci. 120: 2078-2090.
- Lavon N, Benvenisty N (2005) Study of hepatocyte differentiation using embryonic stem cells. J Cell Biochem 96: 1193-1202.
- Savatier P, Huang S, Szekely L et al. (1994) Contrasting pattern of retinoblastoma protein expression in mouse, embryonic stem cells and embryonic fibroblast. Oncogene 809-818.
- Becker KA, Ghule PN, Therrien JA, et al. (2006) Self-renewal of human embryonic stem cells is supported by shortened G1 cell cycle phase. J Cell Phisiol 209: 883-893.
- Fluckiger AC, Marcy GG, Marchand M, et al. (2006) Cell cycle features of primate embryonic stem cells. Stem cells 24: 547-556.
- Burdon T, Smith A, Savatier P (2002) Signalling, cell cycle and pluripotency in embryonic stem cells. Trends Cell Biol.12: 432-438.
- Fujii-Yamamoto H, Kim JM, Arai KI, Masai H (2005) Cell Cycle and Developmental regulations of replication factors in mouse embryonic stem cells. J Biol Chem 12976-12987.
- McConnell SK, Kaznowski CE (1991) Cell cycle dependence of laminar determination in developing neocortex. Science 254: 282-285.
- Mummery CL, Van Rooijen MA, Van den Brink SE, De Laat SW (1987) Cell cycle analysis during retinoic acid induced differentiation of a human embryonal carcinoma-derived cell line. Cell Differ 20: 153-160.
- Jonk LJ, De Jonge ME, Kruyt FA, Mummery CL, Van der Saag PT, et al. (1992) Aggregation and cell cycle dependent retinoic acid receptor mRNA expression in P19 embryonal carcinoma cells. Mech Dev 36: 165-172.
- Nagaoka M, Koshimizu U, Yuasa S, et al. (2006) E-cadherin-coated plates maintain pluripotent ES cells without colony formation. PLoS One 1: e5.
- Haque A, Nagaoka M, Hexig B, et al. ( 2011) The effect of recombinant E-cadherin substratum on the differentiation of endoderm-derived hepatocytes-like cells from embryonic stem cells. Biomaterials 32: 2032-2042.
- Blomen VA, Boonstra J (2007) Cell fate determination during G1phase progression. Cell Mol.Life. Sci. 64: 3084-3104.
- Neganova I, Lako M (2008) G1 to S phase cell cycle transition in somatic and embryonic stem cells. J Anat 213: 30-44.
- Khammanit R, Chantakru S, Kitiyanant Y, et al. (2008) Effect of serum starvation and chemical inhibitors on cell cycle synchronization of canine dermal fibroblasts. Theriogenology 70: 27-34.
- Haque MA, Nagaoka M, Hexig B, Akaike T (2010) Artificial extracellular matrix for embryonic stem cell cultures: A new frontier of nanobiomaterials. Sci Technol Adv Mater 11: 014106.
Relevant Topics
- Agricultural biotechnology
- Animal biotechnology
- Applied Biotechnology
- Biocatalysis
- Biofabrication
- Biomaterial implants
- Biomaterial-Based Drug Delivery Systems
- Bioprinting of Tissue Constructs
- Biotechnology applications
- Cardiovascular biomaterials
- CRISPR-Cas9 in Biotechnology
- Nano biotechnology
- Smart Biomaterials
- White/industrial biotechnology
Recommended Journals
Article Tools
Article Usage
- Total views: 15982
- [From(publication date):
October-2011 - Mar 31, 2025] - Breakdown by view type
- HTML page views : 11330
- PDF downloads : 4652
