Case Report Open Access
Computer Simulation of Polymer Chain Scission in Biodegradable Polymers
Andrew Gleadall and Jingzhe Pan*Department of Engineering, University of Leicester, Leicester, LE1 7RH, UK
- Corresponding Author:
- Jingzhe Pan
Department of Engineering, University of Leicester
Leicester, LE1 7RH, UK
Tel: +44 0116 223 1092
Fax: +44 0116 252 2525
E-mail: jp165@le.ac.uk
Received date: December 06, 2012; Accepted date: December 26, 2012; Published date: December 29, 2012
Citation: Gleadall A, Pan J (2013) Computer Simulation of Polymer Chain Scission in Biodegradable Polymers. J Biotechnol Biomater 3:154. doi:10.4172/2329-6674.1000154
Copyright: © 2013 Gleadall A, et al. This is an open-access article distributed under the terms of the Creative Commons Attribution License, which permits unrestricted use, distribution, and reproduction in any medium, provided the original author and source are credited.
Visit for more related articles at Journal of Biotechnology & Biomaterials
Abstract
Biodegradable polymers are used in medical devices such as fixation plates, sutures, or micro particles for the controlled release of drugs. Typical polymers are poly lactic acid (PLA), poly glycolic acid (PGA), and poly caprolactone (PCL). During degradation, the ester bonds within polymer chains are cleaved due to the hydrolysis reaction in the presence of water. It has been suggested that both chain end scission and random chain scission occur [1] and mathematical models have been able to fit experimental data with assumptions of random scission [2-4], end scission [5], or a combination of both [6]. In random scission, every bond in a polymer chain is assumed to be equally susceptible to hydrolysis. In chain end scission, the final bond in a chain is cleaved resulting in the production of a monomer.
Introduction
Biodegradable polymers are used in medical devices such as fixation plates, sutures, or micro particles for the controlled release of drugs. Typical polymers are poly lactic acid (PLA), poly glycolic acid (PGA), and poly caprolactone (PCL). During degradation, the ester bonds within polymer chains are cleaved due to the hydrolysis reaction in the presence of water. It has been suggested that both chain end scission and random chain scission occur [1] and mathematical models have been able to fit experimental data with assumptions of random scission [2-4], end scission [5], or a combination of both [6]. In random scission, every bond in a polymer chain is assumed to be equally susceptible to hydrolysis. In chain end scission, the final bond in a chain is cleaved resulting in the production of a monomer. The final bond may be more susceptible to hydrolysis because of its proximity to the acidic chain end which may catalyse the hydrolysis reaction [7,8]. Given a typical polymer chain may consist of several thousand bonds, a large number of end scissions may be required per chain in order for the reduction in chain length to be comparable to a single random scission. Gel permeation chromatography (GPC) is often used to determine molecular weight. In GPC the time taken for polymer chains to pass through a column of porous beads is affected by their molecular weight. The fraction of the polymer within chains of a given molecular weight range can be calculated to find the distribution of molecular weights. However, it may not be possible to differentiate between low molecular weight chains, which are beyond the scope of GPC. As a result, it may be most appropriate for theoretical calculations of molecular weight to exclude chains below a certain length. It may also be the case that water-soluble chains can diffuse out of the polymer [9] in which case, they would be excluded from GPC analysis. In this paper, a numerical simulation tool is presented that can simulate random scission and end scission of polymer chains. It has the ability to include all chains or only water-insoluble chains in the molecular weight calculations.
Details of the Computer Simulation Scheme
A simulation tool is developed in the form of a Microsoft Excel 2010 spreadsheet which can be freely downloaded by the readers (see Supplementary Information). A list of initial polymer chain lengths are manually entered into a column of the Excel spreadsheet. Each row contains a number which represents the length of an individual polymer chain. Macros use the visual basic programming language within Excel to simulate end scission and random scission of polymer chains.
The random scission scheme contains the following steps:
1. Randomly select a bond from the total number available.
2. Determine which chain contains the selected bond.
3. Determine the length of the two chains that are produced when the original chain is cleaved at the selected bond.
4. Replace the number that represents the original chain length with a number that represents one of the new chains’ lengths.
5. Add a number that represents the length of the other new chain to the list of chains.
The end scission scheme is as follows:
1. Randomly select a chain from the total number of chains containing at least 1 bond.
2. Reduce the number that represents the original chain length by 1.
3. Add a new chain to the bottom of the list of chains with a length of 1.
The combined random scission and end scission scheme is as follows:
1. Randomly select whether to perform a random scission or end scission. The probability of selecting each scission type is weighted proportionally to the fraction of forthcoming scissions that are of that type.
2. Run the end scission or random scission scheme.
3. Update the number of scissions and repeat steps 1 to 2 until all scissions are performed.
The simulation tool sets a limit of 10000 chains in order to ensure fast performance, although this number can be increased with simple modifications. The same set of initial chain lengths can be used for multiple simulations in order to determine the average effect of random or end scissions. The number averaged molecular weight, Mn (g/mol), weight averaged molecular weight, Mw (g/mol), and polydispersity index, PDI, of the polymer chains are calculated by the simulation tool according to eqs 1 and 2 Mn is calculated as the total weight of all chains divided by the number of chains:

Where Ntotal is the sum of polymer units in all chains, M0 is the molar mass (g/mol), and n is the total number of chains. Mw is the sum for all chains of molar mass multiplied by chain length, Ni, and the probability of a polymer unit lying in that chain, Ni/Ntotal:

The molecular weights are also calculated excluding water-soluble chains because they may be too small to be measured by GPC or may diffuse from the polymer. The maximum length of water soluble chains is manually chosen. Ntotal becomes the total number of polymer units of water-insoluble chains, n becomes the number of water-insoluble chains, and the summation in Eq. 2 considers only water-insoluble chains.
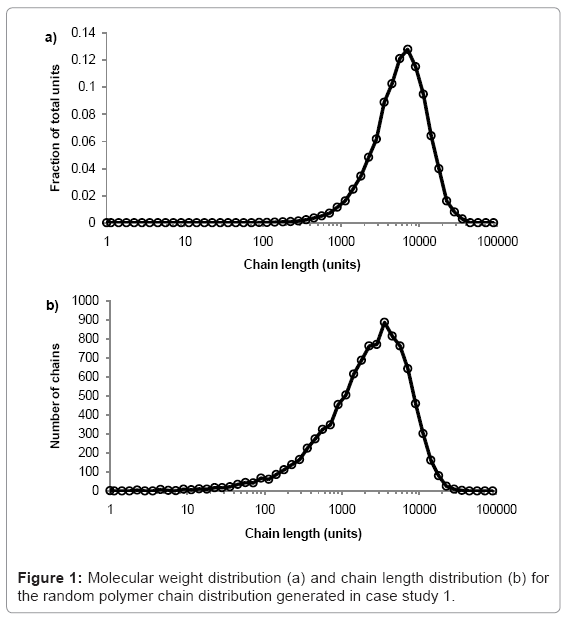
The simulation tool plots graphs of molecular weight distribution and chain-length distribution as demonstrated in case study 1.The fraction of the total polymer units that are contained within chains of given length-range is plotted on the molecular weight distribution graph. The ranges are chosen to have equal widths on a log scale, 10 divisions per order of magnitude. The number of chains within a given length-range is plotted on the chain length distribution graph, which is useful for analysis of low molecular weight chains. All calculations are visible in the simulation tool spreadsheet.
Case Studies
Case study 1: Initial test of molecular weight distribution
The simulation tool is used to produce a typical random PLA polymer of Mw=522000 g/mol, Mn=256000 g/mol, and PDI=2.02 by performing 9999 random scissions on a single chain of 35.5×10⁶ ester units with M0=72 g/mol. The molecular weight distribution is shown in figure 1a and the chain length distribution is shown in figure 1b.The peak of each curve is approximately 513000 and 257000 g/mol, which is in good agreement with the calculated values of Mw=515000 and Mn=256000 g/mol. Due to the random nature of the simulation, the results vary each time they are calculated but PDI is always≈2.
Case study 2: The effect of random and end scission
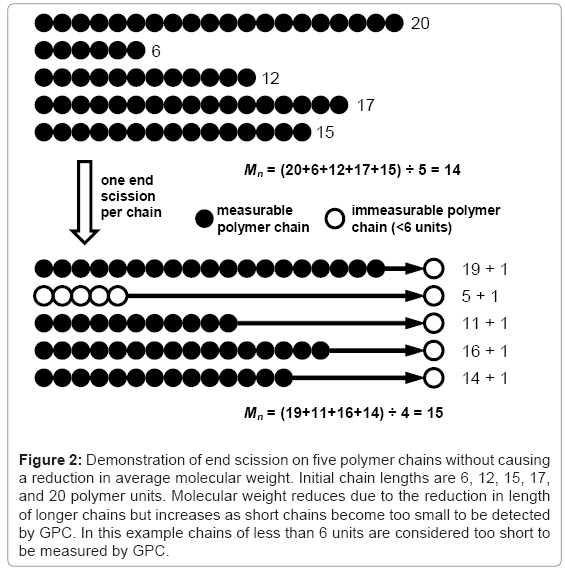
The effect of end scission and random scission on the reduction of molecular weight is tested for three polymers with molecular weights Mn≈40000, 120000, and 360000 g/mol and PDI≈2. The different polymers are simulated by performing 99 random scissions on initial chains of 55556, 166667, or 500000 units. Chains containing less than 12 units are considered to be water soluble [7] and are not included in the calculation of molecular weight. The results for Mn reduction and Mw reduction are given in Table 1 and Table 2 respectively. Each value is the average of 250 simulations. The average initial molecular weights are slightly higher than the nominal values due to some of the initial 99 scissions leading to water-soluble chains. The visual basic macro that is used to produce the results is included in the simulation tool. It can be seen that end scissions do not reduce molecular weight and can in fact cause it to increase due to low molecular weight chains being shortened below the solubility limit, as shown in Figure 2. In contrast, even a small number of random scissions cause a reduction in molecular weight. It has been reported that end scission may occur 100 times more frequently than random scission in PLA [1], in which case the results here indicate the degradation of molecular weight is due to random scission as opposed to end scission. It should be noted that for a very narrow molecular weight distribution, the effect of end scission is that Mn reduces at the same rate as the monomer weight fraction increases in the polymer. If the water-soluble chains are included in the calculation for molecular weight, the results are generally unaffected for Mw or random scission Mn, whereas results for end scission Mn become identical to random scission Mn.
| Polymer initial Mn (g/mol) | Reduction in Mn due to: | |||||
| 50 end scissions | 500 end scissions | 5000 end scissions | 5 random scissions | 50 random scissions | 500 random scissions | |
| 40506 | 0% | 0% | 0% | 5% | 33% | 82% |
| 120509 | 0% | 0% | 0% | 5% | 33% | 83% |
| 360483 | 0% | 0% | 0% | 5% | 33% | 83% |
Table 1: reduction in Mn due to end scission and random scission in case study 2.
| Polymer initial Mw (g/mol) | Reduction in Mw due to: | |||||
| 50 end scissions | 500 end scissions | 5000 end scissions | 5 random scissions | 50 random scissions | 500 random scissions | |
| 78905 | 0% | 0% | 1% | 4% | 33% | 83% |
| 237943 | 0% | -1% | -1% | 5% | 33% | 83% |
| 714741 | -1% | 0% | 0% | 5% | 33% | 83% |
Table 2: Reduction in Mw due to end scission and random scission in case study 2.
Figure 2: Demonstration of end scission on five polymer chains without causing a reduction in average molecular weight. Initial chain lengths are 6, 12, 15, 17, and 20 polymer units. Molecular weight reduces due to the reduction in length of longer chains but increases as short chains become too small to be detected by GPC. In this example chains of less than 6 units are considered too short to be measured by GPC.
Case study 3: Prediction of the water-soluble fraction of degrading polymers
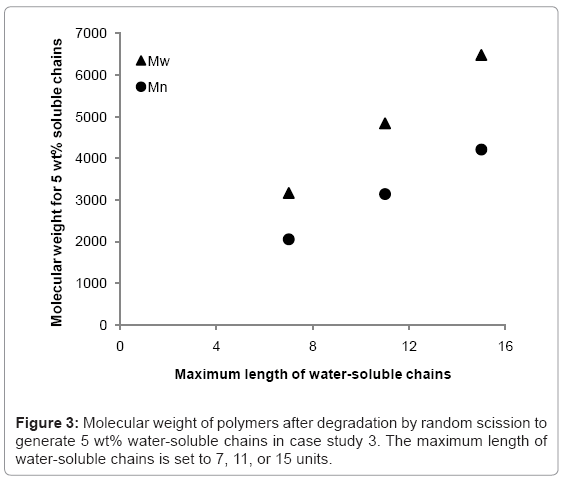
The simulation tool is able to calculate the fraction of the polymer that is water-soluble, which is equivalent to maximum possible mass loss due to the diffusion of water-soluble chains. The simulation tool is used to 1) determine the rate at which the fraction of waters-soluble chains increases, and 2) identify at what molecular weight the water-soluble chains account for 5% of total polymer mass (5 wt%) in a degrading polymer. Simulations are run for random scission and end scission of a random initial polymer chain distribution, which is generated by 99 random scissions of an initial chain containing 150000 units. The reported maximum length of water-soluble chains varies in the literature [7,9-12] so this study considers values of 7, 11, or 15 polymer units. The average initial values of molecular weight are Mn≈109000 and Mw≈214000 g/mol. For end scission, there is virtually no change in molecular weight when the polymer is degraded to the extent that water-soluble chains account for 5% of total mass. This is due to the phenomenon previously explained in Figure 2. Mass loss is therefore possible without any apparent degradation of molecular weight if end scission occurs. For random scission however, in order to achieve 5 wt% water-soluble chains, the molecular weight reduces to approximately 2100, 3100, or 4200 g/mol for Mn, and 3200, 4800, or 6500 g/mol for Mw, when the solubility limit is considered to be 8, 12, or 16 units respectively. The relationship between the solubility limit and the molecular weight at which 5 wt% of water-soluble chains are achieved is linear for random scission as can be seen in Figure 3. Each data point is the average of 100 simulations.
The simulations were also run for a polymer of monodisperse distribution, which consisted of 100 chains each containing 1500 units. For random scission, the results are almost identical to those for an initial random distribution because molecular weight reduces to such an extent that the initial distribution has little or no effect. The magnitude of initial molecular weight also has negligible effect for random scission. For end scission, a monodisperse initial distribution results in a molecular weight reduction of 5% in order to generate 5 wt% soluble chains.
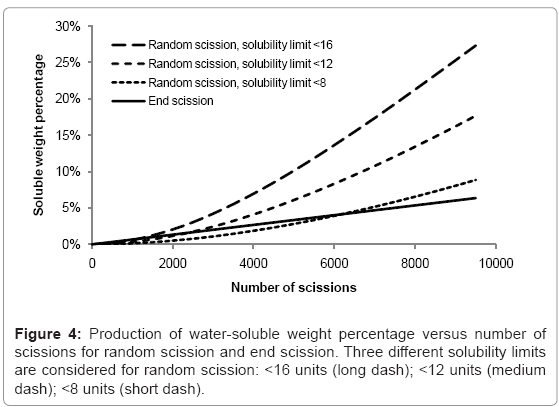
The rates of production of water-soluble chains for random scission and end scission are shown in Figure 4. The same random initial polymer chain distribution is used as before (150000 polymer units in 100 random chains) and the curves are the average of 100 simulations. For end scission, the soluble fraction increases linearly and is not sensitive to the solubility limit because monomers are always considered to be soluble. The effect of reducing chains beneath the solubility limit is negligible compared to the production of monomers. In contrast, random scission is sensitive to the solubility limit and the rate of production of water-soluble chains accelerates as the number of random scissions increases. In degradation experiments, there is often an initial delay followed by a sudden onset of mass loss. Since the simulated growth of the water soluble fraction due to random scission is quite slow, this work supports the theory of autocatalysis, that the rate of chain scission increases during degradation [13].
Case study 4: Comparison of molecular weight distribution to experimental data
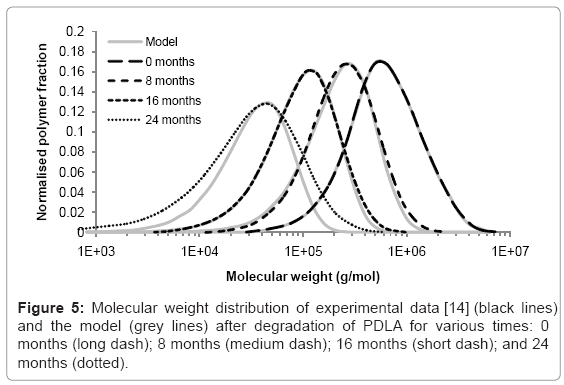
The simulation tool can be used to model the changes to molecular weight distribution for a polymer during degradation. Tsuji [14] measured the molecular weight distribution of poly D-lactic acid films during hydrolysis in phosphate buffer solution (pH 7.4) at 37°C. Measurements were taken after 0, 8, 16, and 24 months in the degradation solution. The initial molecular weight distribution used in the simulation tool was derived from the experimental data at time=0. It consisted of 425 polymer chains. The best fitting of simulated molecular weight distributions to the experimental data was achieved by performing 800, 1750, and 5300 random scissions in the time periods 0-8, 8-16, and 16-24 months respectively. The increase in scission rate supports the theory of autocatalysis [13]. The simulated and experimental distributions are shown in Figure 5. Each curve is the average of 200 simulations. The molecular weight distributions generated by the simulation tool are similar to the distributions measured by GPC which suggests that molecular weight degradation is due to random scission. After 24 months, the simulated and experimental curves begin to diverge because the polydispersity of the samples increases which cannot be accounted for by random scission. Although an increase in polydispersity could be achieved by a simple combination of random scission and end scission, the resulting molecular weight distribution simply includes a sharp peak at a molecular weight of 72 g/mol, so the fitting between simulated and experimental curves is not improved, and in any case it is likely that the monomers are too small to be detected by GPC. These results may suggest that in the late stages of degradation, chain scission occurs preferentially towards the end of chains, but not only in the final bond, or preferentially in shorter chains.
Conclusions
The simulation tool can be used to simulate end scission and random scission for a manually entered distribution of initial polymer chains. Case studies have demonstrated the use of the simulation tool. It is possible to generate a random initial distribution of chain lengths with PDI≈2. The case studies also generated some interesting findings about the effect of random scission and end scission. Random scission has over 1000 times more impact than end scission on the reduction of molecular weight. However, for 5 wt% mass loss to be attributed to the diffusion of water-soluble small chains, produced as a result of random scission, Mn must reduce to <5000 g/mol. This value of Mn reduces as the assumed solubility limit of small chains reduces. In contrast, end scission may produce 5 wt% soluble chains with no reduction of Mn. The fraction of water-soluble small chains increases linearly with the number of end scissions but increases accelerated with random scissions. Simulated distributions of molecular weight due to random scission are similar to experimental molecular weight distributions during hydrolysis of PDLA for up to 18 months of degradation. The simulation tool is freely available and can be simply modified if desired.
Supplementary Information
A preview of the spreadsheet is shown in Figure 6. The user must enable the macros when prompted upon first opening the spreadsheet. The macros that are used to simulate random scission, end scission, and produce the results for case studies 2-3 can be analysed and edited.
References
- Shih C (1995) Chain-end scission in acid catalyzed hydrolysis of poly (D,L-lactide) in solution. Journal of Controlled Release 34: 9-15.
- Gleadall A, Pan J, Atkinson H (2012) A simplified theory of crystallisation induced by polymer chain scissions for biodegradable polyesters. Polymer Degradation and Stability 97: 1616-1620.
- Antheunis H, van der Meer JC, de Geus M, Kingma W, Koning CE (2009) Improved Mathematical Model for the Hydrolytic Degradation of Aliphatic Polyesters. Macromolecules 42: 2462-2471.
- Antheunis H, van der Meer JC, de Geus M, Heise A, Koning CE (2010) Autocatalytic Equation Describing the Change in Molecular Weight during Hydrolytic Degradation of Aliphatic Polyesters. Biomacromolecules 11: 1118-1124.
- Han X, Pan J (2009) A model for simultaneous crystallisation and biodegradation of biodegradable polymers. Biomaterials 30: 423-430.
- Batycky RP, Hanes J, Langer R, Edwards DA (1997) A theoretical model of erosion and macromolecular drug release from biodegrading microspheres. J Pharm Sci 86: 1464-1477.
- Schliecker G, Schmidt C, Fuchs S, Kissel T (2003) Characterization of a homologous series of d,l-lactic acid oligomers; a mechanistic study on the degradation kinetics in vitro. Biomaterials 24: 3835-3844.
- de Jong SJ, Arias ER, Rijkers DTS, van Nostrum CF, Kettenes-van den Bosch JJ, et al. (2001) New insights into the hydrolytic degradation of poly(lactic acid): participation of the alcohol terminus. Polymer 42: 2795-2802.
- Vey E, Roger C, Meehan L, Booth J, Claybourn M, et al. (2008) Degradation mechanism of poly(lactic-co-glycolic) acid block copolymer cast films in phosphate buffer solution. Polymer Degradation and Stability 93: 1869-1876.
- Lyu, Schley J, Loy B, Lind D, Hobot C, et al. (2007) Kinetics and Time-Temperature Equivalence of Polymer Degradation. Biomacromolecules 8: 2301-2310.
- Buchanan FJ (2008) Degradation rate of bioresorbable materials: Prediction and evaluation. Woodhead Publishing/CRC Press, Cambridge, England/Boca Raton [FL].
- Hoglund A, Hakkarainen M, Albertsson AC (2009) Migration and Hydrolysis of Hydrophobic Polylactide Plasticizer. Biomacromolecules 11: 277-283.
- Siparsky GL, Voorhees KJ, Miao F (1998) Hydrolysis of polylactic acid (PLA) and polycaprolactone (PCL) in aqueous acetonitrile solutions: Autocatalysis. Journal of Environmental Polymer Degradation 6: 31-41.
- Tsuji H (2002) Autocatalytic hydrolysis of amorphous-made polylactides: effects of L-lactide content, tacticity, and enantiomeric polymer blending. Polymer 43: 1789-96.
Relevant Topics
- Agricultural biotechnology
- Animal biotechnology
- Applied Biotechnology
- Biocatalysis
- Biofabrication
- Biomaterial implants
- Biomaterial-Based Drug Delivery Systems
- Bioprinting of Tissue Constructs
- Biotechnology applications
- Cardiovascular biomaterials
- CRISPR-Cas9 in Biotechnology
- Nano biotechnology
- Smart Biomaterials
- White/industrial biotechnology
Recommended Journals
Article Tools
Article Usage
- Total views: 16772
- [From(publication date):
May-2013 - Nov 24, 2025] - Breakdown by view type
- HTML page views : 11826
- PDF downloads : 4946

