Changes in the Terrestrial Carbon Cycle of China during the 2010 Drought
Received: 30-Apr-2013 / Accepted Date: 13-Jun-2013 / Published Date: 18-Jun-2013 DOI: 10.4172/2157-7617.1000141
Abstract
Satellite remote sensing was combined with the NASA-CASA (Carnegie Ames Stanford Approach) carbon cycle simulation model to evaluate the impact of the 2010 drought throughout China. Results indicated that net primary production (NPP) for 2010 declined most notably in the provinces of Xinjiang, Hebei, and Zhejiang, predominantly in cropland and mixed forest areas. Annual NPP in the most drought-impacted areas of southwestern China declined by an average of 13% compared to the previous 10-year average. The greatest decline in total ecosystem carbon gain during 2010 (compared to 2000 to 2009) was detected in the provinces of Yunnan (-28.1 Tg C), Tibet (-18.8 Tg C), and Guizhou, (-6.3 Tg C) predominantly in cropland, grassland, and mixed forest areas. Despite these drought impacts over the southwest and northern regions, the CASA model estimated that China gained total ecosystem carbon in 2010 at double the mean annual rate (computed for the period 2000 to 2009). Cropland and forest areas of Heilongjiang and Inner Mongolia remained productive in 2010 and these regions were estimated, along with several other provinces, to offset and exceed declines in plant production and total ecosystem carbon losses in the most drought-impacted areas of Tibet, Guizhou, Yunnan, Xinjiang, and Zhejiang provinces.
Keywords: China; Drought; carbon cycle; MODIS
9680Introduction
China experienced a severe drought during 2009 and 2010, particularly in southwestern and northern provinces, where the accumulated precipitation from May 2009 to April 2010 was 25% below normal [1]. This included the longest recorded period of zero precipitation during a winter season (October–February) in the past 50 years in some provinces, and the lowest percentage rainfall anomaly over the same season since 1880. The most extreme drought conditions were experienced by the end of March 2010 in the southern provincial areas of Tibet, Qinghai, Yunnan, Sichuan, Guizhou, and Guangxi, and moderate drought conditions extended into much of them northern provincial areas of Shanxi, Hebei, and Inner Mongolia by the end of July 2010 (Figure 1) [2].
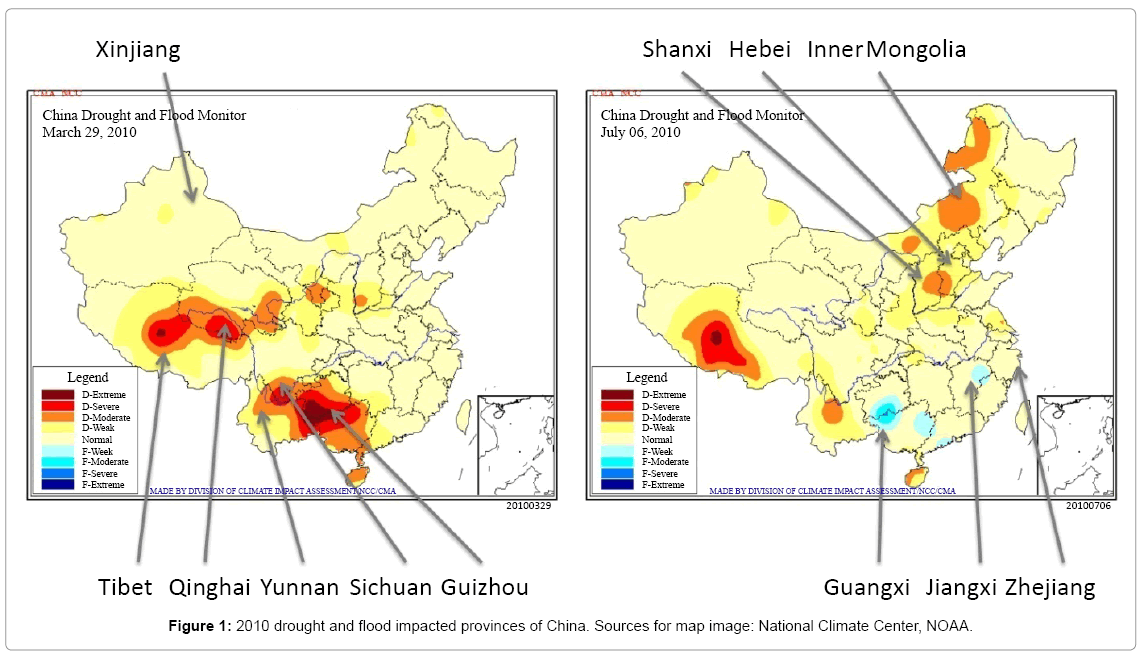
Figure 1: 2010 drought and flood impacted provinces of China. Sources for map image: National Climate Center, NOAA.
One of the most important impacts of severe drought on a region is the loss of plant production due to extreme heat and soil moisture stress [3]. Such losses can lead to crop failures, reduction in livestock herds, hardening of soils, and wildfires, all in association with depletion of river flow and groundwater aquifers. Consequently, changes in plant production and carbon cycling between baseline years (with more normal weather conditions) and years of extreme drought can be a valuable assessment indicator.
Net primary production (NPP) by vegetation provides the chemical energy that drives most biotic processes on Earth. NPP represents much of the carbon that is consumed by microbes and animals. Climate controls on plant production are an issue of central relevance to society, mainly because of concerns about the extent to which NPP in managed ecosystems can provide human populations with adequate forage and fiber products. In areas where NPP is not harvested for human use, the carbon in dead plant biomass returns to the atmosphere mainly as CO2 from decomposition by microbial respiration (Rh). The difference between NPP and Rh on the same time scale is called net ecosystem production (NEP), which represents the net sink or source of atmospheric CO2 from terrestrial ecosystems and the most complete indicator of carbon exchange in land areas.
In this study, we summarized results from the CASA (Carnegie- Ames-Stanford Approach) model for estimated NPP and NEP across all of China during 2010, and compared these fluxes to 10 previous baseline years of NPP and NEP estimates. Direct input of satellite vegetation index “greenness” data from the NASA moderate resolution imaging spectroradiometer (MODIS) satellite sensor into the simulation model with regional climate records was used to estimate spatial variability in monthly NPP and NEP at a ground resolution of 8-km [4,5]. These CASA model results have been designed to be spatially detailed enough to support drought impact assessments in different vegetation and land use types, e.g., grasslands, woodlands, forests, and wetland areas [6].
Methods
Monthly NPP of vegetation from the CASA model was predicted using the relationship between greenness reflectance properties and the fraction of absorption of photosynthetically active radiation (fPAR), assuming that net conversion efficiencies of PAR to plant carbon can be approximated for different ecosystems or are nearly constant across all ecosystems [7-9]. For this study, we used MODIS collection 5 of the Enhanced Vegetation Index [10] as model inputs for PAR interception, aggregated for regional assessments to an 8-km spatial resolution. Monthly 0.05° data (MOD13C2 version 005) from the USGS Land Processes data center (LP DAAC) was multiplied by 0.0001 to scale the data to the standard MODIS EVI value range. The MOD13C2 product provided the greatest assurance of high-quality, cloud-free EVI inputs to our carbon cycle model. Gap-filling and temporal smoothing procedures are commonly accepted methods for unifying multi-year satellite EVI data sets in cloudy regions [11]. In order to calculate annual CASA NPP, these procedures must be applied to fill cloud- (or aerosol-) contaminated observations, since plant photosynthesis continues during daylight hours regardless of cloud cover [6].
As documented in Potter [12], monthly production of plant biomass is estimated as a product of time-varying surface solar irradiance, Sr, and EVI (for fPAR) from the MODIS sensor, plus a constant light utilization efficiency term (emax) that is modified by time-varying stress scalar terms for temperature (T) and moisture (W) effects (Equation 1, NPP in units of g C m-2 mo-1).
NPP = Sr EVI emax T W (1)
The CASA emax term was set uniformly at 0.55 g C MJ-1 PAR, an approach that derives from calibration of predicted annual NPP to previous field estimates [4]. This model setting has been successfully validated globally (with a high level of statistical significance, i.e., R2>0.9) by comparing predicted annual NPP to more than 1900 field measurements of NPP [12], and against numerous Fluxnet eddy covariance tower site measurements of NPP from 2000-2007 [13]. Gridded monthly climate inputs for these CASA runs were from National Center for Environmental Prediction (NCEP) reanalysis products [14]. Land cover settings were aggregated from the MODIS global 1-km product [6].
The T stress scalar in Equation 1 was computed with reference to derivation of optimal temperatures (Topt) for plant production. The Topt setting will vary by latitude and longitude, ranging from just above 0°C in the Arctic to the middle thirties in low latitude deserts. The W stress scalar was estimated from monthly water deficits, based on a comparison of moisture supply (precipitation and stored soil water) to potential evapotranspiration (PET) demand using the methods described by Potter [15]. The soil model design includes three-layer heat and moisture content computations: surface organic matter, topsoil (0.3 m), and subsoil to rooting depth (1 to 10 m). Maximum rooting depth for cropland and grassland cover types was set at 1 m, whereas non-tropical forest was set at 2 m and tropical forest was set at 10 m [15]. These layers can differ in soil texture, moisture holding capacity, and carbon-nitrogen dynamics. Water balance in the soil was modeled as the difference between precipitation or volumetric percolation inputs, monthly estimates of PET, and the drainage output for each layer.
Inputs from rainfall can recharge the soil layers to field capacity. Excess water percolates through to lower layers and may eventually leave the system as seepage and runoff. The CASA model is designed to couple daily and seasonal patterns in soil nutrient mineralization and soil heterotropic respiration (Rh) of CO2 from soils. The CASA soil carbon model uses a set of compartmental difference equations [15]. First-order decay equations simulate exchanges of decomposing plant residue (metabolic and structural fractions) at the soil surface. The model also simulates surface soil organic matter (SOM) fractions that presumably vary in age and chemical composition. Turnover of active (microbial biomass and labile substrates), slow (chemically protected), and passive (physically protected) fractions of the SOM are represented. Monthly and annual NEP was computed as NPP minus Rh fluxes, excluding the effects of small-scale fires and other localized disturbances or vegetation regrowth patterns on carbon fluxes. Global CASA NEP predictions have been validated previously against numerous Fluxnet eddy covariance tower site measurements of NEP from 2000-2007 [16].
Results
Annual NPP on a unit area basis (g C m-2) was estimated to be highest over the period 2000-2010 within evergreen forest, savanna and cropland vegetation classes of China (Figure 2). The highest annual NPP on a unit area basis was detected in these vegetation classes within the provinces of Guangxi, Guizhou, Guangdong, Tibet, Hainan, and Yunnan (Table 1). The annual NPP ranking of provinces changes somewhat when total land area is factored into the assessment, with the leading provinces ordered (with highest total NPP first) as Yunnan, Sichuan, Heilongjiang, Inner Mongolia, Tibet, and Guangxi (Figure 3a). At the national level, the vegetation classes ranked with highest total 2010 NPP were (in order of highest first) were cropland, evergreen forest, grassland, and savanna. Total NPP for 2010 was estimated at 2.9 Pg [1015 g] C for the entire country.
| Evergreen Broadleaf forest | Evergreen Needleleaf forest | Deciduous Needleleaf forest | Mixed forest | savana | Grassland | Barren | Cropland | Deciduous Broadleaf forest | Open Shrubland | |
|---|---|---|---|---|---|---|---|---|---|---|
| provience | 1 | 2 | 3 | 5 | 6 | 7 | 8 | 10 | 11 | 13 |
| Gansu | 288 | 478 | 457 | 285 | 39 | 361 | 475 | 105 | ||
| Qinghai | 281 | 286 | 228 | 296 | 46 | 330 | 453 | 133 | ||
| Guangxi | 842 | 706 | 757 | 667 | 777 | 283 | ||||
| Chongqing | 595 | 525 | 499 | 481 | 558 | 469 | ||||
| Beijing | 336 | 337 | 363 | 308 | 412 | 345 | ||||
| Fujian | 609 | 561 | 530 | 581 | 495 | 562 | ||||
| Anhui | 484 | 269 | 471 | 478 | 424 | 527 | ||||
| Guangdong | 731 | 588 | 639 | 683 | 672 | 422 | ||||
| Tibet | 735 | 431 | 490 | 305 | 251 | 69 | 422 | 526 | 141 | |
| Xinjiang | 153 | 306 | 306 | 328 | 163 | 44 | 292 | 133 | ||
| Hainan | 938 | 731 | 801 | 696 | 802 | |||||
| Ningxia | 365 | 77 | 162 | 62 | 221 | 348 | 101 | |||
| Shaanxi | 473 | 387 | 152 | 400 | 477 | 145 | ||||
| Shanxi | 307 | 408 | 250 | 198 | 220 | 325 | 485 | 164 | ||
| Hubei | 310 | 491 | 482 | 506 | 429 | 494 | 304 | |||
| Hunan | 612 | 475 | 507 | 475 | 423 | 438 | 507 | |||
| Sichuan | 600 | 441 | 554 | 530 | 436 | 159 | 581 | 538 | 331 | |
| Yunnan | 810 | 530 | 660 | 703 | 587 | 247 | 638 | 700 | 457 | |
| Hebei | 362 | 334 | 241 | 53 | 337 | 375 | 328 | |||
| Henan | 488 | 479 | 482 | 462 | 498 | 439 | ||||
| Liaoning | 632 | 578 | 391 | 132 | 524 | 697 | 225 | |||
| Shandong | 321 | 242 | 253 | 56 | 359 | 217 | ||||
| Tianjin | 68 | 312 | ||||||||
| Jiangxi | 614 | 467 | 499 | 467 | 330 | 398 | ||||
| Jiangsu | 209 | 384 | 284 | 346 | 108 | 405 | ||||
| Shanghai | 340 | 358 | ||||||||
| Zhejiang | 442 | 441 | 231 | 457 | 428 | 436 | 298 | 362 | 282 | |
| Jilin | 595 | 467 | 394 | 649 | 603 | |||||
| InnerMongolia | 130 | 318 | 350 | 344 | 151 | 36 | 344 | 373 | 96 | |
| Heilongjiang | 440 | 343 | 462 | 431 | 384 | 347 | 460 | 587 | 410 | |
| Hong Kong | ||||||||||
| Taiwan | 755 | 577 | 652 | 716 | 682 |
Table 1: CASA average NPP flux (grams Cm-2 yr-1) in 2012 for chinese provinces by vegetation cover class. Shaded cells indicate the highest mean NPP flux values for the country.
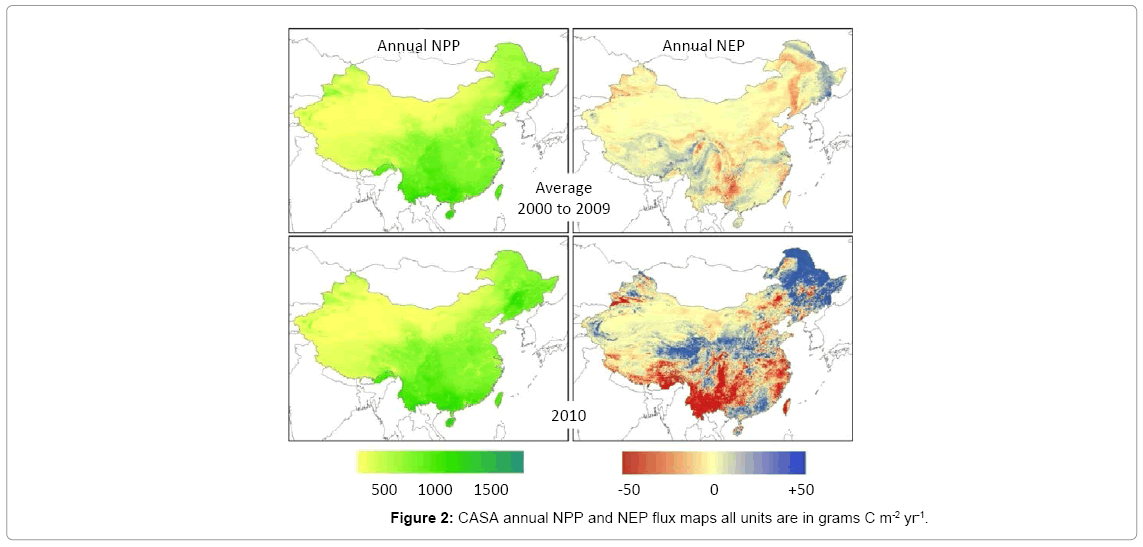
Figure 2: CASA annual NPP and NEP flux maps all units are in grams C m-2 yr-1.
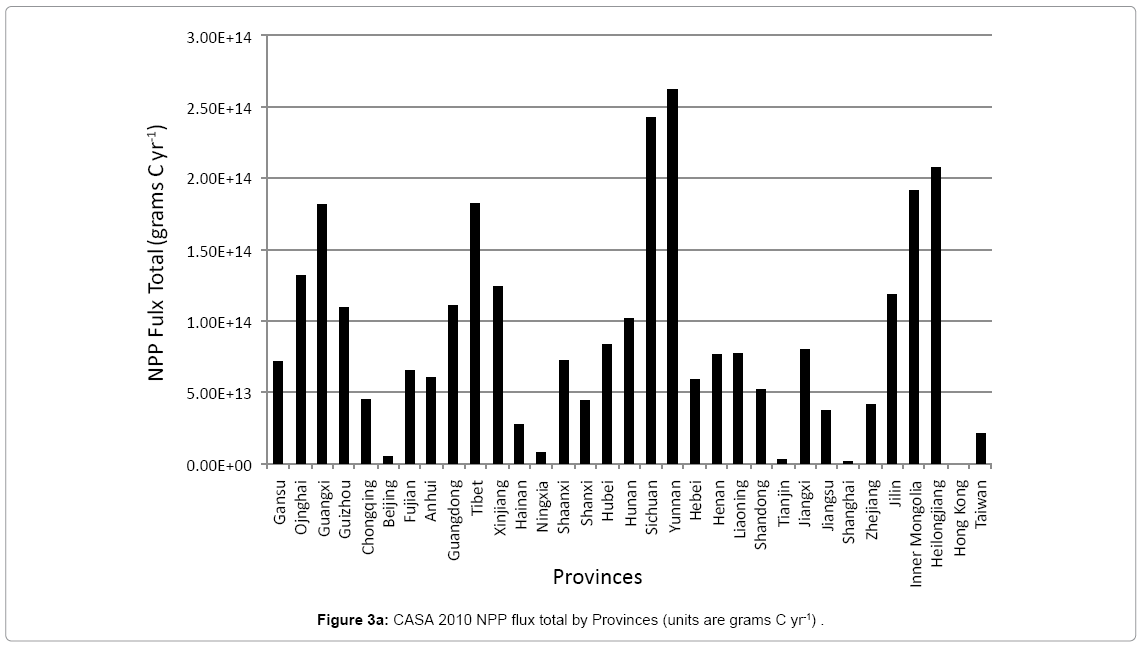
Figure 3a: CASA 2010 NPP flux total by Provinces (units are grams C yr-1) .
The greatest decline in total annual NPP during 2010 (compared to the mean total NPP from 2000 to 2009) was detected in the provinces of Xinjiang (-4.6 Tg [1012 g] C) and Zhejiang (-3.1 Tg C), predominantly in cropland and mixed forest areas (Figure 3b). Cropland NPP declined similarly in 2010 within the provinces of Sichuan, Hebei, Shandong, Tianjin, Jiangxi, Jiangsu, and Shanghai (between -0.1 and -1.9 Tg C). These declines in total annual NPP were offset however by increases in total 2010 NPP (compared to the mean total NPP from 2000 to 2009) in cropland, grassland, and mixed forest vegetation classes in the other provinces of the country. Notable increases in total 2010 NPP were detected in cropland areas of Heilongjiang, Inner Mongolia, and Jilin, and in grassland cover areas of Qinghai and Tibet. The net increase in total NPP for 2010 was estimated at 132 Tg C for the entire country, relative to the mean total NPP from 2000 to 2009.
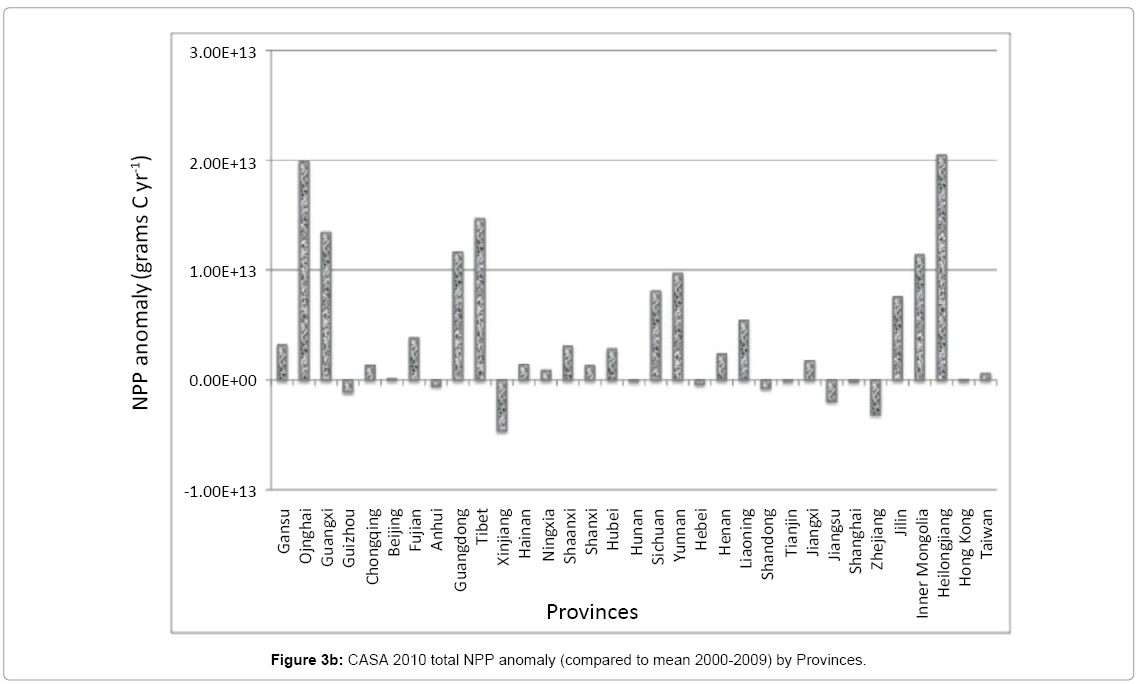
Figure 3b: CASA 2010 total NPP anomaly (compared to mean 2000-2009) by Provinces. Gansu
The greatest decline in total annual NEP during 2010 (compared to the mean total NEP from 2000 to 2009) was detected in the provinces of Yunnan (-28.1 Tg C), Tibet (-18.8 Tg C), and Guizhou, (-6.3 Tg C) predominantly in cropland, grassland, and mixed forest areas (Figure 3c). These declines in total annual NEP were offset however by increases in total 2010 NEP (compared to the mean total NEP from 2000 to 2009) of cropland areas in the other provinces of the country (Figure 2) (Zhao and Running, 2010). Modest increases in total 2010 NEP of between +2 and + 9 Tg C were detected in cropland areas of Heilongjiang, Inner Mongolia, Jilin, Henan, Liaoning, Shaanxi, and Shanxi. Mixed forest areas of Heilongjiang and Inner Mongolia were detected with similar increases of total NEP for 2010. China’s total NEP flux for 2010 was estimated at +12.6 Tg C for the entire country (Table 2), a net increase of +6.3 Tg C, compared to the mean total NEP from 2000 to 2009 represented in Figure 2.
| Evergreen Broadleaf Forest | Evergreen Needle leaf forest | Decidious Needle leaf forest | Mixed Forest | savanna | Grasslands | Barren | Cropland | Decidious Broadleaf forest | Open Shrubland | SUM | |
|---|---|---|---|---|---|---|---|---|---|---|---|
| Provience | 1 | 2 | 3 | 5 | 6 | 7 | 8 | 10 | 11 | 13 | |
| Gansu | 0.00E+00 | 5.06E+12 | 0.00E+00 | -2.87E+11 | 4.78E+09 | 2.21E+12 | -1.18E+11 | 1.00E+00 | -1.66E+10 | 9.02E+10 | 2.89E+12 |
| Quinghai | 0.00E+00 | 1.70E+09 | 0.00E+00 | 5.17E+09 | -2.59E+08 | 1.09E+13 | 8.97E+11 | 2.79E+10 | 1.63E+09 | 2.38E+12 | 1.42E+13 |
| Guangxi | 1.73E+11 | 0.00E+00 | 0.00E+00 | -1.28E+12 | -2.36E+12 | -2.68E+10 | 0.00E+00 | 4.46E+11 | -2.15E+19 | -3.05E+12 | |
| Guzhhua | 0.00E+00 | -8.13E+09 | 0.00E+00 | -2.14E+12 | -1.88E+12 | -2.57E+10 | 0.00E+00 | -4.18E+12 | -8.23E+12 | ||
| Chongqing | 0.00E+00 | -1.21E+10 | 0.00E+00 | -4.20E+11 | -1.10E+11 | 1.65E+09 | 0.00E+00 | -1.42E+12 | -5.02E+08 | -1.96E+12 | |
| Beijing | 0.00E+00 | 0.00E+00 | 0.00E+00 | -2.23E+09 | 4.00E+08 | -1.30E+09 | 0.00E+00 | -3.84E+10 | -2.43E+09 | 2.06E+09 | -3.74E+10 |
| Fujian | -2.41E+11 | -1.19E+11 | 0.00E+00 | -1.26E+12 | -1.96E+11 | -8.86E+08 | 0.00E+00 | -1.14E+11 | -1.93E+12 | ||
| Anhui | -2.51E+09 | 9.44E+08 | 0.00E+00 | -8.55E+11 | -1.13E+11 | 0.00E+00 | 0.00E+00 | -6.05E+11 | -1.83E+10 | -1.59E+12 | |
| Guangdong | 1.23E+12 | 4.64E+09 | 0.00E+00 | 7.61E+10 | 9.20E+11 | 0.00E+00 | 0.00E+00 | 1.72E+12 | 1.02E+09 | 3.95E+12 | |
| Tibet | -2.24E+10 | -6.05E+11 | 0.00E+00 | -4.14E+11 | -3.36E+09 | -6.06E+12 | -1.44E+12 | -2.99E+10 | -3.51E+10 | -3.35E+12 | -1.20E+13 |
| Xinjiang | 0.00E+00 | -1.15E+11 | 2.61E+09 | -2.16E+11 | -2.77E+09 | 8.14E+11 | 3.99E+12 | -6.61E+12 | 8.29E+11 | 4.64E+12 | |
| Hainan | 1.74E+11 | 0.00E+00 | 0.00E+00 | 1.63E+09 | 1.88E+10 | -4.21E+08 | 0.00E+00 | -1.10E+11 | 9.33E+10 | ||
| Ningxia | 0.00E+00 | 0.00E+00 | 0.00E+00 | -1.68E+08 | -2.24E+08 | 6.57E+11 | 3.90E+09 | 2.80E+10 | -5.63E+08 | 2.42E+11 | 9.29E+11 |
| Shaanxi | 0.00E+00 | 0.00E+00 | 0.00E+00 | -2.26E+11 | 9.85E+10 | -4.21E+08 | 0.00E+00 | 2.10E+12 | 1.96E+11 | 7.07E+10 | 3.42E+12 |
| Shanxi | 0.00E+00 | 2.78E+10 | 0.00E+00 | 1.85E+11 | 3.45E+10 | 2.07E+11 | 1.76E+09 | 1.68E+12 | 3.39E+09 | -1.01E+09 | 2.21E+12 |
| Hubei | -5.49E+09 | 0.00E+00 | 0.00E+00 | -8.27E+11 | -5.57E+11 | 3.61E+09 | 0.00E+00 | 1.12E+12 | -5.84E+10 | 0.00E+00 | -3.26E+11 |
| Hunan | 2.32E+09 | 2.31E+09 | 0.00E+00 | -1.64E+12 | -1.32E+12 | -1.18E+10 | 0.00E+00 | -5.57E+11 | -1.49E+09 | 1.36E+11 | -3.52E+12 |
| Sichuan | -1.57E+10 | -1.45E+11 | 0.00E+00 | -1.63E+12 | -1.28E+10 | 2.83E+12 | 4.98E+09 | -1.77E+12 | -5.85E+10 | -8.27E+10 | -6.63E+11 |
| yunnan | -6.69E+12 | -2.58E+11 | 0.00E+00 | -1.10E+13 | -3.79E+12 | -2.11E+12 | -1.63E+10 | -2.87E+12 | -3.93E+10 | 5.23E+09 | -2.68E+13 |
| Hebei | 0.00E+00 | 0.00E+00 | 0.00E+00 | 4.84E+09 | 2.21E+10 | 1.98E+11 | -7.40E+09 | -7.79E+11 | 1.85E+10 | 5.77E+09 | -5.38E+11 |
| Henan | 0.00E+00 | 0.00E+00 | 0.00E+00 | 4.43E+10 | 9.83E+09 | 1.11E+10 | 0.00E+00 | 2.37E+12 | 4.14E+10 | -2.00E+09 | 2.48E+12 |
| Liaoning | 0.00E+00 | 0.00E+00 | 0.00E+00 | 2.94E+10 | -5.19E+09 | -9.18E+09 | -6.58E+08 | 7.55E+11 | 2.25E+10 | 3.05E+09 | 7.90E+11 |
| Shandong | 0.00E+00 | 0.00E+00 | 0.00E+00 | -1.66E+09 | 2.91E+09 | 2.36E+09 | -9.63E+09 | 6.50E+11 | 0.00E+00 | 0.00E+00 | 6.47E+11 |
| Tianjin | 0.00E+00 | 0.00E+00 | 0.00E+00 | 0.00E+00 | 0.00E+00 | 0.00E+00 | -2.21E+09 | -8.56E+10 | 0.00E+00 | 0.00E+00 | -8.78E+10 |
| Jiangxi | 2.95E+11 | -9.09E+09 | 0.00E+00 | 2.49E+11 | 9.03E+10 | -1.54E+09 | 0.00E+00 | -2.41E+11 | 0.00E+00 | 0.00E+00 | 3.82E+11 |
| Jiangsu | 0.00E+00 | -1.10E+10 | -1.23E+09 | -2.70E+10 | -1.31E+10 | 0.00E+00 | 2.36E+09 | -1.15E+12 | 0.00E+00 | -1.68E+09 | -1.20E+11 |
| Shanghai | 0.00E+00 | 0.00E+00 | 0.00E+00 | 0.00E+00 | -1.19E+10 | 0.00E+00 | 0.00E+00 | -1.23E+11 | 0.00E+00 | 0.00E+00 | -1.24E+11 |
| Zhejiang | -2.24E+10 | -1.21E+10 | -4.51E+09 | -2.02E+12 | 9.46E+10 | 1.84E+09 | -3.01E+07 | -6.65E+11 | 0.00E+00 | 9.13E+10 | -2.82E+11 |
| jilin | 0.00E+00 | 0.00E+00 | 0.00E+00 | 2.05E+12 | 2.31E+09 | 8.29E+10 | 0.00E+00 | 3.10E+12 | 8.06E+11 | 1.86E+11 | 6.04E+12 |
| Inner Mongolia | 0.00E+00 | -8.02E+08 | 1.76E+11 | 3.76E+12 | 9.29E+11 | 2.84E+12 | -6.77E+11 | 5.10E+12 | 3.35E+10 | 0.00E+00 | 1.23E+13 |
| Heilongjiang | 0.00E+00 | 9.25E+09 | 8.07E+10 | 1.02E+13 | 1.36E+12 | 6.20E+11 | 2.44E+10 | 9.65E+12 | 1.88E+12 | 0.00E+00 | 2.41E+13 |
| Hong Kong | -2.39E+09 | 0.00E+00 | 0.00E+00 | 4.02E+08 | -1.23E+09 | 0.00E+00 | 0.00E+00 | 0.00E+00 | 0.00E+00 | 0.00E+00 | -3.22E+09 |
| Taiwan | -9.25E+11 | -3.67E+10 | 0.00E+00 | -2.34E+11 | -3.78E+10 | 0.00E+00 | 0.00E+00 | -2.67E+11 | 0.00E+00 | 9.38E+11 | -1.50E+12 |
| TOTAL | -6.04E+12 | -2.28E+14 | 2.53E+11 | -7.32E+12 | -7.00E+12 | 1.36E+13 | 2.65E+12 | 1.14E+13 | 2.78E+12 | 1.26E+13 |
Table 2: CASA total NEp flyx (grams C yr-1)in 2012 for chinise proviences by vegetation class. Net source fluxes of C to the atmosphere are represented as negative values, where net sink fluxes of C in to ecosystems from the atmisphere are represented in positive values.
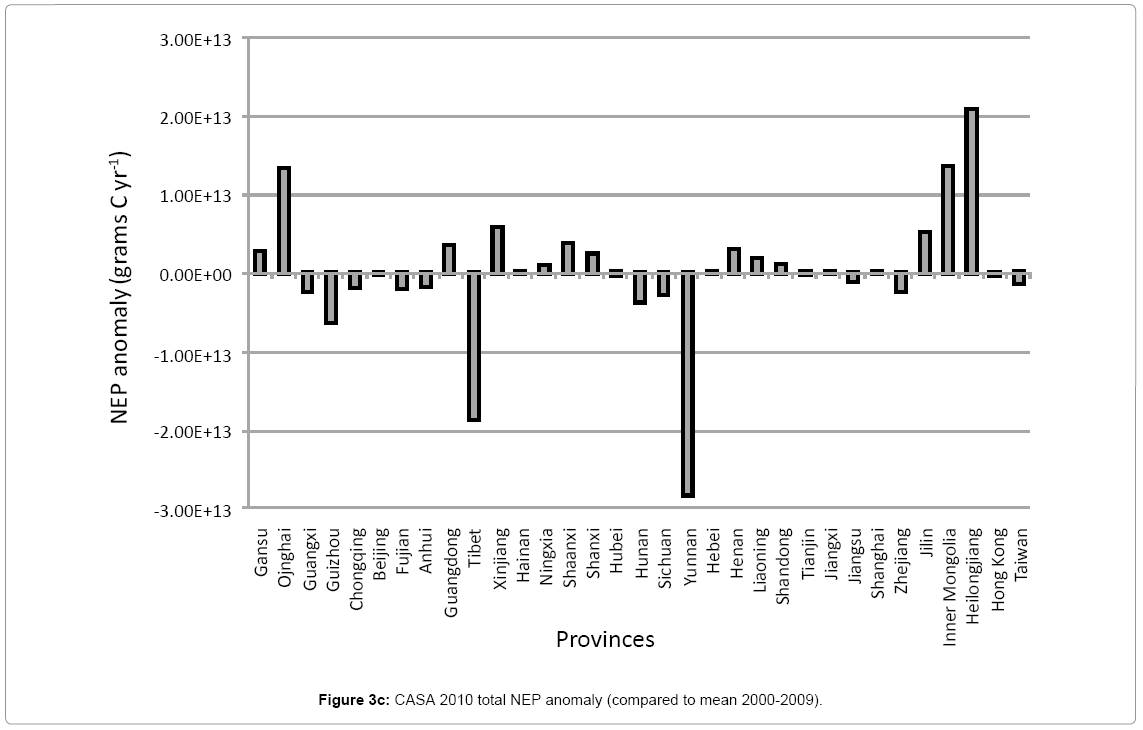
Figure 3c: CASA 2010 total NEP anomaly (compared to mean 2000-2009).
Examples of CASA monthly NEP flux predictions for selected provinces with among the highest areas of forest, grassland, and cropland cover showed that drought-impacted ecosystems generally had lower estimated net carbon gains from January to June 2010 than did lesser drought-impacted ecosystems (Figure 4). For instance, average forest NEP fluxes in eilongjiang far exceeded (in the positive direction) those in Yunnan from April to July.
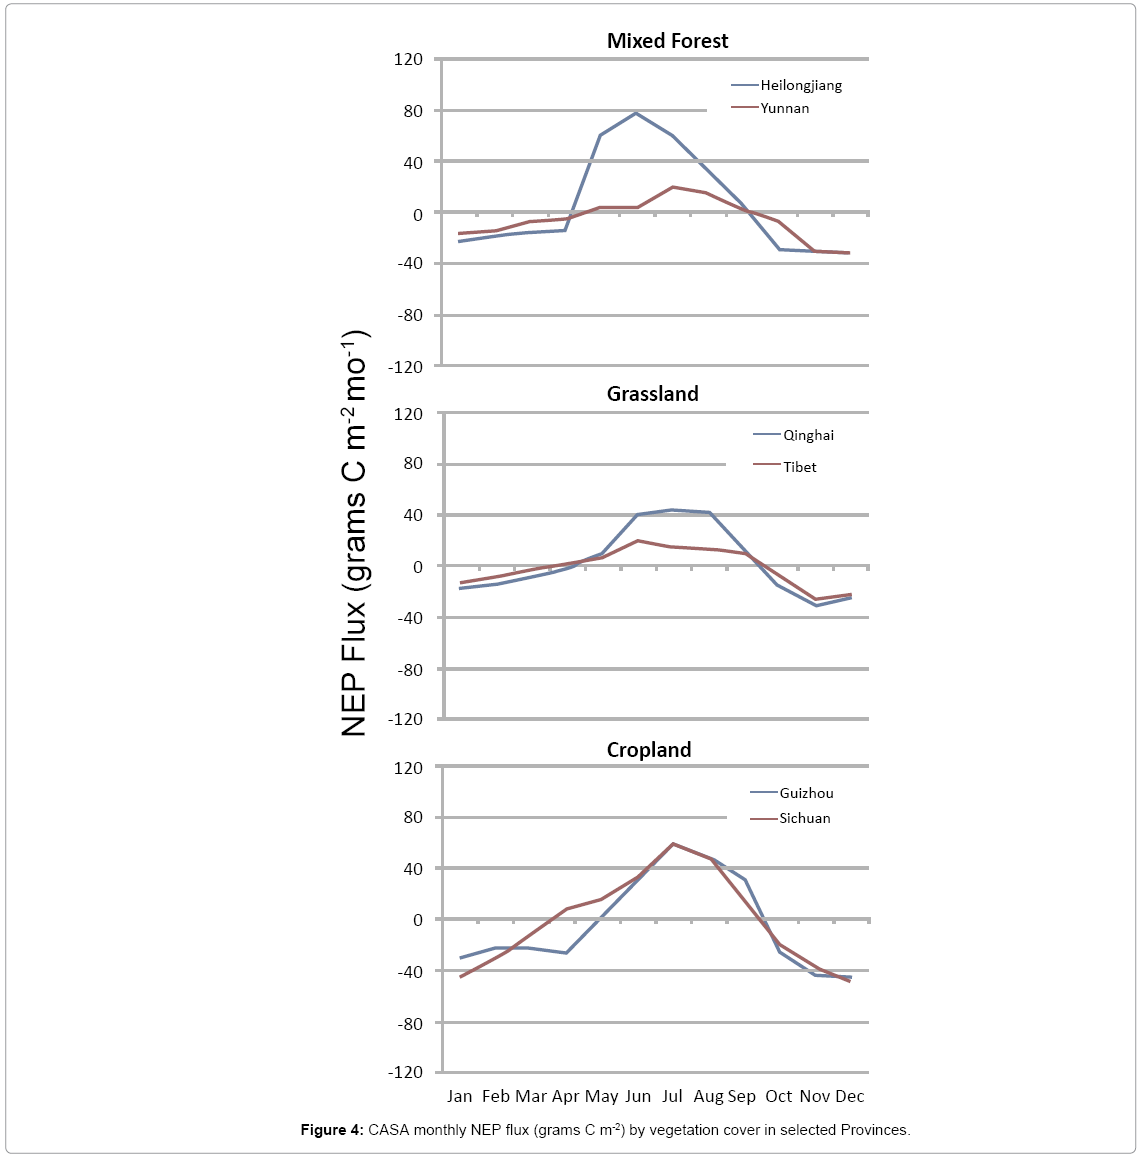
Figure 4: CASA monthly NEP flux ( grams C m-2) by vegetation cover in selected Provinces.
Average cropland NEP fluxes in Sichuan exceeded those in Guizhou from March to May.
Discussion
The drought of 2010 was the most severe during the first half of the year and would have impacted vegetation growth mainly during the months of March to June, as temperatures were becoming warm enough to promote green-up of forest and crop cover types. Despite severe drought over several provinces of the southwest and northern regions, our CASA model estimated that China gained ecosystem carbon at double the mean annual rate in 2010 compared to the past 10 years. Cropland and forest areas of Heilongjiang and Inner Mongolia remained productive in 2010 and these ecosystems were estimated (along with several other provinces listed in Table 2) to offset and exceed declines in NPP and total ecosystem carbon losses in the most drought-impacted areas of Tibet, Guizhou, Yunnan, Xinjiang, and Zhejiang provinces.
Changes in terrestrial NPP from the 2010 drought in the southern provinces of Yunnan, Guizhou, Guangxi, and Sichuan were reviewed by Zhang et al. [9] based on the global MODIS NPP algorithm (hereafter abbreviated MNA; Zhao and Running, 2010). In contrast to CASA model results, this MNA analysis suggested that annual NPP decreased by over more than 60% of this southern region at between 100 to 200 g C m-2yr-1 lower than the mean annual NPP over the period 2000 to 2009. Such MNA summaries of NPP change are unreliable, however, due to limitations of the MODIS processing algorithms applied by Zhao and Running (2010), which were evaluated by Medlyn [17] and Samanta et al. [18] to include generally weak correlations with field observations and extreme sensitivity to increasing air temperatures that can unrealistically increase autotrophic respiration costs and artificially drive down the MNA NPP predictions during drought periods. Our CASA model results suggested instead that 2010 annual NPP in the most drought-impacted areas of southwestern China only declined by an average of between 20 to 50 g C m-2yr-1 (equivalent to 13% CASA mean annual flux, compared to the period 2000 to 2009) [19].
For national and regional carbon cycle assessments, NEP (rather than NPP) should be considered the most complete measure to apply [13,16]. Because it takes into account the losses of CO2 from decaying organic matter and soils, annual NEP uniquely represents the net sink or source of atmospheric CO2 from terrestrial ecosystems [20].
Based on the results from this study of China in 2010, we hypothesize that unusually arid periods experienced during severe droughts affect (diminish) plant production to a significantly greater degree than soil respiration fluxes of CO2 from ecosystems.
Acknowledgements
This work was supported by funding from NASA Ames Research Center.
References
- Barriopedro D, Gouveia C, Trigo R, Wang l (2012) The 2009/10 drought in China: Possible causes and impacts on vegetation. J Hydrometeorology 13: 1251-1267.
- National Climatic Data Center (2010) State of the Climate, Global Analysis, Annual 2010, National Oceanic and Atmospheric Administration.
- National Research Council (2010) Monitoring Climate Change Impacts: Metrics at the Intersection of the Human and Earth Systems. Committee on Indicators for Understanding Global Climate Change. Washington DC, USA.
- Potter CS, Randerson JT, Field CB, Matson PA, Vitousek PM, et al. (1993) Terrestrial ecosystem production: A process model based on global satellite and surface data, Global Biogeochem, Cycles 7: 811-841.
- Potter C, Klooster S, Myneni R, Genovese V, Tan P, Kumar V (2003) Continental scale comparisons of terrestrial carbon sinks estimated from satellite data and ecosystem modeling 1982-98. Global Planet Change 39: 201-213.
- Zhao M, Running S W (2010) Drought-induced reduction in global terrestrial net primary production from 2000 through 2009. 329: 940-943.
- Goetz SJ, Prince SD, (1998) Variability in carbon exchange and light utilization and net primary production in boreal forest stands. Can J Forest Res 28: 375-389.
- Samanta A, Costa MH, Nunes EL, Vieira SA, Xu L, et al. (2011) Comment on “Drought- Induced reduction in Global Terrestrial Net Primary Production from 2000 Through 2009â€. 333:1093.
- Zhang LJ, Xiao J, Li K, Wang L, Lei, et al. (2012) The 2010 spring drought reduced primary productivity in southwestern China, Environ Res Lett 7.
- Huete AR, Didan K, Shimabukuro YE, Ratana P, Saleska SP, et al. (2006) Amazon rainforests green-up with sunlight in dry season. Geophys Res Lett 33.
- Jönsson P, Eklundh LL (2004) TIMESAT: A program for analyzing time-series of satellite sensor data. Com and Geo 30: 833-845.
- Potter CS (1999) Terrestrial biomass and the effects of deforestation on the global carbon cycle. Bio Science. 49: 769-778.
- Potter C, Klooster S, Genovese V (2012) Net primary production of terrestrial ecosystems from 2000 to 2009. Clim Cha.
- Kistler RR, Collins W, Saha S, White G, Woollen J (2001) The NCEP-NCAR 50-year reanalysis: monthly means CD-ROM and documentation, Bull. Am Meteorol Soc 82: 247-68.
- Potter CS, Klooster SA, Brooks V (1999) Interannual variability in terrestrial net primary production: Exploration of trends and controls on regional to global scales. Ecos 11: 36-48.
- Potter C, Klooster S, Genovese V, Hiatt C, Boriah S, et al. (2012) Terrestrial ecosystem carbon fluxes predicted from MODIS satellite data and large-scale disturbance modeling. Int J Geosci.
- Medlyn BE (2011) Comment on “Drought-Induced reduction in Global Terrestrial Net Primary Production from 2000 Through 2009. Sci 333: 1093.
- Sellers PJ, Tucker CJ, Collatz GJ, Los SO, Justice CO, et al. (1994) A global 1x1 NDVI data set for climate studies. Part 2: the generation of global fields of terrestrial biophysical parameters from the NDVI. Int J Remote Sen 15: 3519-3545.
- Running SW, Nemani RR, Heinsch FA, Zhao M, Reeves M, et al. (2004) A continuous satellite-derived measure of global terrestrial primary production. BioScience 54: 547-560.
- Nemani RR, Keeling CD, Hashimoto H, Jolly WM, Piper SC, et al. (2003) Climate driven increases in global terrestrial net primary production from 1982 to 1999. Science 300: 1560-1563.
Citation: Potter C, Li S, Klooster S, Genovese V (2013) Changes in the Terrestrial Carbon Cycle of China during the 2010 Drought. J Earth Sci Clim Change 4: 141. DOI: 10.4172/2157-7617.1000141
Copyright: ©2013 Potter C, et al. This is an open-access article distributed under the terms of the Creative Commons Attribution License, which permits unrestricted use, distribution, and reproduction in any medium, provided the original author and source are credited.