Research Article Open Access
Batch Equilibrium and Kinetic Studies of Simultaneous Adsorption and Biodegradation of Naphthalene by Orange Peels ImmobilizedPseudomonas aeruginosa NCIB 950
| Samuel E. Agarry* and Mujidat O. Aremu | |
| Biochemical Engineering and Biotechnology Research Laboratory, Department of Chemical Engineering, Ladoke Akintola University of Technology, Ogbomoso, Nigeria | |
| Corresponding Author : | Samuel E. Agarry Biochemical Engineering and Biotechnology Research Laboratory Department of Chemical Engineering Ladoke Akintola University of Technology, P. M. 4000 Ogbomoso, Oyo state, Nigeria Tel: +2348055529705 E-mail: sam_agarry@yahoo.com |
| Received December 23, 2011; Accepted February 16, 2012; Published February 18, 2012 | |
| Citation: Agarry SE, Aremu MO (2012) Batch Equilibrium and Kinetic Studies of Simultaneous Adsorption and Biodegradation of Naphthalene by Orange Peels Immobilized Pseudomonas aeruginosa NCIB 950. J Bioremed Biodegrad 3:138. doi:10.4172/2155-6199.1000138 | |
| Copyright: © 2012 Agarry SE, et al. This is an open-a ccess article distributed under the terms of the Creative Commons Attribution License, which permits unrestricted use, distribution, and reproduction in any medium, provided the original author and source are credited. | |
Related article at Pubmed Pubmed  Scholar Google Scholar Google |
|
Visit for more related articles at Journal of Bioremediation & Biodegradation
Abstract
The batch simultaneous adsorption and biodegradation (SAB) of naphthalene in synthetic naphthalene waste water by orange peels immobilized Pseudomonas aeruginosa NCIB 950 has been studied under different process conditions. Different orange peels particle sizes (0.125, 0.178 and 0.422 mm) were used as adsorbent and support matrix for the batch equilibrium adsorption-biodegradation studies; while different initial naphthalene concentrations (10 – 50 mg/l) and pH (5, 7 and 9) were used for the batch kinetic studies. The results of the batch equilibrium adsorption-biodegradation studies revealed that adsorption-biodegradation capacity decreased with increase in particle size. The equilibrium adsorption-biodegradation data were analyzed by the Langmuir, Freundlich and Redlich-Peterson models of adsorption. The results showed that the equilibrium data for naphthalene degradation sorbent systems were well fitted to the three adsorption models with Redlich-Peterson adsorption isotherm having the best fit. The adsorption-biodegradation kinetic data obtained at different initial naphthalene concentrations and pH showed that the adsorption-biodegradation capacity of orange peels immobilized P. aeruginosa increased with increase in initial naphthalene concentration and pH. The kinetic data were analyzed using Lagergren pseudo-first order, Elovich and intra particle diffusion rate equations. The rate equations fitting showed that the adsorption- biodegradation kinetic data generally fitted the three rate equations tested from which the rate constants and diffusion rate constants were estimated. However, the Lagergren pseudo first-order rate equation gave the best fit and, thus the process followed first-order rate kinetics. Adsorption studies have also been done separately to compare the efficiency of SAB over adsorption. Therefore, orange peels being an agricultural waste product have the potential to be used as low-cost adsorbent and support matrix for microbial culture immobilization for the removal of organic pollutant from waste water.
| Keywords | |
| Adsorbent; Adsorption-biodegradation; Adsorption isotherms; Adsorption kinetics; Orange peels; Naphthalene; P. aeruginosa | |
| Introduction | |
| Polycyclic aromatic hydrocarbons (PAHs) are chemical species with two to six fused benzene rings. They are an important family of toxic hazardous and long-persistent environmental pollutants that have been found to be carcinogenic and mutagenic [1-5]. PAHs originate from natural and anthropogenic sources. Anthropogenic sources include industrial processes, crude oil refinery, incinerators, urban runoff, engine exhaust, domestic heating system, incomplete combustion of fossil fuels, coking process and smoke. Natural sources are terrestrial coal deposits, forest fires and volcanic eruptions [3,4,6,7]. The main sources of PAHs in surface waters are atmospheric deposition, runoff from contaminated soil and deposition from sewage discharges [8]. Most PAHs are hydrophobic with high boiling and melting points and electrochemical stability. Due to their hydrophobicity, they have low water solubility and can therefore exist and accumulate in soils or water for a long period of time [3,9]. The ever increasing demand for water has caused considerable attention to be focused towards recovery and re-use of waste waters [10]. The removal of these kinds of pollutants from the environment cannot be accomplished by traditional methods [4]. It is now universally recognized that adsorption technology provides a feasible and effective method for the removal of pollutants from contaminated water resources and waste waters [11,12]. Activated carbons are the most commonly used adsorbent in the adsorption process due to their high adsorption capacity, high surface area and high degree of surface reactivity; however, regeneration is difficult and expensive [13]. In recent years, extensive research is now focused on new, efficient, low-cost and easily obtainable natural materials e.g. clay materials [14], agricultural by-products like orange and banana peels [15,16], spent tea leaves [17], tamarind fruit shell [18], soya bean hull [19], cotton seed hull and corn cobs [20], rubber fruit pericarp [21]; and microbial biomass [22] to be used as adsorbents. The agricultural by-products are developed as adsorbents for waste water treatment due to their relative high sorption affinity, ubiquitous presence in the environment and the ease of being modified to materials with higher efficiency [23,24]. In addition, biotechnological method of treatment has turned out to be an environmentally friendly, costeffective and favourable alternative for PAH removal. PAHs can be used as a source of carbon and energy by fungi and bacteria cells [25,26]. Nonetheless, both adsorption and biodegradation treatments are being employed successfully for various industrial liquid wastes. Biodegradation is performed in the presence of microorganisms either in free or immobilized phase. The immobilization of living microbial cells on a suitable adsorbent improves the removal efficiency [27]. This improvement is due to the bio-layer formation on the adsorbent bed where adsorption and biodegradation occurs simultaneously leading to simultaneous adsorption-biodegradation (SAB) [28-30]. Unlike adsorption, there is a continuous diffusion of adsorbate unto the solid surface and back diffusion of solute into the solution phase. The solute remaining in solution exists in dynamic equilibrium with that in the surface of bio-film [31]. The adsorption-biodegradation process involves immobilization of microbial culture on solid porous support matrix [32]. Different adsorbents used as solid support matrix for the immobilization of microorganisms have been reported in the literature and some of these include: alginate beads [33], polyacrylamide hydrazide gel [34,35], sintered glass [36] and activated carbon [37,38]. Adsorbents used as solid support matrix for immobilization should be stable both physically and chemically and have a high mechanical strength or resistance [10]. Activated carbon is most widely used as adsorbent and solid support matrix for microbial cell in the removal of heavy metals and other hazardous chemicals [17] which may be found in waste waters, but its high cost limits its commercial application [18]. Reports from literature have shown that the composition of agricultural by-products has a strong influence on the final porous and chemical features of the solid products obtained from pyrolysis and activation [5,39]. It was observed that high contents of cellulose yield predominantly micro porous materials, whereas; high content of lignin favour the development of a macro porous structure. It has also been reported from earlier works that these adsorbents obtained from agricultural by-products need further modifications to increase the active binding sites and to make them readily available for sorption. It is stated that these modifications involves pretreatment with chemicals like HCl, H2SO4, ZnCl2, H3PO4, alkaline hydroxides and physical pretreatment using steam or carbon dioxide to remove surface impurities on the adsorbents and expose the available binding sites for pollutant adsorption [18,40,41]. Earlier workers have shown the use of some agricultural waste materials (e.g. orange peels) and activated carbon made from various low cost materials like bean pod for naphthalene adsorption [2,5,42]. However, the use of raw agricultural waste adsorbent for the immobilization of cells has rarely been reported for the biodegradation of naphthalene. The objective of this study is to investigate the potential of orange peels, an abundantly available agricultural by-product as a non-conventional adsorbent and solid support matrix for Pseudomonas aeruginosa NCIB 950 immobilization to remove naphthalene from synthetic naphthalene waste water. The effects of initial naphthalene concentration, pH and adsorbent particle size on the simultaneous adsorption-biodegradation (SAB) were studied. According to Mondal and Balomajumder [43], adsorption predominates over biodegradation in SAB until adsorption equilibrium has been reached after which biodegradation predominates. Thus, the adsorption-biodegradation equilibrium data were fitted to adsorption isotherms of Langmuir, Freundlich and Redlich-Peterson models and the maximum adsorption capacity estimated. The adsorptionbiodegradation kinetic data were also checked for Lagergren pseudo first-order, Elovich and intra particle diffusion kinetic model equations from which the rate constants were estimated and evaluated. | |
| Materials and Methods | |
| Chemicals and adsorbent | |
| Naphthalene (99% pure, chemical grade) a product of Sigma- Aldrich, USA was purchased from a chemical store, Lagos, Nigeria. All chemicals used as mineral salt medium are of analytical or biochemical grade. Orange peels, a waste product of orange pulp to be used as adsorbent and solid support matrix for microbial cell immobilization were obtained from orange fruits bought from a local market at Ogbomoso, Nigeria. | |
| Synthetic waste water and preparation of inoculum | |
| The microorganism, Pseudomonas aeruginosa NCIB 950 which has the potential to degrade naphthalene [44,45] was obtained from the Department of Microbiology, Obafemi Awolowo University, Ile-Ife, Nigeria. The microorganism was maintained in a standard nutrient agar medium. The synthetic waste water used in this work was composed of: K2HPO4 1.0 g , KH2PO4 0.5 g , (NH4)2SO4 0.5 g, NaCl 0.5 g , CaCl2 0.02 g , MnSO4 0.02 g , CuSO4.5H2O 0.02 g , H3 BO3 0.01 g , MgSO4.7H2O 0.5 g , FeSO4 0.02 g , Molybdenum powder 0.02 g , deionized water 1000 ml. A primary culture was prepared by transferring two loops full of microorganisms from an agar slant culture into 100 ml of feed medium containing 20 ml of mineral salt medium and 80 ml of 50 mg/l naphthalene solution in a 250 ml Erlenmeyer conical flask. This was then incubated in a New Brunswick gyratory shaker (G25-R model, New Jersey, U.S.A) for 48 h at a temperature of 30°C and agitated with a speed of 120 rpm. Thereafter, 10 ml of the primary culture was transferred into another 100 ml of feed medium in a 250 ml Erlenmeyer conical flask and the incubation process was repeated. This was the secondary culture that was used as the inoculum for the degradation studies as this ensures that the organisms had fully adapted to growth on the naphthalene as sole source of carbon and energy. | |
| Preparation and pretreatment of adsorbent | |
| The orange peels were sundried and then reduced to small-sized particles by grinding using a serrated disk grinder. The powdered particles were sieved to obtain different desired average particle sizes (0.125-0.422 mm). They are washed thoroughly with sterilized deionized water and dried in the oven for 2-3 hrs at 60°C. Orange peel contains soluble sugars and pectin as the main components [46]. According to Rivas et al. [47], the orange peel is in fact constituted by soluble sugars, 16.9 % wt; starch, 3.75 % wt; fiber (cellulose, 9.21 % wt; hemicelluloses, 10.5 % wt; lignin 0.84 % wt; and pectin, 42.5 % wt), ashes, 3.50 % wt; fats, 1.95 % wt; and proteins, 6.50 % wt. Thus, orange peels exhibit a combination of large quantities of cellulose and lignin which makes the material an excellent candidate for adsorbents and as well as preparation of carbons probably with well-developed micro and macro porosity. The pretreatment of powdered orange peels (POP) was carried out to increase the naphthalene uptake efficiency. 10 g of the orange peels were treated with 100 ml of 1M HCl for 24 hrs and then kept on water bath (70°C) for 30 min. It was later cooled and neutralized with 50 ml of 1M NaOH. The filtrates were separated and dried in the oven at 60°C for 4 – 5 hrs. The pretreated powdered orange peels were used as adsorbent for the study. | |
| Batch adsorption equilibrium studies | |
| Batch adsorption studies were carried out by adding a known volume (100 ml) of prepared inoculums of P. aeruginosa into a number of glass bottles containing a known amount of POP adsorbent (2 g). Definite volume (150 ml) of synthetic waste water with different initial naphthalene concentration (10-50 mg/l) was added to each flask and the pH of the waste water was maintained at 7. The flasks were placed in a rotary mechanical shaker for 72 hrs at a speed of 180 rpm and temperature of 30°C so as to reach equilibrium. Similar process was followed for adsorption without microbes immobilized on the surface of POP. At time t = 0 and equilibrium, the naphthalene concentrations were determined using UV-spectrophotometer. The amount of adsorption at equilibrium, qe (mg/g) was calculated according to equation (1) [48]: | |
| |
|
| Where Co and Ce (mg/l) are the initial and final (equilibrium) concentrations of naphthalene in waste water. V (ml) is the volume of the waste water and W (g) is the mass of dry adsorbent (POP) used. | |
| Batch kinetic studies | |
| The procedures of kinetic studies were basically identical to those of batch equilibrium studies. The kinetic experiments were carried out at different pH (5, 7 and 9) of the waste waters. The pH was adjusted with 0.1M H2SO4 and 0.1M NaOH and measured by making use of digital pH meter. In every 6 hrs intervals, samples were taken to determine the amount of naphthalene adsorbed and degraded. | |
| Determination of naphthalene concentration | |
| The unadsorbed and undegraded naphthalene was determined quantitatively by the spectrophotometric method at an absorbance wavelength of 276 nm [41]. The amount of naphthalene adsorbed and degraded at time t, qt was calculated according to equation (2) [49]: | |
| |
|
| Where Ct is the concentration of phenol in waste water at time t. | |
| Results and Discussion | |
| Effect of adsorbent particle size | |
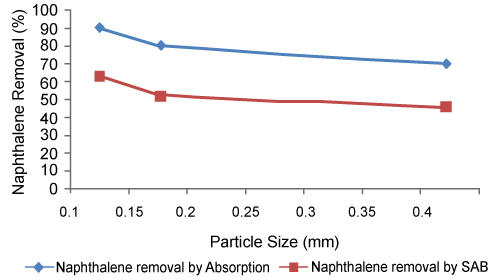
| Figure 1 shows the effect of particle size on the adsorption and simultaneous adsorption-biodegradation (SAB) of naphthalene by pineapple immobilized P. aeruginosa. It is seen that the removal of naphthalene increases as the particle size diameter decreases. Also, it is observed that at each of the adsorbent particle size for SAB the removal rate of naphthalene (i.e. percent removal) is more than that of adsorption. This increase of removal rate in SAB is due to the dominating role of biodegradation of naphthalene by the microbes attached to the bio-layer formed on the adsorbent surface. Similar observations have been reported for simultaneous adsorptionbiodegradation of phenol [10,43]. Decrease in particle size increases the percentage removal due to increase in surface area as well as micro pore volume [43,50]. Smaller particle size means more interior surface and micro pore volume and hence more will be the area of active sites for adsorption. Also for larger particles the diffusion resistance to mass transfer is higher and most of the internal surfaces of the particle may not be utilized for adsorption and consequently the amount of naphthalene adsorbed is small [10,51,52]. Small particles are better for naphthalene removal from liquid waste effluents. However, one cannot use small particle sizes in a continuous packed bed adsorber because of higher pressure drops that will be encountered [10]. | |
| Effect of initial concentration and contact time | |
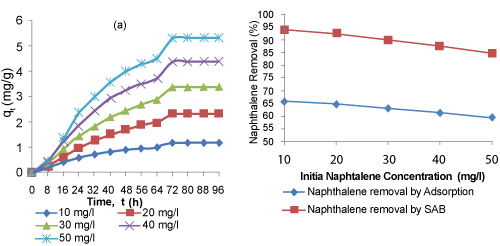
| The effect of initial naphthalene concentration and contact time on the simultaneous adsorption-biodegradation of naphthalene is shown in Figure 2a. It could be seen that the amount of naphthalene adsorbed per unit mass of adsorbent increased with the increase in initial concentration and contact time until equilibrium was reached, although the percent removal decreased with the increase in initial concentration (Figure 2b). Figure 2a also shows rapid adsorptionbiodegradation of naphthalene in the first 16 hrs for all initial concentrations and thereafter the adsorption-biodegradation rates decreased gradually till it reached equilibrium. It was found that the time to achieve a definite fraction of equilibrium adsorptionbiodegradation is independent of initial concentration. This indicates that the adsorption-biodegradation process is first order. Similar observation has been reported for the adsorption of naphthalene on mesoporous activated carbon [53]. The higher rate of adsorptionbiodegradation at the beginning was due to large available surface area of the biosorbent and after the capacity of the biosorbent gets exhausted (i.e. at equilibrium), the rate of uptake is controlled by the rate at which the sorbate is transported from the exterior to the interior sites of the biosorbent particles [18,54]. Furthermore, the nature of the curves in Figure 2b showed that the removal rate of naphthalene by SAB is greater than that of adsorption; this indicates the predominant role of SAB after reaching the adsorption equilibrium. Thus, biodegradation has enhanced the removal of naphthalene from the aqueous solution. This agrees with the mechanism of bio-filtration [55] where bio-layer is formed followed by degradation of compounds. However, in SAB the calculated concentration of naphthalene adsorbed is greater than the concentration of naphthalene that was biodegraded (table 1). This indicates that adsorption predominates over biodegradation in SAB until adsorption equilibrium has been reached after which biodegradation predominates [43]. | |
| Effect of pH | |
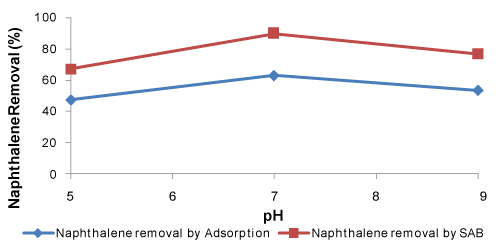
| The removal of pollutant from waste water by adsorption and adsorption-biodegradation is highly dependent on the waste water pH, which affects the surface charge of the adsorbent and the degree of ionization of the adsorbate (pollutant). The effect of solution pH on naphthalene adsorption-biodegradation was studied using 2 g of POP, 30 mg/l naphthalene and at room temperature (30°C). Since, at very low pH bacteria can’t sustain, in the present study the range of pH was adjusted between 5 and 9 to study the effect of pH on the % removal for SAB as well as adsorption studies (Figure 3). As it can be seen from Figure 3, it is evident that increasing the pH of the synthetic waste water generally serves to increase the adsorption-biodegradation capacity with a significant enhancement in the adsorption-biodegradation process occurring as the pH increased from 5 to 7. It was found that the percentage of adsorption-biodegradation increased as the pH of the synthetic waste water was increased (Figure 3). The adsorption process showed similar observation (Figure 3). The nature of the curve in Figure 3 indicates that the removal rate of naphthalene in SAB is more than that of adsorption. This increase of removal rate in SAB is due to the dominating role of biodegradation of naphthalene by the microbes attached to the bio-layer formed on the surface of the adsorbent. As the biodegradation predominates over adsorption in SAB, the pH responsible for maximum growth of microbes may be the optimum value of the whole process. In this present experiment the maximum percent removal of naphthalene by SAB is at pH 7. This observation agrees with the fact that at neutral pH the specified microbes achieve maximum efficiency. The pH of waste water or medium controls the electrostatic interactions between the biosorbent and the sorbate. The surface nature of a biosorbent depends not only on the surface functional groups but also on the isoelectric point (pHIEP) or point of zero charge (pHPZC) of the biosorbent [39]. At a lower pH (acidic pH), the total or external surface charges on the biosorbent are positive. Thus, lower adsorption of naphthalene took place at lower pH value. The lowest naphthalene adsorption-biodegradation was observed at pH 5. Cationic adsorption is favoured at pH > pHPZC and anionic adsorption is favoured at pH < pHPZC [39]. When the pH value was increased, the surface of the biosorbent was more negatively charged, therefore, the adsorption of naphthalene with positive charge reached maximum at a pH value of 7. The maximum adsorption-biodegradation capacity occurred at pH 7 and above this value, it decreased. A similar observation has been reported [10,56]. | |
| SAB adsorption isotherms | |
| Adsorption and SAB are isothermal processes; hence, they can be explained by adsorption isotherms. The equilibrium adsorption isotherm is of fundamental importance in the design of adsorption system [10]. Adsorption and biodegradation equilibrium data are conveniently characterized by adsorption isotherms which are helpful in determining the adsorption capacity of an adsorbent material such as immobilized peels matrix. In order to analyze an adsorption isotherm, it is fundamental to develop an equation which accurately represents the results and which may be used for design purposes. Classical adsorption models are used to describe the equilibrium established between adsorbed component on the adsorbent and unadsorbed component in solution (represented by adsorption isotherms). Langmuir, Freundlich and Redlich-Peterson adsorption models were used to analyze the equilibrium data for adsorption and biodegradation of naphthalene by orange peel-immobilized P. aeruginosa. | |
| The Langmuir model is as given in equation (3): | |
 (3) (3) |
|
| Where K and a are isotherm constants. Langmuir constant (K) is a measure of the amount of phenol adsorbed per unit weight of adsorbent, when saturation is attained. Langmuir constant (a) is related to energy of adsorption (i.e. affinity of the binding sites). Langmuir equation is valid for monolayer sorption unto a surface with a finite number of identical sites which are homogeneously distributed over the sorbent surface [18]. The basic assumption of Langmuir model is that sorption takes place at specific sites within the adsorbent. Theoretically, therefore, a saturation value is reached beyond which no further sorption can take place. The essential characteristics of Langmuir isotherms can be described by a separation factor [56-58] which is defined in equation (4) as: | |
 (4) (4) |
|
| The separation factor (RL) indicates the isotherm shape as follows: RL < 1 unfavourable, RL > 1 unfavourable, RL = 1 linear, 0 < RL < 1 favourable and RL = 0 irreversible. | |
| The Freundlich isotherm model is given in equation (5): | |
| |
|
| Where Kf and n are Freundlich constants. Kf is roughly an indicator of the adsorption capacity and n is the adsorption intensity. | |
| The Freundlich isotherm is used for heterogeneous surface energy systems [10]. It suggests that binding sites are not equivalent and/or independent. | |
| The Redlich-Peterson isotherm equation contains three parameters and incorporated the features of the Langmuir and Freundlich isotherm [59,60]. This isotherm equation is as given in equation (6): | |
 (6) (6) |
|
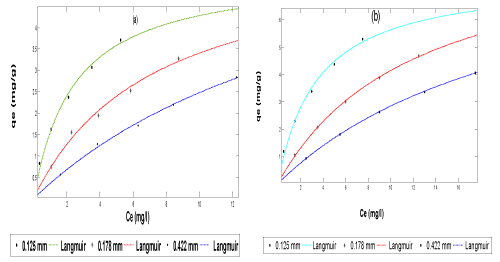
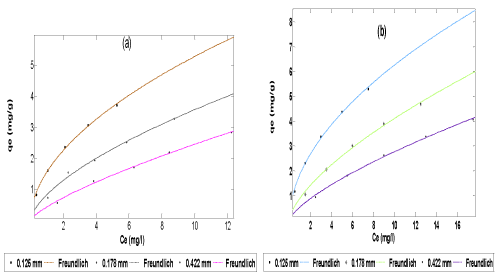
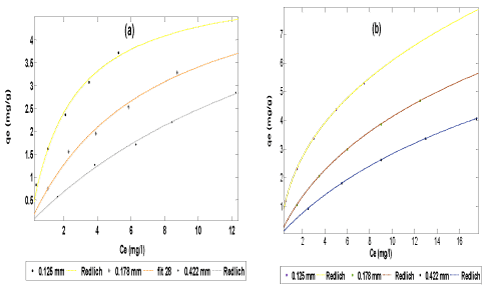
| The data obtained from both the adsorption and simultaneous adsorption-biodegradation equilibrium experiment were fitted to Langmuir (Equation 3), Freundlich (Equation 5) and Redlich-Peterson (Equation 6)) isotherms (plot of qe vs Ce) using the non-linear fitting routine of MATLAB software package as shown in Figures 4-6 respectively. | |
| The values of Langmuir constants (K,a), Freundlich constants (n, Kf) and Redlich-Peterson constants (K and a) estimated from the plot are presented in Tables 2 and 3. The results showed that for Langmuir isotherm plot, the adsorption and simultaneous adsorptionbiodegradation capacity due to monolayer (K) increased with increase in particle size; while the energy of adsorption (a) decreased with increase in particle size. A similar observation has been reported [10,21,56]. For the SAB process, K values are greater and a values are less than those of adsorption. This indicates greater adsorption capacity of the adsorbents and less energy of adsorption. This may be due to the dominating role of SAB over adsorption. The values of K for SAB in this work ranges from 7.60 to 9.38 mg/g and the corresponding values of ‘a’ from 0.0157 to 0.0583. The value of K in other studies were 7.519 mg/g for ripe orange peels [42] and 18.75 mg/g for activated carbon obtained from coal tar pitch/furfural [61], the corresponding value of a are 0.0863 and 0.00539 respectively. Therefore the constants obtained in this work are comparable with those in published literature. The difference could be due to different range of concentration, different type of material used and their properties like functional groups present on the surface, surface area, pore structure, pH and temperature of the solution [50]. For this experiment, the values of separation factor, RL, are less than 1, indicating a favourable adsorption as given in Table 4. It is also clear from the shape of the adsorption-biodegradation isotherm that it belongs to the L2 category of isotherm, which indicates the normal or Langmuir type of adsorption [58,62]. This type of isotherms is often encountered when the adsorbate has a strong intermolecular attraction for the surface of the adsorbent. The L2 shape of isotherm observed in the present case clearly suggests that naphthalene molecules must be strongly attached to orange peels (POP). From Tables 2 and 3, it is seen that for both adsorption and SAB the Freundlich isotherms, sorption capacity (Kf) decreased with increase in particle size. A similar observation has been reported [10]. However, Annadurai et al. [57] have reported that Kf increases with increase in particle size for chitin used as adsorbent in the adsorption and biodegradation of phenol. McKay et al. [63] and Annadurai et al. [58] have stated that the magnitude of the exponent 1/n gives an indication of the favourability and capacity of the adsorbent/adsorbate system. Values n > 1 represent favourable adsorption conditions according to Treybal [64]. In most cases, the exponent between 1 < n < 10 shows beneficial adsorption. In general, as shown in Tables 2 and 3 n values are greater than unity, indicating that 1/n values are less than unity. This suggests that the surface of the adsorbent may be heterogeneous in nature [18,65]. Again, higher values of Kf in case of SAB over adsorption also indicate higher adsorption capacity of the adsorbent and relatively less values of n indicates less adsorption intensity. This observation also favours the dominating role of SAB over adsorption. In the present study, Kf values ranges from 0.53 to 1.85 for SAB and from 0.44 to 1.57 for adsorption only. The literature shows the parameter values of Kf as 0.11 for rice husk ash [66]; 0.002 for coal fly ash [66] and 1.165 for exfoliated graphite nanoplatelets [67]. | |
| The Redlich-Peterson isotherm is as shown in Figure 6. The isotherm constants are given in Tables 2 and 3. It is seen that the sorption capacity (K) decreased with increase in particle size. This could be due to substantial decrease in surface area and pore volume. For the SAB of naphthalene compound the K and a values are less and b values are more than those of adsorption. This indicates less adsorption capacity of the adsorbents. This may be due to the dominating role of SAB over adsorption. Generally, the high value of the correlation coefficient (R2) indicated that the Langmuir, Freundlich and Redlich- Peterson isotherm equations gave a better fit to the experimental data. However, the Redlich-Peterson isotherm model offered the best fit (with R2 = 1) to the experimental data. | |
| Kinetics of SAB | |
| The kinetics of simultaneous adsorption-biodegradation was studied for its possible importance in the treatment of naphthalene containing industrial effluents. Numerous kinetic models have been proposed to elucidate the mechanism by which pollutants are adsorbed. To investigate the mechanism of the naphthalene adsorption- biodegradation, three kinetic model equations, that is, Lagergren pseudo first-order, Elovich and intra particle diffusion equations were considered to interpret the experimental data. | |
| The Lagergren pseudo first-order kinetic model equation [60,68] is represented in an integral form as given in equation (7): | |
| |
|
| Where, qm is the maximum adsorption capacity (mg/g) and Kad is the adsorption rate constant (min-1). | |
| The Elovich equation [4,69] is generally expressed as presented in equation (8): | |
| |
|
| To simplify Elovich equation, Chien and Clayton [70] assumed αβt>> 1 and by applying the boundary conditions qt = 0 at t = 0 and qt = qt at t = t. Equation (8) becomes [71]: | |
| |
|
| Where, α is the initial adsorption rate (mg/g min) and β is the desorption constant (g/mg). | |
| The intra particle diffusion kinetic model [72] can be written as presented in equation (10): | |
| |
|
| Where Kp is the intra particle diffusion rate constant (mg/g min-½). | |
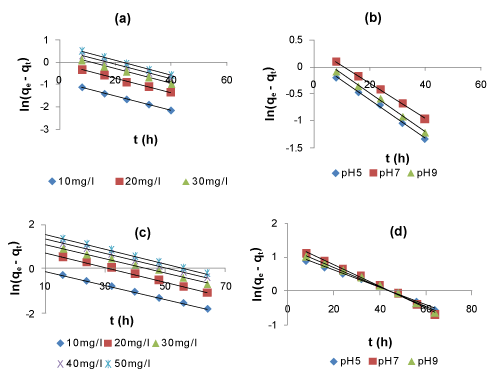
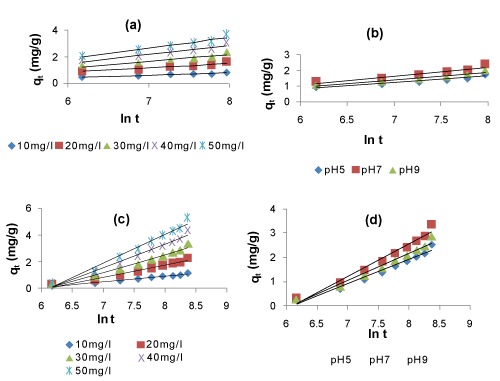
| The plots of ln(qe – qt) vs t for Lagergren first-order model (Figure 7) and the plots of qt vs. lnt for the Elovich model (Figure 8) for the adsorption and simultaneous adsorption-biodegradation of naphthalene are represented at different parameters of initial naphthalene concentration and pH, respectively. A linear relationship was observed for each of the plots indicating the applicability of the above kinetic models. | |
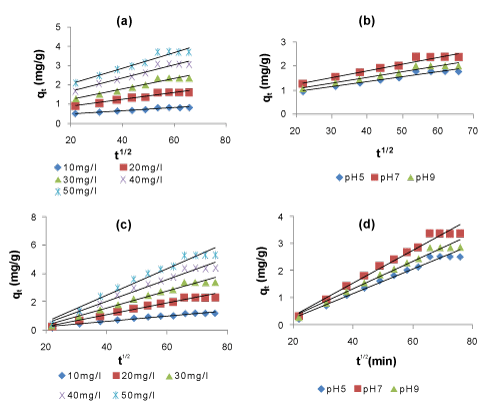
| The kinetic parameters of the models under different conditions of initial naphthalene concentration and pH were calculated from these plots and are given in Tables 5 and 6. It is observed that the average values of the Lagergren kinetic constant Kad and qm increased with increase in initial naphthalene concentration. Also, it is seen from the tables that the maximum adsorption capacity (qm) for naphthalene by SAB is more than that by adsorption process only. This indicates the predominant role of SAB over adsorption. Furthermore, the average values of the Elovich kinetic constants α increases with increase in initial naphthalene concentration and pH, while β decreases with increase in initial concentration and pH. However, the Elovich constants values are less for SAB than those of adsorption. This indicates less initial adsorption rate and desorption. This may be due to the dominating role of biodegradation over adsorption in SAB process. The correlation coefficients (R2) for the Lagergren first-order and Elovich kinetic models are above 0.90. These high R2 values indicate a good fit of the two kinetic models to the experimental data. However, the Lagergren first-order kinetic model gave the best fit and thus the simultaneous adsorption-biodegradation as well as the adsorption process follows first-order reaction kinetics. | |
| In adsorption of naphthalene using POP, there is the possibility of intra particle diffusion. It can be described by three consecutive steps, (i) the transport of sorbate from bulk solution to outer surface of the sorbent by molecular diffusion known as external or film diffusion, (ii) internal diffusion, the transport of sorbate from the particles surface into interior sites, (iii) the sorption of the solute particles from the active sites into the interior surface of the pores [73,74]. The Lagergren first-order and Elovich kinetic models cannot identify the diffusion mechanisms and the kinetic results were then subjected to analysis by the intra particle diffusion model of Weber and Moris [69] and it may be the rate- controlling step. If this occur, then the plot of sorption qt vs square root of time (t1/2) should be linear and if it passes through the origin then the intra particle diffusion will be the sole ratelimiting process [13,75]. The intra particle diffusion plots may presents multilinearity indicating that two or more steps take place. The first sharper portion is the instantaneous adsorption stage or external surface adsorption. The second portion is the gradual adsorption stage where intra particle diffusion is rate-limiting. The third portion is the final equilibrium stage where intra particle diffusion slows down due to extremely sorbate concentration left in the solution. The double nature of these plots, as initial curve portions and final linear portions may be explained by the facts that the initial curved portions are boundary layer diffusion effects [74]. The final portion is as a result of intra particle diffusion effect. In the present study, it was found that the plots of qt vs square root of time (t1/2) exhibited an initial linear portion followed by a plateau which occurred after 48 h (Figure 9). The curved portion of the plots seems to be due to the boundary layer diffusion and the linear portion as a result of intra particle diffusion with the plateau corresponding to the equilibrium [4,76]. However, none of the plots passed through the origin. This indicates that although intra particle diffusion was involved in the adsorption-biodegradation process, it was not the rate-controlling step. Values of the intra particle diffusion constant, Kp, were obtained from the slopes of the linear portions of the plots and are presented in Tables 5 and 6. The correlation coefficients (R2) for the intra particle diffusion model were between 0.969 and 0.977. These values indicate that the sorption of naphthalene into POP may be followed by the intra particle diffusion up to 48 h. It is observed from Tables 5 and 6 that the intra particle diffusion constant, Kp, increased as initial naphthalene concentration and pH increases. For SAB of naphthalene Kp value is maximum at pH 7 and either the lower or upper shift of pH from 7 decreases Kp value. At pH of 7, the Kp of naphthalene for SAB is higher than that of adsorption, which indicates that the removal rate of naphthalene in SAB is more than that of adsorption. This increase in removal rate is due to the dominating role of biodegradation of naphthalene by the microorganisms attached to the biolayer formed on the surface of the biosorbent. | |
| Conclusion | |
| The adsorption-biodegradation of naphthalene from synthetic waste water using orange peels-immobilized with P. aeruginosa NCIB 950 has been investigated under different reaction conditions in batch and equilibrium mode. The monolayer adsorption capacity determined was reasonably high between 7.60 to 9.38 mg/g at naphthalene concentration of 10 - 50 mg/l, pH 7 and particle size of 0.125 - 0.422 mm for adsorption-biodegradation of naphthalene. The values of rate constant (Kad) and intra particle diffusion constant (Kp) varied with initial phenol concentration and pH. Orange peels showed competitive properties for bacterial biomass immobilization and may have potential in process application because of its relatively high biomass loading and good chemical and physical stabilities. The kinetics of naphthalene adsorption-biodegradation nicely followed Lagergren first-order rate expression and demonstrated that intra particle diffusion plays a significant role in the adsorption-biodegradation mechanism. Langmuir and Redlich-Peterson adsorption isotherms could be used to describe naphthalene sorption equilibrium by orange peels immobilized P. aeruginosa as they gave a better fit. Under the experimental conditions the efficiency of SAB is more than that of adsorption. The treatment is simple and economic. The reaction kinetics and adsorption equilibrium data thus generated may be used for designing an economically viable treatment plant for PAH effluents using batch or stirred tank reactors. | |
References
|
|
Tables and Figures at a glance
| Table 1 | Table 2 | Table 3 |
| Table 4 | Table 5 | Table 6 |
Figures at a glance
 |
 |
 |
 |
 |
| Figure 1 | Figure 2 | Figure 3 | Figure 4 | Figure 5 |
 |
 |
 |
 |
| Figure 6 | Figure 7 | Figure 8 | Figure 9 |
Relevant Topics
- Anaerobic Biodegradation
- Biodegradable Balloons
- Biodegradable Confetti
- Biodegradable Diapers
- Biodegradable Plastics
- Biodegradable Sunscreen
- Biodegradation
- Bioremediation Bacteria
- Bioremediation Oil Spills
- Bioremediation Plants
- Bioremediation Products
- Ex Situ Bioremediation
- Heavy Metal Bioremediation
- In Situ Bioremediation
- Mycoremediation
- Non Biodegradable
- Phytoremediation
- Sewage Water Treatment
- Soil Bioremediation
- Types of Upwelling
- Waste Degredation
- Xenobiotics
Recommended Journals
Article Tools
Article Usage
- Total views: 15429
- [From(publication date):
February-2012 - Dec 09, 2025] - Breakdown by view type
- HTML page views : 10598
- PDF downloads : 4831
