 |
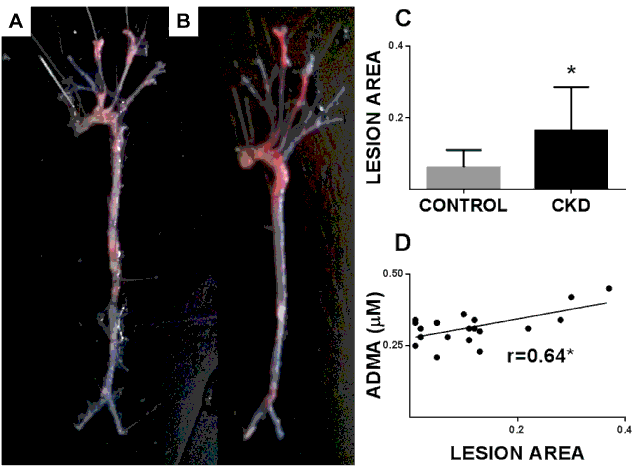
| Figure 3: Plasma ADMA correlates with atherosclerotic burden in CKD mice. Panel A and Panel B depict a representative en face analysis of control and CKD mouse aortic tree following Oil Red O stain respectively. Lesion area was measured as described in “Methods” and represented in Panel C for control and CKD mice (n =11 per group). Plasma ADMA (Panel D) correlated with lesion area using Pearson correlation (*p<0.05). |