 |
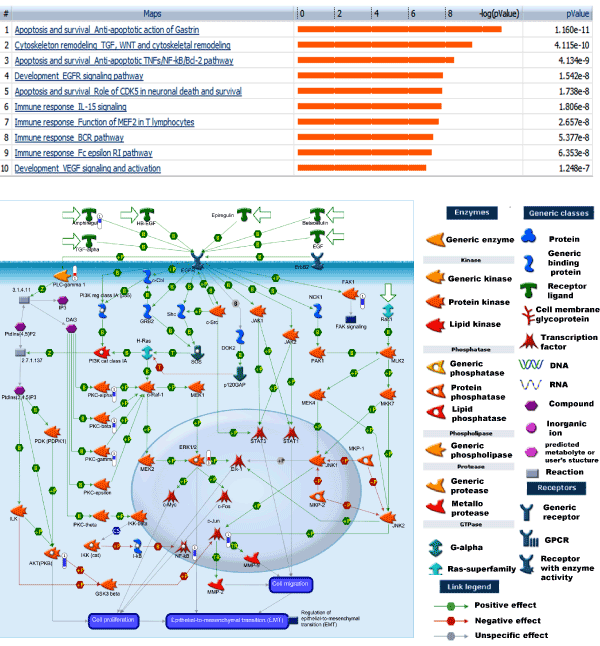
| Figure 1: Proteins differentially expressed in the FKBP51 silenced melanoma cells. (Upper) Top ten most significant pathways from GeneGo MetaCore analysis. (Lower) A map of EGFR signaling pathway: proteins on the map are indicated by different symbols representing the functional class of the protein reported in the legend. Red thermometers show increase in expression and blue decrease in expression, in FKBP51 depleted cells. |