 |
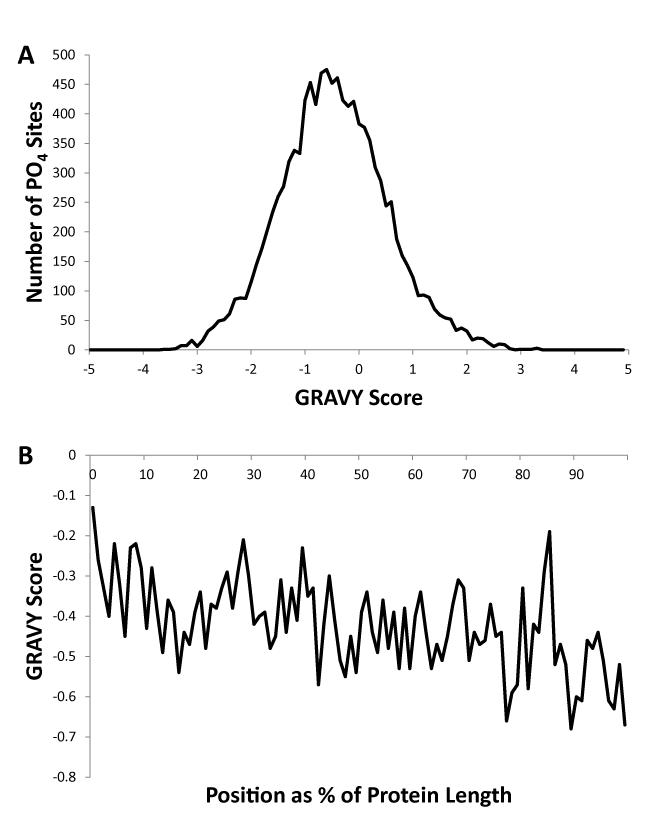
| Figure 2: Hydrophobicity plots. (A) Average hydrophobicity of local environment (13 amino acid residues comprised of -6 to +6 around the phosphorylation site itself) surrounding phosphorylation sites. (B) Sliding window hydrophobicity plot across proteins and sites identified in dataset (expressed with reference to the position of the modification site position as a percentage of protein length, similar to Figure 1). |