 |
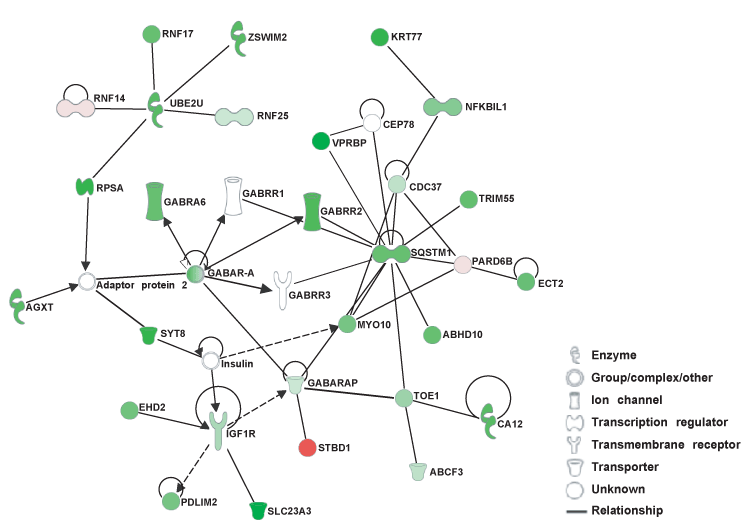
| Figure 3: A statistically significant network identified by pathway analysis. The network was overlaid with GABAergic pathway and the color code of molecules represents the expression levels wherein red shows upregulated and green indicates downregulation. |