 |
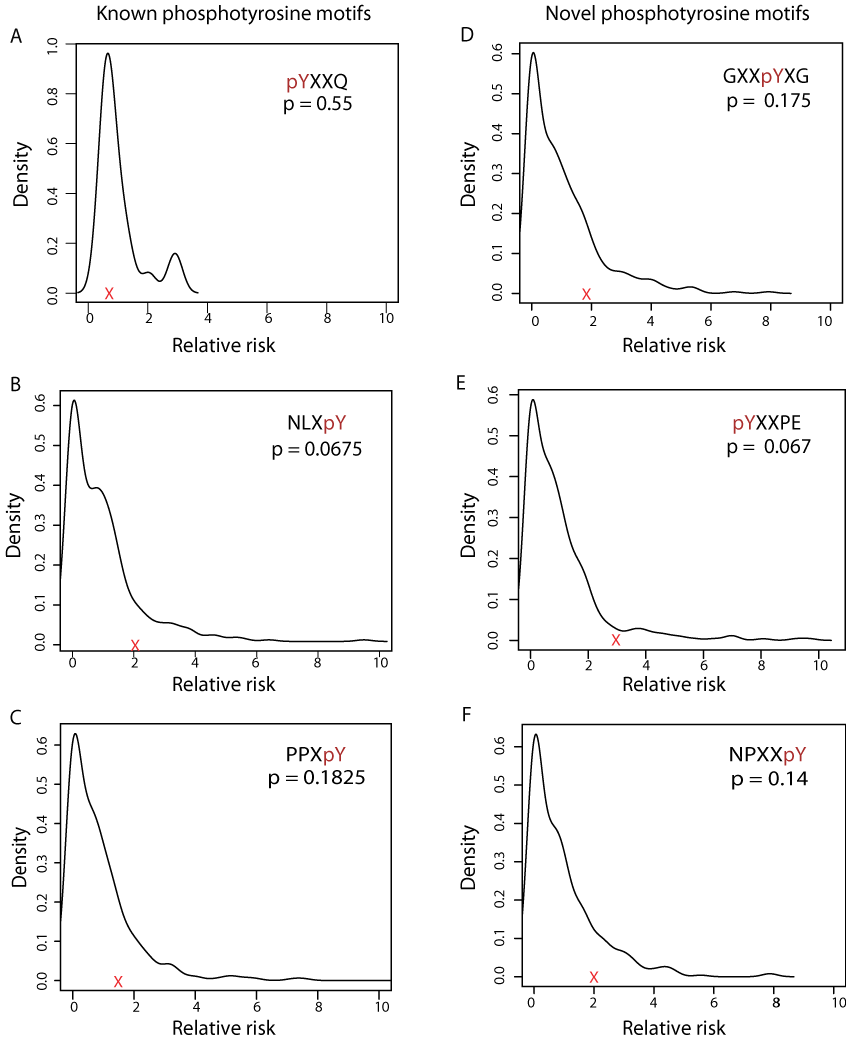
| Figure 5: Distribution curves of known (A-C) and novel (D-F) phosphotyrosine motifs with insignificant p-values. The X in red represents the relative risk value for the motif, and the area under the curve to the left of X represents the number of permuted sequences with relative risk lesser than the motif under study. |