 |
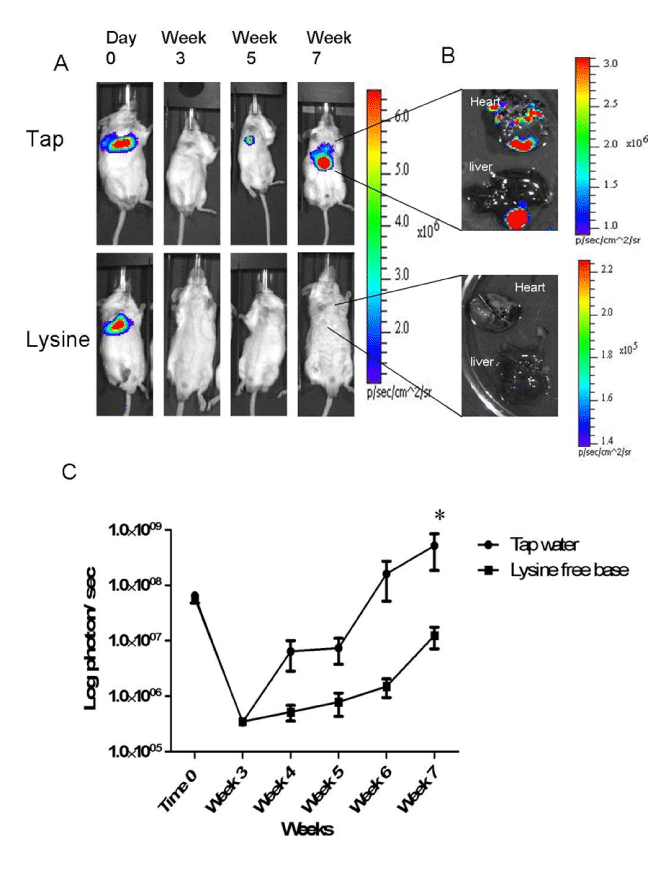
| Figure3: Effect of lysine on PC3M experimental metastasis A) Bioluminescence images of representative mice from the tap versus lysine groups at the indicated time points after venous injection of luciferin expressing PC3M cancer cells to induce experimental metastases. B) Ex-vivo Bioluminescence images of representative mice from the tap versus lysine groups at the end time point confirming the in vivo images. C) Mean tumor bioluminescence in each group after induction of experimental metastases, indicating significantly fewer metastases in the lysine cohort than in the tap (p<0.04) note log scale). |