 |
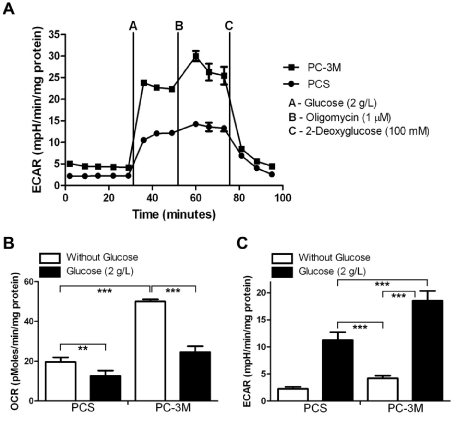
| Figure 1: The glycolytic activity and maximum glycolytic capacity was determined for PC3M and PCS cells in real-time using the Seahorse extracellular flux analyzer A) A series of extracellular acidification rates (ECAR) were calculated for cells glucose starved for two hours and subsequently treated with 2 g/L D-glucose (a), 1 1 μM oligomycin (b), and 100 mM 2-Deoxyglucose (2-DG) (c). ECAR following the addition of glucose defines glycolysis and ECAR following oligomycin represents maximum glycolytic capacity. ECAR prior to the addition of glucose and following treatment with 2-DG represents acidification associated with non-glycolytic activity. The data represent the mean ± standard deviation. B-C) Basal oxygen consumption rates (OCR) and extracellular acidification rates (ECAR) were determined for PC3M and PCS cells either in the presence or absence of 2 g/L D-gluocose. The data represent the mean ± standard deviation. A two-tailed student t-test was used to calculate statistical significance: ** p < 0.001 and *** p < 0.0001. |