 |
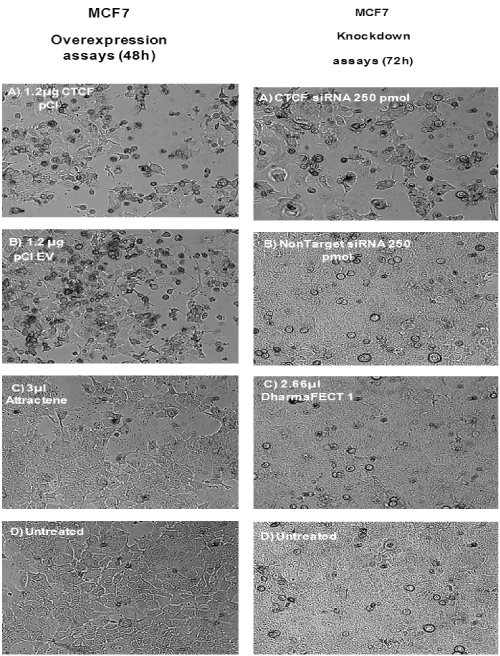
| Figure 2: MCF7 cell response to expression vectors and attractene transfection reagent. Shown are MCF7 cells transfected with 1.2 μg of CTCF pCi plus 3 μl attractene (A), 1.2 μg of EV pCi plus 3 μl attractene (B), 3 μl attractene alone (C) and no treatment (D) in the overexpression assays panels. Also MCF7 cells transfected with 250 pmol of CTCF siRNA using 2.66 μl DharmaFECT 1 (A); 250 pmol of non-target siRNA using 2.66 μl DharmaFECT 1 (B); 2.66 μl DharmaFECT 1 only (C); and no treatment (D) in the knockdown assays panels. The panels show the extent of cell confluence and cell rounding (indicating cell death) on treatment and show some cell loss in cells transfected with plasmid expression vectors and CTCF siRNA. |