|
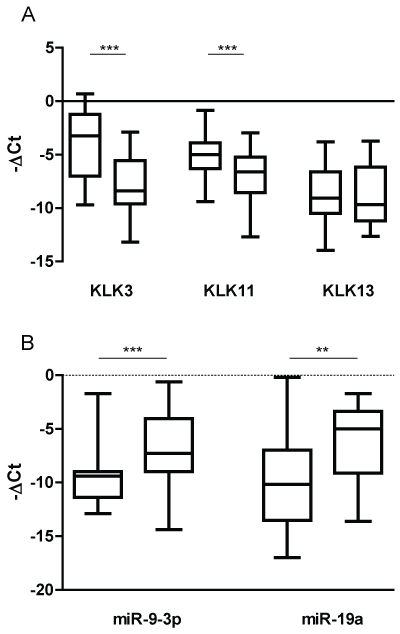
| Figure 1: Expression levels expressed as -ΔCt (median with range and interquartile range) of selected mRNAs (KLK3, KLK11 and KLK13, Panel A) and miRNAs (miR-9-3p, miR-19a-3p, Panel B) between prostate cancer patients (PCa, left) and subjects with benign prostatic hyperplasia (BPH, right).*P<0.05; **P<0.01; ***P<0.001. |