 |
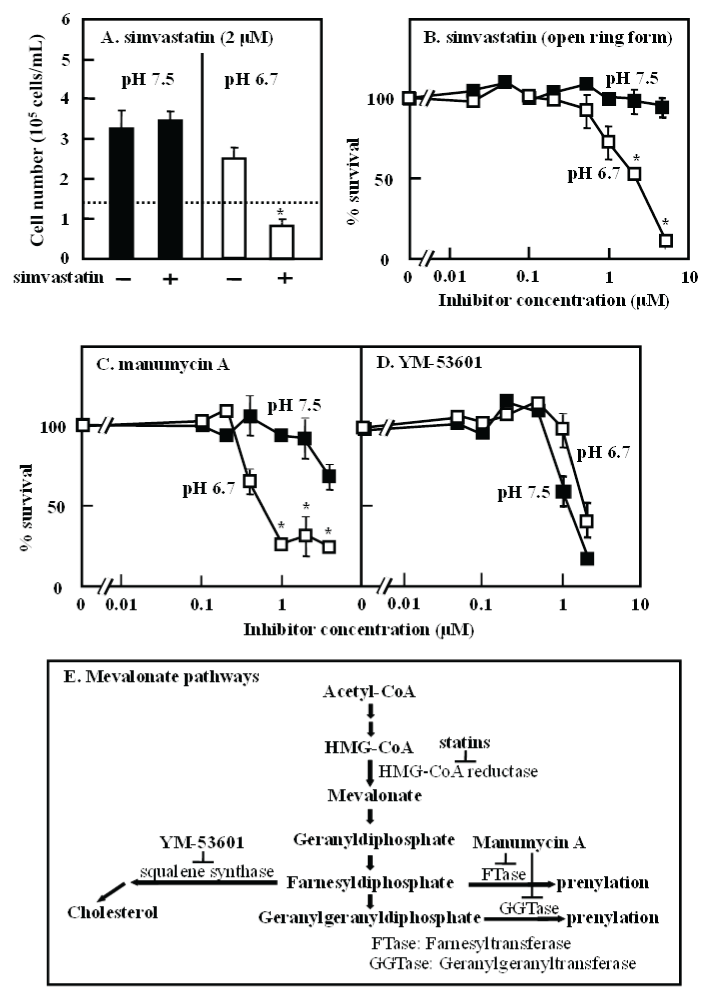
| Figure 1: Inhibition of cell proliferation and survival of THP-1 cells by various inhibitors. (A) THP-1 cells were cultured in RPMI-1640 media at pH 6.7 or pH 7.5 for 4 days with simvastatin at the concentrations indicated, and cell numbers were measured as described in Materials and Methods. The dotted line represents the cell number before culture. The mean values and S.D. obtained from two experiments using different cultures are represented. The p values compared with data obtained without simvastatin at both pH values were calculated. *p<0.01; no mark, p>0.01. (B) to (D) THP-1 cells were cultured in RPMI-1640 media at pH 6.7 or pH 7.5 for 5 days with the inhibitors indicated, and cytotoxicity was measured as described in Materials and Methods. Absorbance obtained without an inhibitor was taken as 100%. The mean values and S.D. obtained from three experiments using different cultures are represented. S.D. less than 10% is not represented. The p values at pH 6.7 compared with data at pH 7.5 were calculated. *p<0.01; no mark, p>0.01. (E) Mevalonate pathways. |