|
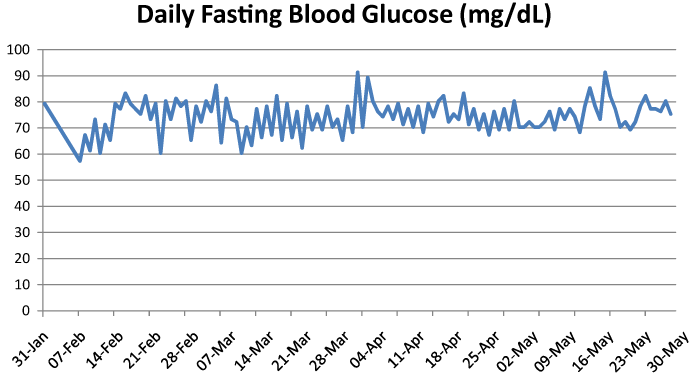
| Figure 2: Fasting glucose levels from 31st January 2014 to 6th June 2014 of the patient. The figure shows consistently the low levels of glucose during the treatment. The rise and fall in glucose levels are correlated to fasting and non-fasting days. |