 |
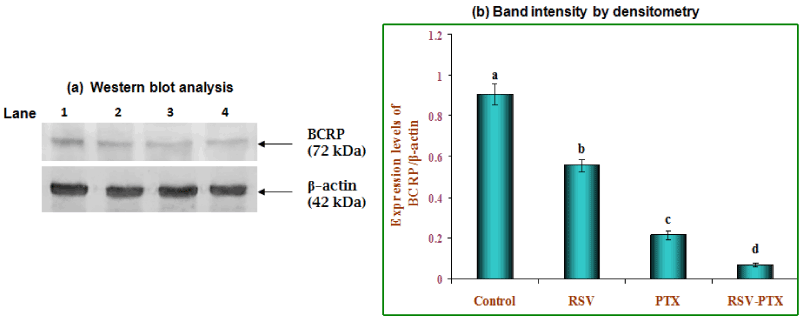
| Figure 4: Western blot analysis of BCRP and β-actin expression in NCI-H460 cells. (a) Lane 1.Control 2.RSV 3.PTX and 4.RSV-PTX and band intensities were scanned by densitometer. Histogram of densitometry analysis represents the ratio of BCRP/β-actin expression. (b) Effect of RSV and PTX on BCRP protein expression in NCI-H460 cells. The graph represents the quantification results normalized to β-actin levels. Values not sharing a common marking (a, b, c) differ significantly at P<0.05 (DMRT). |