 |
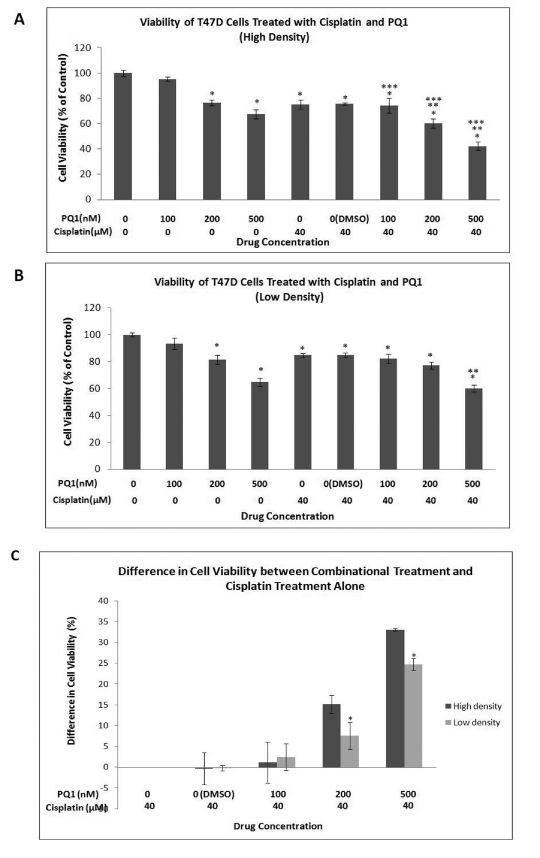
| Figure 3: PQ1 increases cytotoxicity of cisplatin and the enhancement depends on cell density. T47D cells were treated with PQ1 and cisplatin alone or in combination as indicated. Cell viability was measured under high density (A) and low density (B). Graphical presentation of three independent experiments is presented with statistical significance. * P-value is <0.05 compared to control. **P-value is <0.05 compared to cisplatin treatment. *** Pvalue is <0.05 compared to PQ1 treatment. (C) Quantification of differences in survival, caused by PQ1 at different concentrations in the combinational treatment between low density and high density. The viabilities of cells treated with cisplatin alone at high and low density were used as controls. Data were obtained in three independent experiments and are represented as the mean ± S.E. * P-value is <0.05 compared to treatment at high density. |