 |
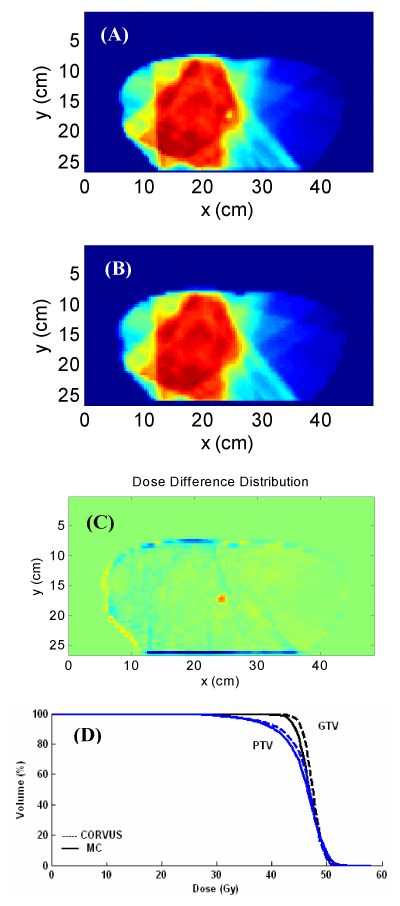
| Figure 2: (a) MC dose distribution, (b) PB dose distribution, (c) dose difference between MC and PB for the isocenter slice, and (d) GTV and PTV DVHs. This case showed a 17.9% difference in PTV EUD as determined using the PB algorithm compared to the MC algorithm. |