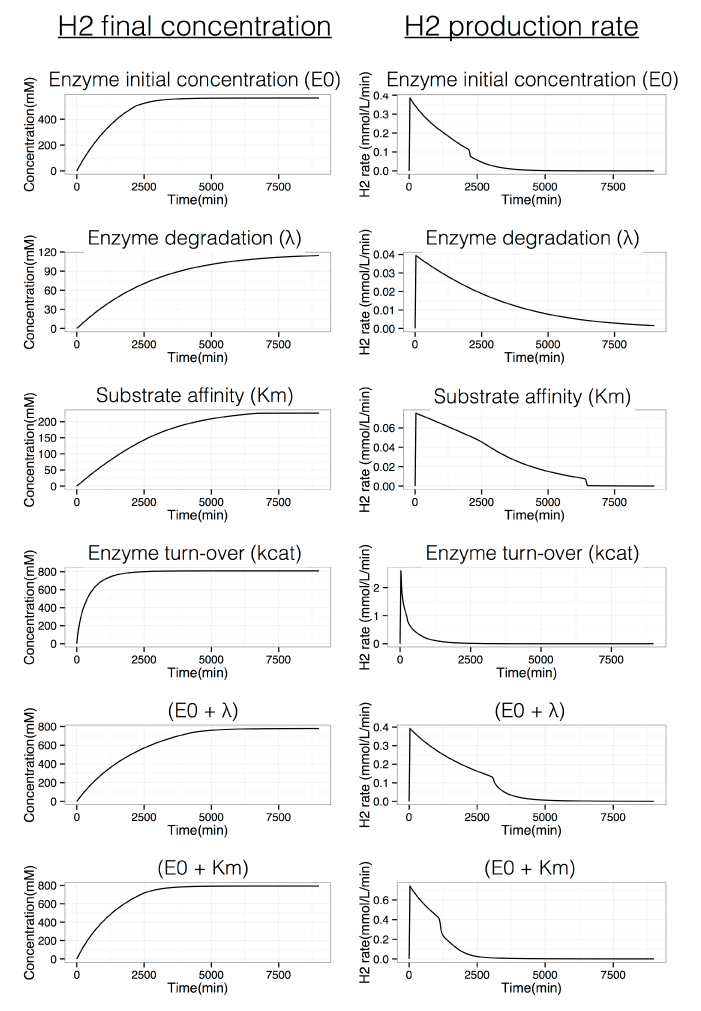
The parameters that were optimized by single stage optimization are enzyme initial concentration (E0), enzyme degradation parameter (λ), enzyme substrate affinity (Km) and enzyme turn-over (kcat). The combination of parameters that were optimized by double stage optimization was E0+λ and E0+Km. Simulations time were of 9000 min with 70 mM cellobiose, 70 mM of phosphate and 1mM of NADP as starting substrate concentrations.