 |
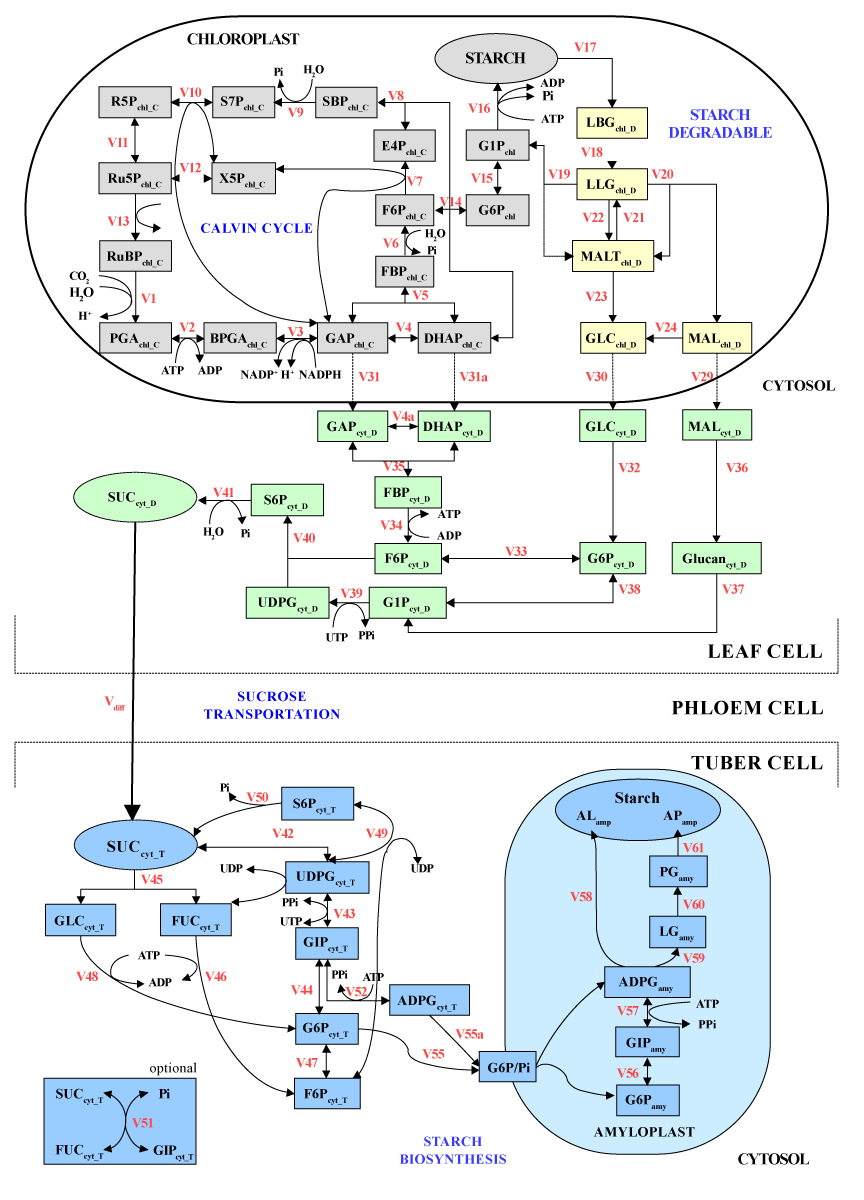
| Figure 2: The overall pathway of starch biosynthesis. The scheme exhibits the scope of pathway under study, starting from CO2 fixation in the Calvin cycle and ending at amylose and amylopectin production. The constituent metabolic pathways in the starch production process are marked by colour tones: grey-Calvin cycle, yellow-starch degradation and sucrose synthesis, and blue-permanent starch synthesis. Metabolic reactions driven by enzymes (red texts) are represented by arrows (→), while metabolites are denoted by squares and ovals with black labels. The abbreviations of enzyme as well as metabolite names, and enzyme kinetic information used in the studied model are described in Appendix (Table A1) and supplementary data (Tables S1-S4), respectively. |