 |
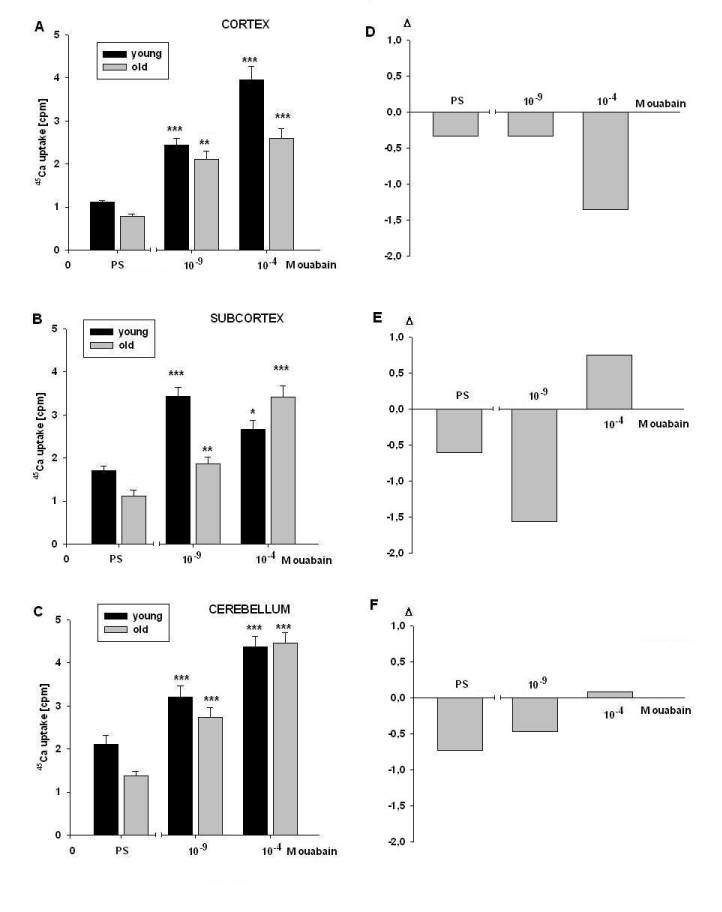
| Figure 5: The effect of ouabain injection (10-9, 10-4 M) on cortex, subcortex and cerebellum tissues’ 45Ca2+ uptake (A-C) in two age groups. Abscissas of A-F indicate doses of ouabain (PS injection, i.e. 0M ouabain, 10-9, 10-4 M). Ordinates of A-C indicate 45Ca2+ uptake content counting per minute, ordinates of D-F – delta (Δ) determines the difference between 45Ca2+ uptake in two age groups. Error bars indicate the standard error of the mean (SEM) for three independent experiments. The symbols (*), (**) and (***) indicate P< 0.05, P<0.01 and P<0.001, respectively. A difference which is not statistically significant means that P>0.05. |