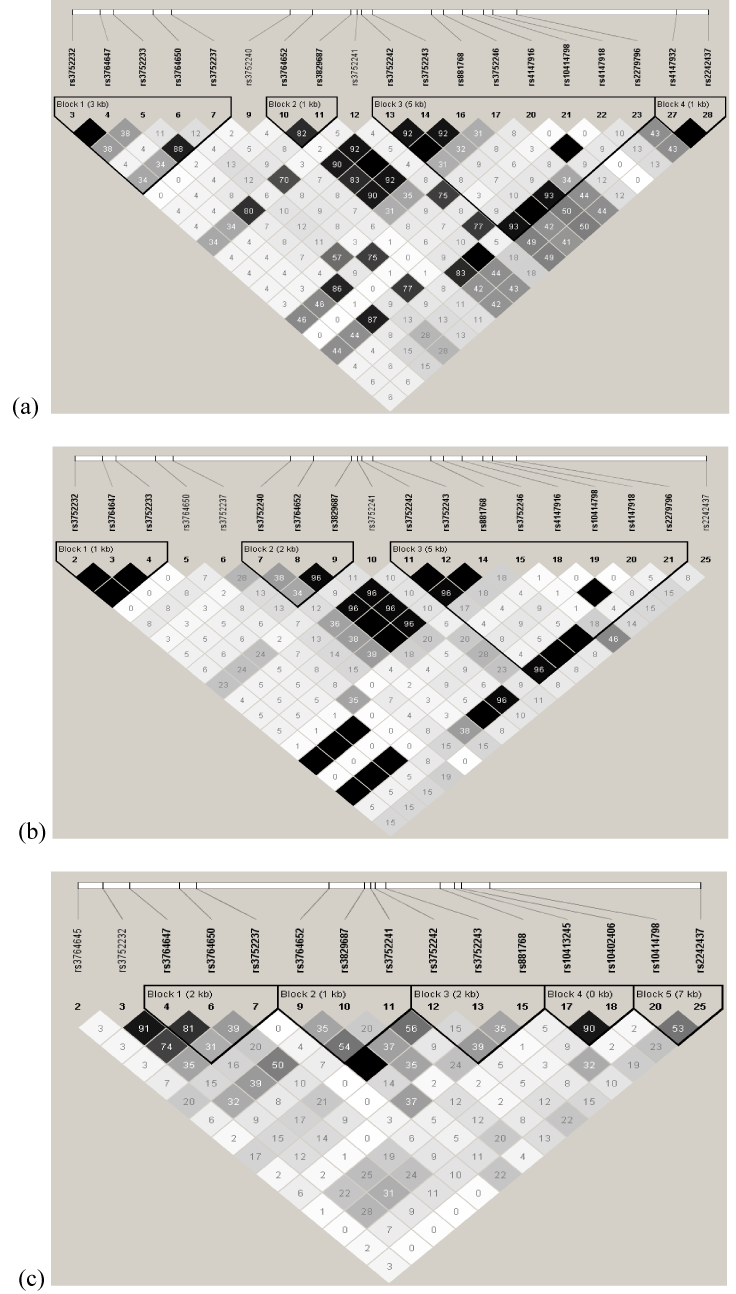
(a) pairwise r2 of CHB+JPT (b) pairwise r2 of CEU (c) pairwise r2 of YRI
 (a) pairwise r2 of CHB+JPT (b) pairwise r2 of CEU (c) pairwise r2 of YRI |
| Figure 1: Linkage disequilibrium structure of ABCA7 gene in HapMap population. White, shade of grey and black square indicate no LD (r2 = 0), intermediate LD (0 < r2 < 1) and strong LD (r2 = 1), respectively. The haplotype block indicated by bold black line are defined by the default definition of confidence intervals (Gabriel et al., 2002) in Haploview software. |