 |
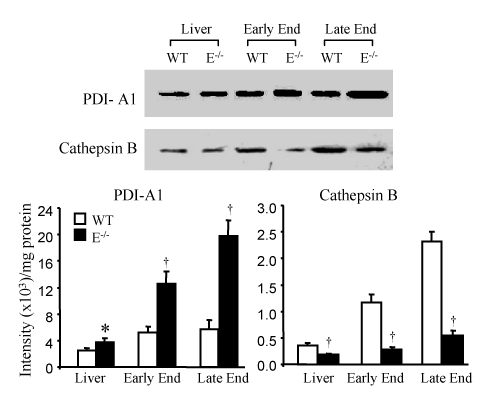
| Figure 3: Western blot analysis of differentially expressed proteins in the whole liver and hepatic endosomes (end) obtained from ApoE-/-/B48/48 (E-/-) and wild-type (WT) mice. Western blot analysis was performed with antibodies against mouse PDIs and cathepsin B. The photographs show representative images of PDIs and cathepsin B western blots. PDIs and cathepsin B protein levels are expressed as relative band fluorescence intensity. Values are mean ± SEM of 5 separate experiments in which endosomes are pooled from 2 mice for each experiment. * and † represent P <0.05 and <0.01, respectively as compared to wild-type mice. |