 |
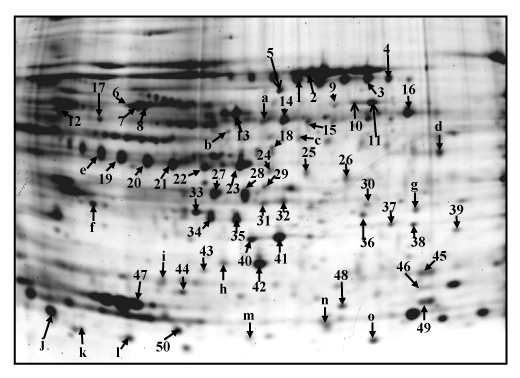
| Figure 2: Representative Sypro Ruby-stained gel image shows protein spots of interest. Following DIGE analysis, 2-D gels were post-stained with Sypro Ruby. The protein spots, of which the abundance differed significantly among endosomes, were excised and analyzed with MALDITOF mass spectrometry. Tryptic peptide masses, obtained from the mass spectrometric analysis, were subjected to database searching. Fifty spots were identified and indicated by numbers, which correspond to line entries in Table 1. Fifteen protein spots (indicated by letters) were unidentified due to poor signal in the mass spectrum, low-abundance features, or low molecular weight proteins. Letters correspond to line entries in Table 2. |