 |
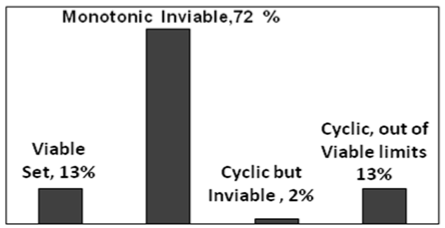
| Figure 3: The simulated dataset of multi-parametric global sensitivity analysis. The dataset can be classified into, (i) 13% that showed a cyclic steady state response within the viable range of 2-4 hours of cycle time chosen; (ii) 72% that showed a monotonic response; (iii) 2% that showed a non steady state cyclic behavior and (iv) 13% that showed a cyclic steady state but with a period both less than 2 hours or greater than 4 hours. |