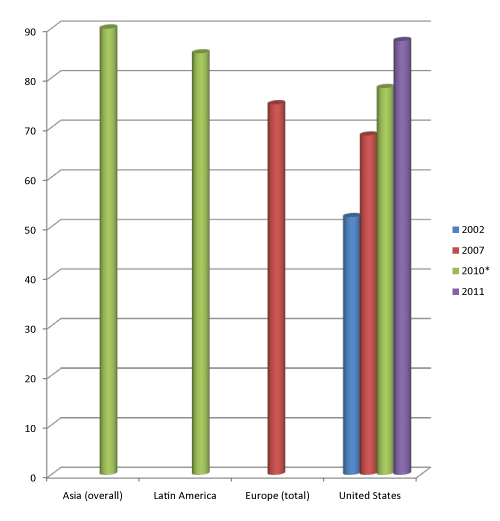
Note 2: Percentages shown are descriptive summary statistics which calculated percent of sample population who claimed sensitive skin by dividing number of subjects who claimed sensitive skin by total population. Source of data: Farage et al., 2012 [23]