 |
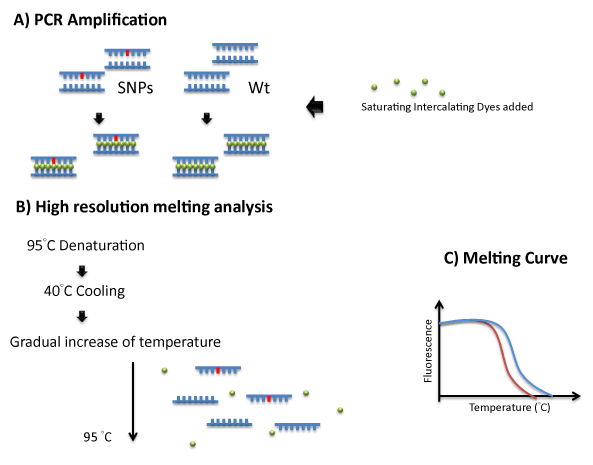
| Figure 2: The diagram illustrates the principle of HRM analysis. A) The DNA of interest is amplified by PCR. B) High resolution melting analysis is performed after PCR amplification. It begins with DNA denaturation at 95°C and cooling down to 40°C, followed by a gradual increase of temperature from around 65°C up to 95°C. Amplicons separate when the melting temperature is reached and thus the intercalating dyes are released and fluorescent signals decrease. C) The signal changes are detected upon laser excitation during analysis and melting curve are recorded accordingly. |