 |
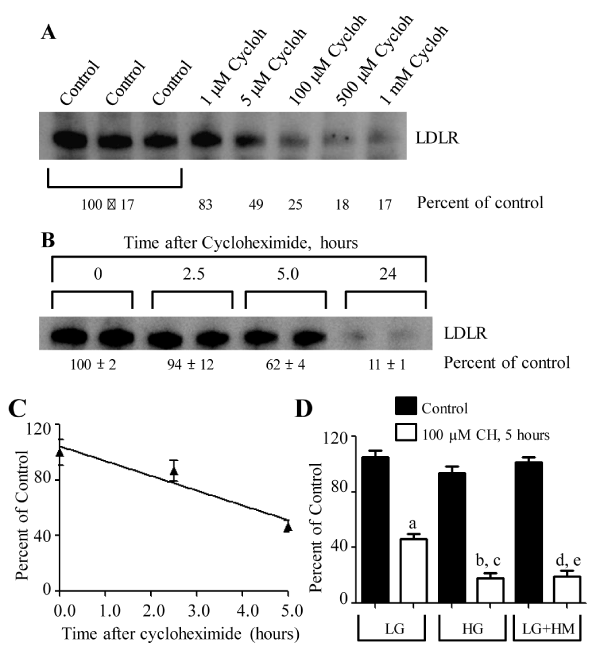
| Figure 4: Effects of HG and LG+HM on the half-life of the LDL receptor protein in C3A cells. (A) Dose-response study. Cells grown in LG for 6 days were treated with increasing amounts of cycloheximide (1 μM to 1 mM) for 24 hours. (B) Time-course study. Cells grown in LG for 6 days were treated with 100 μM of cycloheximide for increasing times. Controls refer to samples from cells in LG not treated with cycloheximide. Typical Western blots for LDL receptor are shown in both (A) and (B). Data are presented as percentage of LDL receptor protein remaining relative to control samples. (C) The percentage of receptor protein remaining (y axes) was plotted against the time point (x axes), and the half-life of the LDL receptor protein was estimated from the plot. (D) Cells grown in LG, HG, and LG+HM for 6 days were treated with 100 μM of cycloheximide (CH) for 0 (control) or 5 hours. Data are presented as percentage of control mean ± SEM for n=6. “a” refers to p<0.0001, when comparing LG and LG+CH. “b” refers to p<0.0001, when comparing LG and HG+CH. “c” refers to p=0.0014, when comparing LG+CH and HG+CH. "d" refers to p<0.0001, when comparing LG and LG+HM+CH. “e” refers to p=0.0024, when comparing LG+CH and LG+HM+CH. |