 |
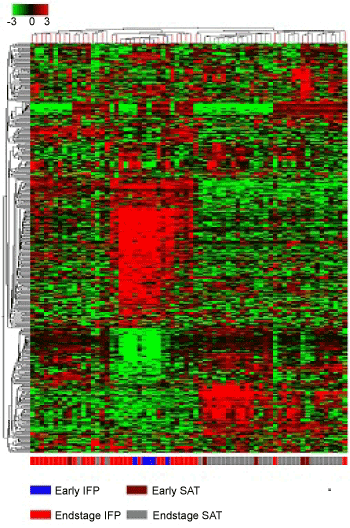
| Figure 1: Unsupervised hierarchical clustering analysis of the most variable genes across all samples (SD>2.0). The clustering shows both the overall similarities and differences between diseased and normal subcutaneous adipose tissue (SAT) and infrapatellar fat pads (IFP). |