 |
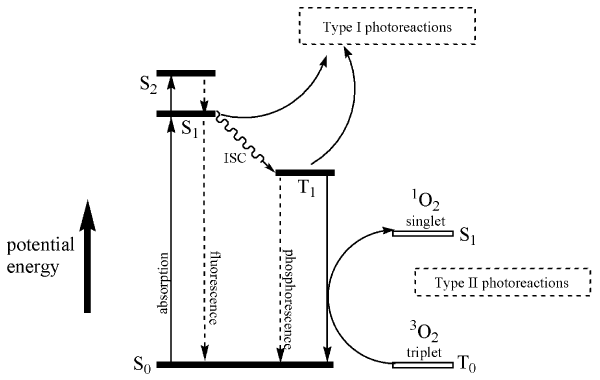
| Figure 1: Jablonski diagram representing the excitation and relaxation of a photosensitizer, and type I and type II photoreactions. Horizontal bars represent energy levels of the different excitation states of a photosensitizer (full bars) or of molecular oxygen (empty bars). S0=ground singlet state; S1=first excited singlet state; S2=second excited singlet state; T0=ground triplet state; T1=first excited triplet state; ISC=intersystem crossing. Adapted from [4]. |