 |
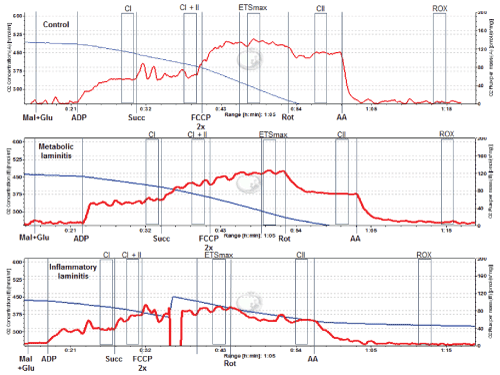
| Figure 1: Example of HRR curves. Illustration of the curves obtained via the Oroboros oxygraph software [DatLab 4.0, OROBOROS DatLab software, Innsbruck, Austria] for one horse of each group [Control, Metabolic laminitis and Inflammatory laminitis]. The blue line represents the oxygen concentration in the medium [pmol/ml] and the red line represents the slope of the blue line, thus the oxygen flux expressed as tissue mass-specific respiration [pmol oxygen/sec*mg of permeabilized fibers]. The vertical lines represent the different substrates/inhibitors/ uncouplers added to the oxygraph chambers. The black rectangles represent the selected time laps during which CI [Complex I], CI + II [Complex I and 2], maximal respiratory [ETSmax] and CII [Complex II] capacities were calculated by DatLab™. |