 |
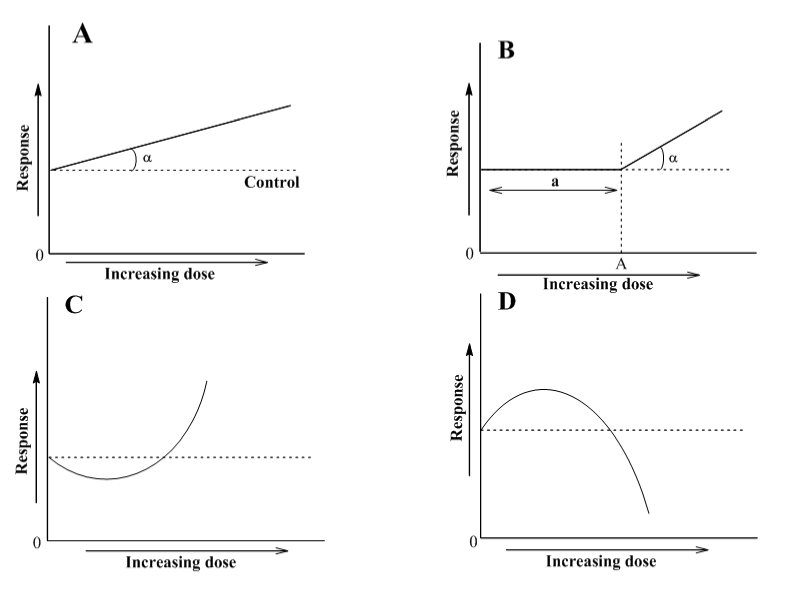
| Figure 1: Dose-response relationships: (A) the linear model, (B) the threshold (linear) model, (C) the J-shaped model, and (D) the inverted U-shaped model, or inverted J-shaped model. The dashed line shows initial level of the response being measured (endpoint). |