 |
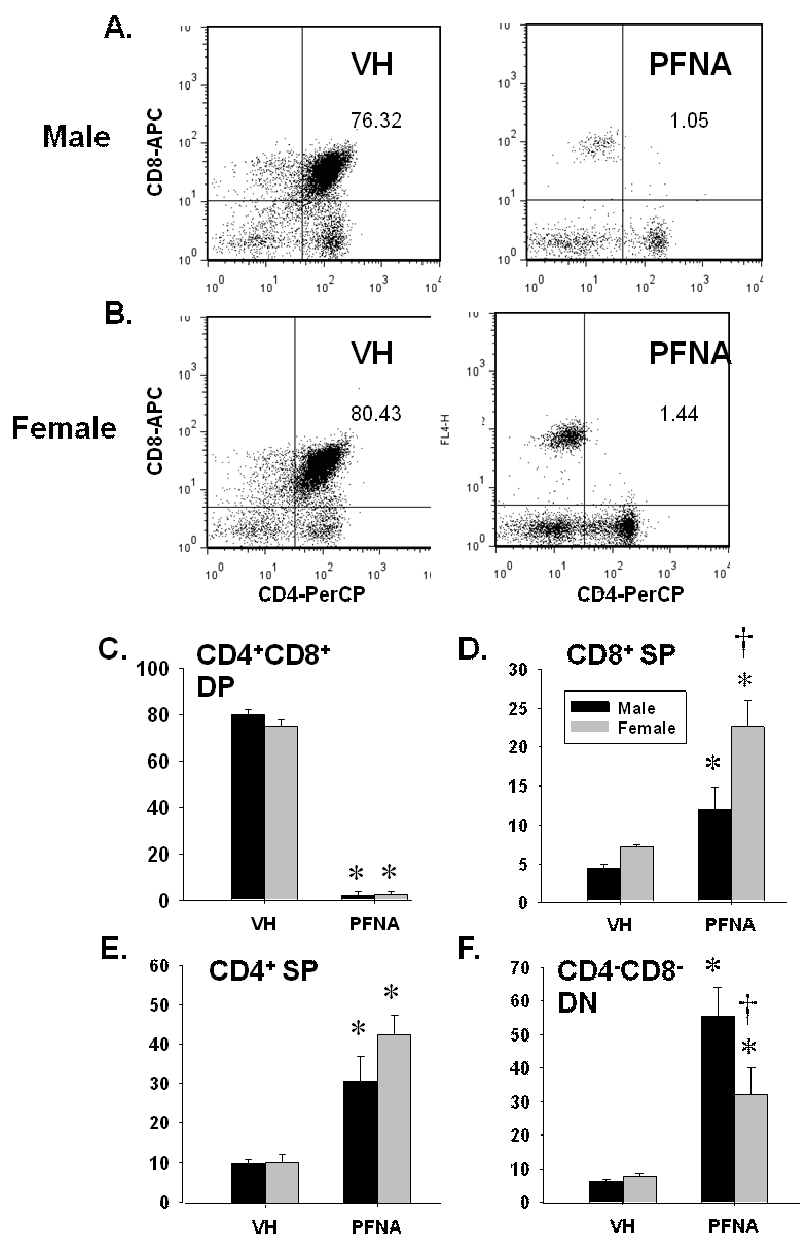
| Figure 5: Loss of the CD4+CD8+ double-positive T cell population in thymus of PFNA-treated mice. Unfractionated splenocytes were washed, incubated with fluorochrome-conjugated antibodies and analyzed by flow cytometry. Representative dot plots of CD4+ and CD8+ T cells are depicted from VH-treated and PFNAtreated (A) male and (B) female mice. Graphical representation of (C) CD4+ and (D) CD8+ T cell percentages with respect to the whole splenocyte population. The data are presented as mean ± SE. * denotes p<0.05 as compared to the vehicle (VH) control for the same gender. † denotes p<0.05 as compared between genders for the same treatment group. |